© 2016, IRJET | Impact Factor value: 4.45 | ISO 9001:2008 Certified Journal
| Page 2266
Performance Based Evaluation of Flat Slab Structures with Circular
Columns
Balesh.B.Koni
1, Dr.S.S.Dyavanal
21
Post Graduate Student, BVBCET, Hubli, Karnataka, India
2
Assistant Professor, BVBCET, Hubli, Karnataka, India
---***---Abstract -
The conventional slabs have proven to be heavystructures, with larger depths of beams covering most of the storey height. The flat slabs have been replacing the conventional slabs due to their functional and aesthetical advantages. The use of flat slabs in structures has lead to reduction in storey height, ease of construction and cost effective technology. However, the higher flexibility of flat slabs has resulted in their inability to sustain earthquake loads. The present study involves the evaluation of the non-linear seismic behaviour of various flat slab structures when circular columns are provided. Specific investigation on the behaviour of seven storey building models is considered. All the buildings are assumed to be located in seismic zone III. The medium soil stratum is chosen for the study. The buildings are modelled as bare frame and brick infill frame models. The pushover analysis is performed considering parameters of FEMA 440, with user defined hinge properties. The analysis is performed using ETABS 2013 V13.2. The hinge status, ductility ratio, safety ratio and global stiffness are studied to assess performance of the models.
Key Words: Soft Storey, Infill, Pushover Analysis, Ductility, Stiffness, Performance Levels, Global stiffness, Safety ratio, Target displacement, User defined hinges
1. INTRODUCTION
In this 21st century, with drastic development in every field,
the need for land has rapidly increased. The increasing need for infrastructure has been the challenge for the construction industry. Multi-storey structures are coming up to combat the problem of space availability. However, there are limitations on the height and weight of the structure, considering SBC of the soil. The conventional buildings with beam-column frames are heavy structures, with beams contributing greatly to the weight of the structure as they tend to be larger in their depth. The beams consume lot of space in the structure and also disturb the aesthetical beauty of the structure. The eradication of beams has been the motive of structural engineers to meet the requirements of the present days. The flat slabs serve the purpose greatly as they are the slabs directly resting on columns, thus negating the need for beams. The flat slabs are easy to cast and need simple form work for construction, thus reducing the cost of
construction. The main reason for failure of flat slabs under gravity loads is punching shear at the junction of slab and column. The drops and column heads are usually provided to take care of the punching shear. However, the stability of flat slabs under earthquake loads is a matter of concern. This is mainly due to the high flexibility of flat slabs.
Many studies are carried out on the feasibility of flat slabs under the earthquake loads.Pradip S. L. and Aniket B. R. (2015) compared the seismic behaviour of flat slabs with conventional slabs and found that flat slabs had a lateral displacement of around 28% higher than conventional slabs and base shear of around 50% less than the conventional slabs [16]. Gouramma G. and Jagadish K. G. (2015) studied the effect of various seismic zones on the behaviour of flat slabs. The displacement of flat slabs was found to be 30% to 50% higher than flat slabs. Many studies were carried out to evaluate the performance of the flat slab structures [17]. There is a necessity to study the non-linear seismic behaviour of these structures with user defined hinges. However, all the studies carried out, involved only the square columns. The circular columns are not usually preferred due to their high cost and complications in design and execution. Previous studies have shown that the circular columns are better than square columns in their properties of ductility and torsion resistance. There is a need to check the feasibility of circular columns in flat slab structures. The present study aims at investigating the non-linear behaviour of flat slab structures with circular columns, when subjected to earthquake loads. An attempt is made to study the behaviour of bare frame and brick infill frame with soft storey structures. The study is based on the recommendations of IS 1893 (Part-1): 2002. ETABS 2013 V13.2 software is considered for the study.
2. STRUCTURAL MODELLING
© 2016, IRJET | Impact Factor value: 4.45 | ISO 9001:2008 Certified Journal
| Page 2267
junction with columns, which act integrally with slabs. The edge beams are modelled to behave integrally with the slabs at the edges. Brick masonry walls are modelled as equivalent diagonal struts, with moment released pinned connection at joints. The footings are assumed to be fixed, considering the soil to be non-settling and even. Damping ratio of 5 percent is considered for all natural modes. The seismic zone III with zone factor 0.16 is assumed for the study. The medium soil classified as type 2 soil is considered [13]. The plinth beams are modelled at an elevation of 2m from the foundation, to account for behaviour of columns from foundation to plinth level. The ground storey is modelled as a soft storey with no infill walls. The pushover analysis is carried out as per FEMA 440 parameters, with user defined hinge properties. The moment (M3) hinges are assigned for beams, axial load-
moment (P-M3) hinges are assigned for columns and axial
load (P) hinges are assigned to struts. For the purpose of study, the models are noted as follows,
Model 1: Flat slab without drop model Model 2: Flat slab with drop model Model 3: Flat slab with edge beams model
3. BUILDING DESCRIPTION
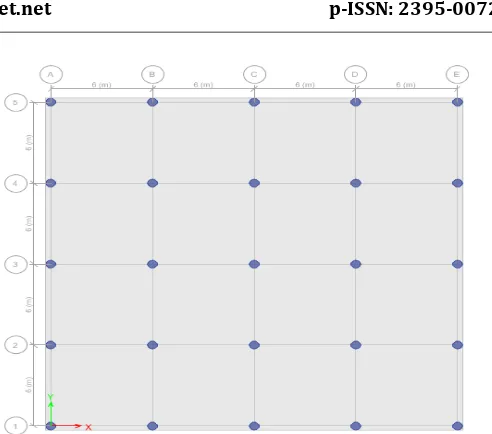
The buildings are modelled as seven storey three dimensional special moment resisting structures with bare frames and with unreinforced brick infill frame buildings, with a soft ground storey. The building is composed of four bays of 6m span each in both longitudinal and lateral directions. The level of plinth from the foundation is assumed to be 2m and all other storeys are of 3m height. The slab projection beyond the centrelines of edge columns is taken to be 0.3m. Concrete grade of M25 with density 25kN/m3, elastic modulus 25000MPa and Poisson’s ratio 0.2 is considered. The steel grade of Fe-415 is assumed for the study. The brick infill of elastic modulus 1067MPa and density of 20kN/m3 [20] is assumed for the purpose of present study. The size of all the beam sections is 300 mm by 500mm. The diameter of circular columns is 565mm. The thickness of flat slab is 200mm, with thickness of drop being 350mm. The interior drops are 3m by 3m in plan. The edge drops are 1.8m by 3m in plan. The corner drops are 1.8m by 1.8m in plan. The thickness of walls is 300mm. The depth of equivalent struts is modelled as based on the empirical formula [20]. The floor finishes of 1kN/m2 and Live loads of 3kN/m2 are considered. The earthquake live loads are considered as per IS 1893 (Part-1): 2002. The Fig.1 to Fig. 5 shows the plans and elevations of the models under consideration.
Fig -1: Plan of flat slab without drops model
Fig -2: Plan of flat slab with drops model
[image:2.595.307.553.67.284.2] [image:2.595.309.540.330.516.2] [image:2.595.312.542.536.740.2]© 2016, IRJET | Impact Factor value: 4.45 | ISO 9001:2008 Certified Journal
| Page 2268
Fig -4: Elevation of bare frame modelsFig -5:Elevation of Infill frame models with a soft ground storey
4. ANALYSIS PROCEDURE
The non-linear seismic analysis is performed by initially carrying out linear analysis by equivalent static and response spectrum methods and then distributing the design base shears laterally over the height of the building. The pushover analysis is considered for the present study, which can be performed in two ways. One is force-controlled method, which is based on a targeted load and another is displacement-controlled method, based on a target displacement. The lateral load is increased proportionally and the non-linear behaviour of the building models is studied. The pushover analysis is performed initially for full gravity loads and then for specific loads obtained by equivalent static and response spectrum methods. The target displacement is set to 4 percent of the height of the
structure. The performance properties of the building models are studied by FEMA 440 parameters, which involve equivalent linearization techniques.
4.1 User Defined Hinge Properties
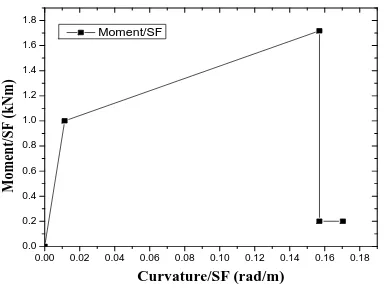
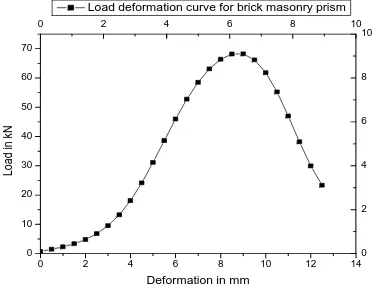
The user defined hinge properties are obtained by carrying out moment-curvature analysis of beams and columns and load-deformation analysis for brick infill walls. VBA program is used to write the programs for obtaining moment-curvature relation as per recommendations of IS 456:2000 [12]. The load deformation relation is obtained by experimental study on the bricks [3]. The moment-curvature curve for the beam section of size 300mm by 500mm is shown in Fig.6. The P-M interaction curve and moment-curvature for circular columns is obtained by designing an equivalent square column. The curves obtained for circular columns of size 565mm are shown in Chart 1 and Chart 2. Load deformation curve for brick infill is shown in Chart 3.
0.00 0.02 0.04 0.06 0.08 0.10 0.12 0.14 0.16 0.18 0.0
0.2 0.4 0.6 0.8 1.0 1.2 1.4 1.6 1.8
Mo
m
en
t/S
F
(
k
N
m
)
Curvature/SF (rad/m)
Moment/SF
Chart -1: Moment curvature curve for beam section of size 300mm by 500mm
0.00 0.02 0.04 0.06 0.08
0.0 0.2 0.4 0.6 0.8 1.0
Mo
m
en
t/S
F
(
k
N
m
)
Curvature/SF (rad/m)
Moment/SF
[image:3.595.324.516.376.520.2] [image:3.595.321.515.575.720.2]© 2016, IRJET | Impact Factor value: 4.45 | ISO 9001:2008 Certified Journal
| Page 2269
0 100 200 300 400 500 600 700
0 500 1000 1500 2000 2500 3000 3500 4000 4500 5000 5500 6000 6500 Axi a l lo a d (kN ) Moment (kNm) Axial load
Chart -3: P-M interaction curve for Circular column section of diameter 565mm.
0 2 4 6 8 10 12 14
0 10 20 30 40 50 60 70
0 2 4 6 8 10
0 2 4 6 8 10 L o a d in k N
Deformation in mm
Load deformation curve for brick masonry prism
Chart -4: Load-Deformation curve for brick infill
5.
RESULTS AND DISCUSSION
The pushover analysis is performed on all the models in the study for both equivalent static and response spectrum load cases. It is observed that the results in transverse direction, i.e. default x-direction in ETABS 2013 V13.2, are critical. Hence, the results of transverse direction are discussed in this paper.
5.1 Location of Hinges
The performance levels of immediate occupancy, Life safety and collapse prevention are set initially to study the pushover analysis results for both equivalent static and response spectrum load cases in X-direction. The hinge locations are studied at these performance levels to identify the weaker members in the structure. The locations of hinges at initial and collapse yield are recorded. The corresponding base force and displacements are studied to
[image:4.595.299.568.214.347.2]get an idea of load carrying capacity and stiffness of the structure. The location of hinges and corresponding base force as well as displacement for both equivalent static and response spectrum load cases are presented in Table 1 to Table 4.
Table -1: Location of hinges for seven storey bare frame building models by equivalent static pushover analysis
Model No. Displacement (mm) Base force (kN) Hinge Locations A- B B-IO IO-LS LS- CP CP- C C-D Total
1 IY 51.1 2644.33 379 97 4 0 0 0 480 CY 177.7 3230.08 333 57 0 48 0 42 480
2 IY 55.9 2986.86 387 90 3 0 0 0 480 CY 155.4 3241.76 339 51 0 49 0 41 480
[image:4.595.47.236.326.471.2]3 IY 43.5 2732.78 891 135 14 0 0 0 1040 CY 170.6 3454.18 817 135 0 40 0 48 1040
Table -2: Location of hinges for seven storey infill frame building models by equivalent static pushover analysis
Model
No. Displacement (mm) Base force (kN)
Hinge Locations A-
B B –IO IO-LS LS-CP CP-C C-D Total
1 IY 35.5 2984.68 632 82 6 0 0 0 720 CY 137.3 3272.06 630 0 0 2 0 88 720
2 IY 31.6 2979.36 632 84 4 0 0 0 720 CY 133.4 3276.71 630 0 0 39 0 51 720
[image:4.595.302.568.419.537.2]3 IY 42 3214.06 1174 85 21 0 0 0 1280 CY 127.4 3500.69 1163 19 0 41 0 57 1280
Table -3: Location of hinges for seven storey bare frame building models by response spectrum pushover analysis
Model
No. Displacement (mm) Base force (kN) Hinge Locations A- B B-IO IO-LS LS-CP CP-C C-D Total
1 IY 37.4 2745.16 404 68 8 0 0 0 480 CY 152.2 3325.88 368 22 0 55 2 33 480
2 IY 42.4 3063.43 381 93 6 0 0 0 480 CY 139.08 3324.05 379 11 0 50 0 40 480
© 2016, IRJET | Impact Factor value: 4.45 | ISO 9001:2008 Certified Journal
| Page 2270
Table -4: Location of hinges for seven storey infill framebuilding models by response spectrum pushover analysis
Model
No. Displacement (mm) Base force (kN)
Hinge Locations A-
B IO B- IO-LS LS-CP CP-C C-D Total
1 IY 29 3049.41 638 79 3 0 0 0 720 CY 131.4 3329.16 630 0 0 23 0 67 720
2 IY 25.8 3043.35 630 88 2 0 0 0 720 CY 123.9 3329.77 630 0 0 45 0 45 720
3 IY 34.8 3277.58 1181 82 17 0 0 0 1280 CY 123.4 3593.55 1170 20 0 32 2 56 1280
From table 1 to table 4, it is observed that the base shear is the maximum in models with edge beams. The models without drops resulted in least base shear. Among bare frame models, the provision of drops didn’t have much effect of base shear, however the reduction in displacement in presence of drops is observed to be 12.55%. The edge beams increased base shear by 6.94%. There is no much difference in base shears of bare frame and infill frames, but the displacement in infill frame models is 24% to 38% lower than bare frame models.
The hinges lying within life safety level for bare frame models 1, 2 and 3 are 81.25%, 81.25% and 91.53%, respectively. The hinges lying within life safety level for infill frame models 1, 2 and 3 are 87.5%, 87.5% and 92.34% respectively. The results are almost similar in both equivalent static and response spectrum load cases.
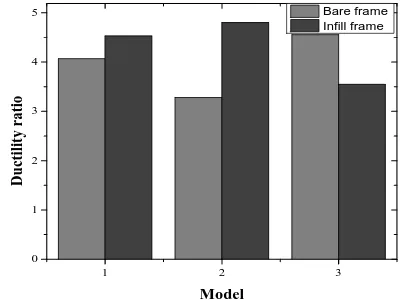
5.2 Ductility Ratio
Ductility ratio is the ratio of displacement at collapse yield to the displacement at initial yield [15]. The ductility is the measure of post-yield stability of the structure. A minimum ductility of 4 is specified, so that buildings are allowed to deflect in order to save the cost and reduce the stresses in the structure. However, the buildings should not cross the ductility ratio of 6, in order to avoid large deflections in the structure. The ductility ratios for various models in the study are presented in the Chart 5 and Chart 6.
1 2 3
0 1 2 3 4
D
u
ct
il
it
y
r
a
tio
Model
Bare frame Infill frame
Chart -5: Ductility ratio for seven storey models with equivalent static load case
1 2 3
0 1 2 3 4 5
D
u
ct
il
it
y
r
a
tio
Model
Bare frame Infill frame
Chart -6: Ductility ratio for seven storey models with response spectrum load case
© 2016, IRJET | Impact Factor value: 4.45 | ISO 9001:2008 Certified Journal
| Page 2271
5.3
Safety Ratio
Safety ratio is defined as the ratio of base force at performance point to the base shear obtained by equivalent static method. The buildings are said to be unsafe if the safety ratio is less than 1, safe if safety ratio is 1 and over safe if more than 1. Over safe design is preferred to allow higher tolerance to unexpected earthquake loads. The safety of various flat slab models in the study is assessed and the results are shown in the Chart 7.
1 2 3
0.0 0.5 1.0 1.5 2.0 2.5 3.0 3.5 4.0
S
af
et
y r
at
io
Model
Bare frame Infill frame
Chart -7: Safety ratio for seven storey building models
The bare frame flat slab models 2 and 3 resulted in 2.5% and 7.1% increase in safety ratio, respectively, compared to model 1. The flat slab with edge beams models are found to be safer compared to other two models. The infill walls did not show much difference in safety of the models. There is a slight increase of 1.2% and 0.5% in the safety ratio of model 1 and model 2, respectively, with provision of infill walls. However, the safety ratio for edge beams reduced slightly by 1.9%, with introduction of infill walls. It is observed that safety of the building models increased with the stiffness of the models. On the whole, all the building models are over safe.
5.4
Global Stiffness
Global stiffness is the ratio of base force and corresponding displacement at performance point. The earthquake loads tend to occupy at the weaker zones, thereby hindering the effective distribution of loads in the building. The soft storey in the buildings experiences higher storey drift and hence, higher damage. The global stiffness measures the uniformity of the stiffness of building members. The global stiffness obtained for various models in the present study is presented in the Chart 8.
1 2 3
0 5 10 15 20 25 30 35
G
lo
b
a
l
st
if
fn
es
s
Model
Bare frame Infill frame
Chart -8: Global stiffness for seven storey building models
It is observed that the provision of drops and edge beams increased global stiffness of the building models by 15.52% and 22.22%, respectively, compared to flat slab models without drops. The global stiffness for model 1, 2 and 3 enhanced with the provision of infill walls, by an amount of 25.07%, 25.11% and 35.83%, respectively. On the whole, flat slab models with edge beams are found to be highly stiff among all the models. The infill walls increased the stiffness of building models.
6.
CONCLUSIONS
1. The displacement at performance levels is reduced by the provision of drops and edge beams in flat slab models. This is due to stiffness contributed by drops and edge beams.
2. The drops did not have any significant effect on the base force, but the base force increased by 7% on provision of edge beams.
3. More number of hinges are found within life safety range for models with drops and edge beams. This shows that performance of flat slabs enhanced on provision of drops and edge beams. The critical hinges are found at the foundation level. The columns below plinth level and in soft storey experienced highest damage.
4. The results of pushover analysis with response spectrum load case showed better ductility compared to equivalent static load case. The bare frame models with drops and infill frame models with edge beams are found to have low ductility. The ductility improved with introduction of infill walls for model 1 and model 2, but reduced in case of model 3.
5. The safety ratio is slightly increased by the provision of infill walls. The edge beam models are observed to be highly safe.
© 2016, IRJET | Impact Factor value: 4.45 | ISO 9001:2008 Certified Journal
| Page 2272
stiffness of the buildings. The infill walls further improved the global stiffness of the buildings.
REFERENCES
[1]. Agarwal, P. and Shrikhande, M. (2006), “Earthquake design of structures” Prentice Hall of India Private Limited New Delhi India.
[2]. Das, D. and Murty, C. V. R. (2004), “Brick masonry infills in seismic design of RC framed buildings (Part 2)”, The Indian Concrete Journal pp 31-37
[3]. Rihan, M., “Seismic evaluation of multistorey buildings with soft storey”, M.tech Thesis - 2013.
[4]. Praveen, R. and Dyavanal, S.S. (2014), “Non-linear static analysis of G+6 storeyed RC buildings with openings in infill walls”, IJERA, ISSN: 2248-9622, Vol. 4, Issue 9, pp51-58.
[5]. Applied Technology Council, ATC 40,(1996),“Seismic evaluation and retrofit of concrete buildings”, Vol.1 and 2, California.
[6]. FEMA 356, 2000 “Pre-standard and commentary for the seismic rehabilitation of buildings”, ASCE for the Federal Emergency Management Agency, Washington, D.C.
[7]. Federal Emergency Management Agency, FEMA-440
(2005), “Improvement of nonlinear seismic analysis procedures”, California.
[8]. FEMA 454: 2006, “Designing for earthquakes: A manual for Architects”, December 2006.
[9]. FEMA 273: 1997, “ NEHRP guidelines for the seismic
rehabilitation of buildings”
[10].ETABS 2013 V13.2, “Extended Three-Dimensional
Analysis of Building Systems”, CSI, America.
[11].IS 456:2000, “Code of practice for plain and reinforced concrete”, Bureau of Indian Standards, New Delhi, India.
[12].IS 1893 (Part 1): 2002, “Indian standard criteria for Earthquake Resistant Design of Structures”, Bureau of Indian Standards, New Delhi 110002.
[13].IS 13920:1993, “Code of Practice for Plain and Reinforced Concrete”, Bureau of Indian Standards, New Delhi, India.
[14].Park, R. and Paulay, T. (1975), "Reinforced Concrete Structures," Christ church, New Zealand, Aug, pp. 270-343.
[15].Pradip, S. L. and Aniket, B. R.“Seismic Behaviour of Flat Slab Systems” Journal of Civil Engineering and Environmental Technology, Volume 2, Number 10; April-June, 2015 pp. 7-10
[16].Gouramma, G. and Jagadish, K. G“Seismic Performance of Different RC Slab Systems for Tall Building”, International Journal of Engineering Research Vol.3., Issue.4., 2015 (July-Aug)
[17].Amit, A. S. and Deotale, R.S., “Analysis And Design Of Flat Slab And Grid Slab And Their CostComparison”; ISSN: 2248-9622, Vol. 1, Issue 3, pp.837-848, 2012
[18].Mehmet, I. and Hayri, B.O., “Effects of plastic hinge properties in nonlinear analysis of reinforced concrete buildings”, Science Direct, Engineering structures 28, 2006.