© 2016, IRJET | Impact Factor value: 4.45 | ISO 9001:2008 Certified Journal
| Page 3089
Image Contrast Enhancement method based on Fuzzy Logic and
Histogram Equalization
Jaspreet Kaur
1, Amandeep Kaur
21
Dept. Of Computer Science, Punjabi University, Punjab, India
2
Assistant professor,Dept. Of Computer Science, Punjabi University,Punjab, India
---***---Abstract -
Histogram Equalization is a very effective and most widely used method to enhance the contrast of images. But in some situations where it is necessary to preserve the brightest factor of an image , histogram equalization does not works well and gives un-natural resultant images that are not desirable. A novel histogram equalization technique based on fuzzy logic is introduced in this paper. In the first step, Fuzzy histogram is computed based on fuzzy computation techniques to handle the inexactness of original values in a better way as compared to crisp histogram computation techniques. In the second step, the fuzzy histogram is decomposed into two sub-histograms based on the median value of the original image and then histogram equalization is applied on both histograms independently to maintain the luminance of the image. In the last step processed sub-images are composed into one image to produce the result. The experimental results show that the proposed method gives better result as compared to many existing methods and removes the washed out appearance of the images. The proposed method preserves the brightness of the original image.Key Words
:
Histogram Equalization,
Contrast, Median, Fuzzy Histogram.
1.
INTRODUCTION
One of the major problems with captured images is the poor contrast. Poor contrast may occur
because of the poor lightening conditions during image acquisition and shutter speed of a camera. So it is essential to improve the contrast of an image for better perception and visualization. Because image with high contrast and quality gives rich details. Contrast enhancement techniques are divided into major two parts that are spatial domain based enhancement and frequency domain based enhancement. Spatial domain image enhancement techniques work directly on pixel element of an image and frequency domain image enhancement works on the Fourier transform of the image.
In spatial domain, major technique of contrast enhancement is histogram equalization. As in histogram equalization, intensity values of an image are redistributed to improve the contrast. HE tends to introduce some annoying artifacts and unnatural enhancement, including intensity saturation effect [1]. Main cause of this problem is that HE normally changes the luminance of the image significantly which results into an output image that is saturated with very bright or dark intensity values.
© 2016, IRJET | Impact Factor value: 4.45 | ISO 9001:2008 Certified Journal
| Page 3090
into two parts based on the mean of the mean ofthe original image. Then histogram equalization is applied on each part separately. Thus using original mean, mean brightness is preserved. Wan et al. proposed dualistic sub image histogram equalization (DSIHE) that uses median of the input image rather than mean for histogram partition instead of mean brightness [3]. Chen and Ramli proposed minimum mean brightness error bi histogram Equalization (MMBEBHE), which is the extension of BBHE method that provides maximal brightness preservation [4]. Recursive mean separate HE (RMSHE) is another improved version of BBHE [5]. RMSHE recursively decomposes the histogram into sub-histograms rather than two sub histograms. Although the above mentioned methods are able to preserve the mean brightness yet not free from side effects such as, undesirable checkerboard effects, washed-out appearance and change in image brightness. To resolve the problems, mentioned above, Abdullah-Al-Wadud et al. introduced a dynamic histogram equalization (DHE) technique [6]. DHE divides the original histogram based on local minima but does not consider preserving of brightness. Then, Ibrahim and Kong proposed brightness preserving dynamic histogram equalization (BPDHE) [7].This method divides the image histogram based on local maxima of smoothed histogram. BPDHE assigns new dynamic range to each partition. At last, the output intensity is normalized to make the mean intensity of the final image equal to the input one. Brightness preserving dynamic fuzzy histogram equalization (BPDFHE) has been proposed by Sheet et al. which is an enhanced version of BPDHE [8]. The BPDFHE technique computes the image histogram in such a manner that no
remapping of the histogram peaks takes place. Only redistribution of the gray-level values in the valley portions between two consecutive peaks is performed. Images manipulated using BPDFHE techniques gain well-enhanced contrast and little artifacts. To resolve the problems of over enhancement and imperfection Fuzzy based histogram equalization techniques are proposed. Fuzzy set theory can handle the uncertainties, imperfections and vagueness in a efficient manner as compared to classical crisp values. The proposed Fuzzy histogram Equalization technique based on median works for both gray and color images. Proposed FHE technique not only improves the local contrast of the original image but also preserves the local contrast. Firstly, Fuzzy histogram is derived based on fuzzy logic. Secondly, Fuzzy histogram is decomposed into two sub histograms based on the median value or the input image. After this, Each histogram is equalized independently to enhance the contrast of the image .At last equalized histograms are composed together to get the result.
The organization of the paper is given as follows.. Section (2) presents enhancement of image using fuzzy method. In Section (3), the proposed algorithm for fuzziness calculation and contrast enhancement is presented. In Section (4), Image Quality Measures are introduced, In Section (5) results are discussed and Section (6) presents the conclusions.
2. Fuzzy Image Enhancement
© 2016, IRJET | Impact Factor value: 4.45 | ISO 9001:2008 Certified Journal
| Page 3091
image contrast enhancement and then fuzzy planeintensities are mapped back to image gray level intensities. The purpose is to generate an image of higher contrast than the input image by giving the larger weight to the gray levels that are nearer to the mean gray level of the image than to those that are farther from the mean. An image of size 𝑀 × 𝑁 pixels and L gray levels can be considered as an array of fuzzy singletons, each having a value of membership denoting its degree of brightness relative to some brightness levels with g = (0,1,2,...,L-1) [9]. The fuzzy matrix corresponding to this image can be written as
𝐹 = 𝜇𝑚𝑛
𝑔𝑚𝑛
𝑁 𝑛=1 𝑀
𝑚 =1 , Where 𝜇𝑚𝑛 ⊆ [0,1], (1)
Here g(m,n)represents the intensity of(m,n)th pixel and µmn is its membership value.
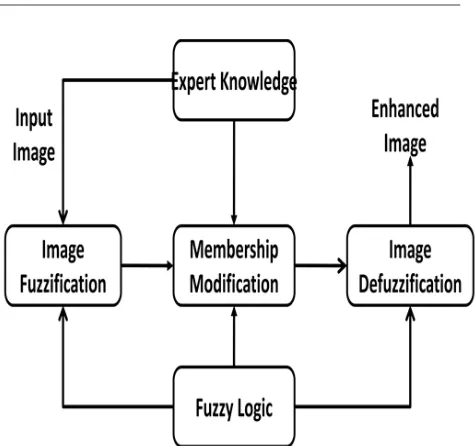
Fuzzy image processing (FIP) has three main stages: 1. Image fuzzification
2. Modification of membership values 3. Image defuzzification
The main power of fuzzy image processing is in the middle step (modification of membership values). After the image data are transformed from gray-level plane to the membership plane (fuzzification), appropriate fuzzy techniques modify the membership values. [10] The general structure of an FIP is shown in the figure.
Fig -1: Block diagram of Image Enhancement using Fuzzy Logic.
3.Proposed Work
In traditional histogram equalization method, the remapping of the histogram peaks (local maxima) takes place which leads to the generation of undesirable artifacts and huge change in mean image brightness. Hence, the proposed FHE preserves the image brightness along with improvement in local contrast of the original image. Firstly, Fuzzy histogram is derived based on fuzzy logic .Secondly ,Fuzzy histogram is decomposed into two sub histograms based on the median value or the input image. After this each histogram is equalized independently to enhance the contrast of the image. .At last equalized histograms are composed together to get the result. Fuzzy histogram equalization consists of following major steps:-
If color image convert RGB into HSV. Then apply the further steps on V component only and at last combine the three components including the enhanced one to produce the enhanced resultant image.
[image:3.595.330.568.80.303.2]© 2016, IRJET | Impact Factor value: 4.45 | ISO 9001:2008 Certified Journal
| Page 3092
(3). Computation of fuzzy histogram(4). Decomposition of fuzzy histogram and Equalization
(5). Image defuzzification
3.1 Image Fuzzification and Intensification
Image fuzzification process converts gray level intensities into fuzzy plan using an appropriate membership function .Fuzzy plane values ranges from 0 to 1 while actual gray level intensities ranges from 0 to 255 . Here 0 indicates the darkest pixel and 1 indicates the brightest.
𝜇𝑖𝑗 =
0 𝑓 𝑖, 𝑗 ≤ 𝑚𝑛 (𝑓 𝑖, 𝑗 − mn)/(𝑚𝑥 − mn) mn < 𝑓 i, j < 𝑚𝑥
1 𝑓 𝑖, 𝑗 ≥ 𝑚𝑥
(2) Here mn and mx denotes the minimum and maximum pixel values of the original image. Contrast intensification is applied to the fuzzy set to reduce the amount of image fuzziness, and the membership function of which is expressed as
𝝁𝑭(𝒊,𝒋)=
2 ∗ (µ𝑖𝑗)2, 0 ≤µ 𝑖𝑗 ≤ 0.5 1 − 2 ∗ (1 −µ𝑖𝑗)2, 0.5 <µ
𝑖𝑗 ≤ 1
(3)
3.2 Computation of Fuzzy Histogram
To enhance the image, focus is given on contrast enhancement which is achieved by making dark pixels more dark and bright pixels brighter. Fuzzy histogram computation is done using (3).
Fuzzy histogram is a sequence of real numbers h(𝑖) where i belongs to (0, 1 . . . , 𝐿−1), here h(𝑖) is the frequency of occurrence of gray levels that are around 𝑖. By considering the gray value f(𝑖, 𝑗) as a fuzzy number µF(i,j)’ the fuzzy histogram is computed
as
𝐹 ← 𝑖 + 𝜇𝑖 𝑗 𝐹(𝑖,𝑗 )′ (4)
where 𝜇F(𝑖,𝑗) is the fuzzy membership function.
Fuzzy logic can handle the inexactness of value in much better way as compared to classical crisp values. So it results into a smooth histogram.
3.3 Histogram Partition and Equalization
After computing Fuzzy histogram, decomposition of histogram is performed based on the median value of the input image. After this step histogram is divided into two sub histograms.
F = FL ∪ FU ‘ (5)
Where FL = {F(i, j) | F(i,j)<=M , ∀F(i,j) ∈F} (6)
FU = {F(i, j) | F(i,j)>M , ∀F(i,j) ∈F} (7)
Next step is to define the respective probability density functions of the sub histograms FL and FU as
PL(Fk) = 𝑛𝐿
𝑘
𝑛𝐿 (8)
PU(FK) = 𝑛𝑈
𝑘
𝑛𝑈 (9)
where 𝑘 = 𝑚 + 1,𝑚 + 2, . . . , 𝐿 − 1, in which nkU and nkL
represent the respective numbers of Fk in FL and FU
and nL and nU are the total number of samples in FL
and FU’ respectively.The cumulative density functions
for sub histograms FL and FU are defined as
CL(Fk) = 𝑚𝑗 =0𝑃𝐿(𝐹
𝐽) (10)
CU(Fk) = 𝐿−1𝑗 =𝑚 +1𝑃𝑈(𝐹𝐽) (11)
Then following transformation functions are defined based on the cumulative density functions as
TL(Fk) = F0 + (M-F0) CL(Fk), (12)
© 2016, IRJET | Impact Factor value: 4.45 | ISO 9001:2008 Certified Journal
| Page 3093
Here M is the median of the fuzzy image. Thendecomposed sub images are equalized separately based on these transformation functions and composition of resulting sub images becomes the output image. The resulting image g = g(i,j) is expressed as
g( i ,j ) = TL(FL)∪ TU(FU) (14)
where
TL(FL) = { TL(F(i,j)) | ∀ F(i,j)∈FL}, (15)
TU(FU) = { TU(F(i,j)) | ∀ F(i,j)∈FU}. (16)
TL(FL) equalizes the sub image FL in the range (F0
,M) , and TU(FU) equalizes the image in the range
(M+1 ,FL-1). So the input image F is equalized in
the entire range from F0 to FL-1 with the constraint
that values less than or equal to M are mapped to
(F0 ,M) and greater than M are mapped to (M+1 , F
L-1).
3.4 Image Defuzzification
Image Defuzzification is the inverse of fuzzification. Defuzzification process maps the intensity values again from fuzzy plan to normal gray intensities. The enhanced image G(i,j) can be obtained using the following inverse function
𝐺 𝑖, 𝑗 = T − 1 𝑔 𝑖, 𝑗
=
0 𝑔 𝑖, 𝑗 ≤ 𝑚𝑛 𝑚𝑥 − mn ∗ (𝑔 𝑖, 𝑗 + mn mn < 𝑔 i, j < 𝑚𝑥
255 𝑔 𝑖, 𝑗 ≥ 𝑚𝑥
(17) Where G(i,j) denotes the gray level of (i,j)th plan pixel in the enhanced image where T-1 denotes the
inverse transformation of T. Here mx and mn are the
maximum and minimum values of the fuzzy image respectively.
4. Image quality measures
4.1 Absolute Mean Brightness Error
Absolute mean brightness error (AMBE) is the absolute difference between mean intensity of input image I and output image O i.e.
AMBE(I, O) =|m[I] − m[O]| (18) where m(I) and m(O) are the mean intensity of input image and output image . Lower value of AMBE shows better brightness preservation.
5. Results
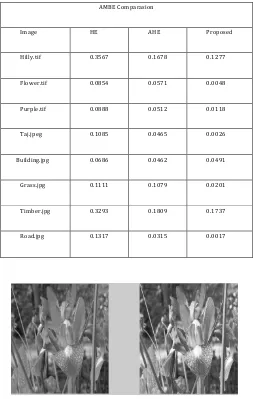
Here we are comparing the proposed method with the existing methods that are Histogram Equalization and Adaptive Histogram Equalization based on AMBE( Absolute Mean Brightness error). We applied
this method both on the gray scale and color images.. Results show that the proposed method preserves brightness better than the histogram equalization and adaptive histogram equalization methods.
© 2016, IRJET | Impact Factor value: 4.45 | ISO 9001:2008 Certified Journal
| Page 3094
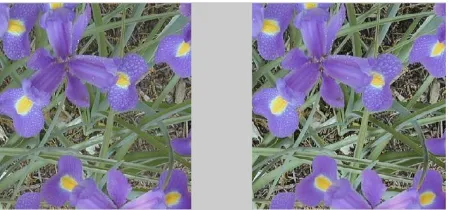
Fig -2: Contrast enhancement results on grayscale image a)Original Image b)Proposed method Image
Fig -3: Contrast enhancement results on gray scale images a)Original Image b)Proposed Method Image
Fig -4: Contrast enhancement results on gray scale images a)Original Image b)Proposed Method Image
Fig -5: Contrast enhancement results on color images a)Original Image b)Proposed Method Image
AMBE Comparasion
Image HE AHE Proposed
Hilly.tif 0.3567 0.1678 0.1277
Flower.tif 0.0854 0.0571 0.0048
Purple.tif 0.0888 0.0512 0.0118
Taj.jpeg 0.1085 0.0465 0.0026
Building.jpg 0.0686 0.0462 0.0491
Grass.jpg 0.1111 0.1079 0.0201
Timber.jpg 0.3293 0.1809 0.1737
[image:6.595.41.294.103.502.2] [image:6.595.329.558.174.279.2] [image:6.595.333.557.345.474.2] [image:6.595.51.280.609.719.2]© 2016, IRJET | Impact Factor value: 4.45 | ISO 9001:2008 Certified Journal
| Page 3095
Fig -6: Contrast enhancement results on colorimages a) Original Image b) Proposed Method Image
Fig -7: Contrast enhancement results on color images a)Original Image b)Proposed Method Image
Fig -8: Contrast enhancement results on color images a) Original Image b) Proposed Method Image
6. Conclusion
Fuzzy logic based histogram equalization method is proposed in this paper. Proposed method uses fuzzy statistics to handle the inexactness of gray level values in a better way as compared to traditional crisp histogram based methods. This
preserves the brightness, improves color content and contrast of input images automatically. Proposed algorithm was tested on different gray scale and color images. Comparison is done between existing methods ie. Histogram Equalization and Adaptive Histogram Equalization. Thus results show that proposed fuzzy based histogram equalization gives better results as compared to the Histogram Equalization and adaptive Histogram Equalization. This method effectively removes the washed out appearance of images. This is most suitable for hilly area images that suffers from low contrast and having washed out appearance.
References
[1] C. G. Ravichandran and V. Magudeeswaran, “An efficient method for contrast enhancement in still images using histogram modification framework,” Journal of Computer Science,vol. 8, no. 5, pp. 775– 779, 2012.
[2] Y. Kim, “Contrast enhancement using brightness preserving bi-histogram equalization,”
IEEE Transactions on Consumer Electronics, vol. 43, no. 1, pp. 1–8, 1997.
[3] Y. Wan, Q. Chen, and B.-M. Zhang, “Image enhancement based on equal area dualistic sub-image histogram equalization method,” IEEE Transactions on Consumer Electronics, vol. 45, no. 1, pp. 68–75, 1999.
[4]S. D. Chen and A. R. Ramli, “Minimum mean brightness error bi-histogram equalization in contrast enhancement,” IEEE Transactions on Consumer Electronics, vol. 49, no. 4, pp. 1310– 1319, 2003.
[image:7.595.53.278.200.305.2]© 2016, IRJET | Impact Factor value: 4.45 | ISO 9001:2008 Certified Journal
| Page 3096
preservation,” IEEE Transactions on ConsumerElectronics, vol. 49, no. 4, pp. 1301–1309, 2003. [6] M. Abdullah-Al-Wadud, M. H. Kabir, M. A. A. Dewan, and O. Chae, “A dynamic histogram equalization for image contrast enhancement,”
IEEE Transactions on Consumer Electronics, vol. 53, no. 2, pp. 593–600, 2007.
[7] N. S. P. Kong and H. Ibrahim, “Color image enhancement using brightness preserving dynamic histogram equalization,” IEEE Transactions on Consumer Electronics, vol. 54, no. 4, 2008.
[8] D. Sheet, H. Garud, A. Suveer, M. Mahadevappa, and J. Chatterjee, “Brightness preserving dynamic fuzzy histogram equalization,” IEEE Transactions on Consumer Electronics, vol. 56, no. 4, pp. 2475– 2480, 2010.
[9] K. Hasikin and N. A. M. Isa, “Adaptive fuzzy contrast factor enhancement technique for low contrast and non-uniform illumination images,”
Signal, Image and Video Processing, 2012.
[10] Springer-Introduction to Fuzzy Logic using MATLAB