Volume 52– No.20, August 2012
A Comparative Study of Digital Watermarking
Techniques in Frequency Domain
Ensaf Hussein
Computer Science Department, Faculty of Computers & Information,
Helwan University, Cairo, Egypt.
Mohamed A. Belal
Computer Science Department, Faculty of Computers & Information,Helwan University, Cairo, Egypt.
ABSTRACT
Digital watermarking is hiding the information inside a digital media. Its widely used in copyright protection of digital images .This paper presents a comparative study of digital watermarking techniques in frequency domain and explores the role of Discrete cosine transform DCT, Discrete wavelet transform DWT and Contourlet transform CT in generating robust embedding technique that resist various attacks. The experimental results show the superiority of CT-based watermarking over DWT and DCT watermarking techniques, the quality of the watermarked image is excellent, it can include huge amount of hidden data, but it's not much better than other techniques in resisting attacks.
General Terms
Digital watermarking, Steganography, Information hiding.
Keywords
Digital watermarking, Discrete Cosine Transform, Discrete Wavelet Transform, Contourlet Transform.
1.
INTRODUCTION
Digital watermark is a signal which is embedded into digital data (text, image, audio and video) that could be detected or extracted later. It is mostly used to insert copyright information of the data. This is done by inserting a pattern containing author's data into the digital data; it should be invisible and robust enough to resist any attack by intruders [1]-[3]. The basic schemes for the watermarking of digital images can be divided into two classes. One uses processing of the sampled values of the images, spatial-domain, for embedding the information. The other transforms the image into frequency components, and then the watermark is embedded into specific frequency components [3]-[5]. An advantage of the spatial domain techniques that they can easily applied to any imageregardless of subsequent processing, also it can include large quantity of embedded information, and in other hand it's not robust to resist attacks [4].
Our main concern is generating a robust invisible watermark, so this paper presents a comparativestudy between watermarking techniques in frequency domainDCT, DWT and the most recent and effective transform CT.
This paper is organized as follows: Section 2 introduces a
watermarking algorithms embedding and recovery, Section 5 presents the performance evaluation criteria, Section 6introduces the experimental results and section 7 gives the concluding remarks.
2.
A GENERAL FRAMEWORK
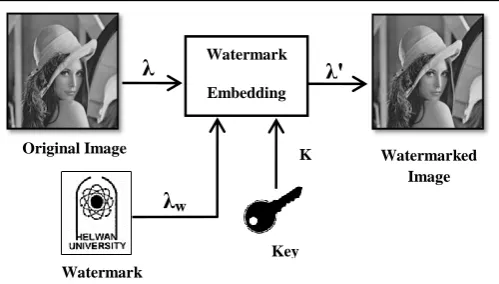
Mathematically [6], watermark embedding can be expressed like Eq.( 1). If an original image λ and a watermark are given, the watermarked image λ' is represented as the following Eq(1).
( )
Figure 1 shows watermark embedding process. An original image λ, a watermark enter to the system,α is a scaling factor and an optional public or secret key K may be used to guide the process. The output of the watermarking scheme is the watermarked image λ' [5].
Figure1: Watermark embedding
The embedded watermark can be extracted later by two ways or more, either the original image is used to compare and find out the watermark (non-blind watermark) or a correlation measure is used to detect the watermark (blind watermarking).
In non-blind watermarking, the extraction of the embedded watermark can simply achieved by applying Eq. 2 , in which simply subtract the original signal from the watermarked one then divide it by the gain factor.
( ) ( )
Original Image Watermarked
Image
Key
λ
λ'
K
λw
Watermark
Embedding
1.1.1
[image:1.595.316.566.427.569.2]Figure2: Watermark extraction and detection. There are some ways which can evaluate the similarity
between the original and extracted watermarks. However, mostly used similarity measures are the correlation-based method. The following Eq.(3) is widely used as a watermark similarity measure. Generally, the extracted watermark will not be identical to the original watermark λw. Eq. (3)
computes the similarity between w and as the follows;
( )
√
( )
To decide whether and match, one may determine, sim( , )>T, where T is some threshold [5]-[6].
3.
WATERMARKING DOMAINS
Watermarks can be embedded in spatial domain or in frequency domain.
In spatial domain the modification would be on the pixels values directly specifically the least significant bit LSB, because it hasn't great effect on the overall pixel value but this technique although it's simple and has less complexity time but it's not robust enough to resist attacks and watermark can easily be detected by intruders [3].
In frequency domain many reversible transformations are available to convert image into its frequency representation such as Discrete Cosine Transform DCT, Discrete Wavelet Transform DWT, and Countourlet Transform CT, watermark can be embedded in frequency domain coefficients. Previous researches [4]-[6] conclude that embedding in frequency domain is a robust watermarking but it has more complexity time.
In this paper we will discuss watermarking in frequency domain such as DCT, DWT, and CT.
3.1 Discrete Cosine Transform DCT
The transform domain watermarking techniques use a DCT to transform successive 8 X 8 pixel blocks of the image into 64
DCT coefficients each [6]. The DCT coefficients F(u, v) of an 8 X 8 block of image pixels f(x, y) are given by
( )
( ) ( ) [∑ ∑ ( ) ( )
( )
] ( )
Where C(x) = 1/√2 where x equals to zero and C(x) is 1 otherwise. The corresponding inverse DCT transformation is given by
( )
( ) ( ) [∑ ∑ ( ) ( ) ( ) ( ) ] ( )
The DCT allows an image to be broken up into different frequency bands, low frequency band FL, middle frequency
band FM, and high frequency band FH. The most appropriate
band for altering the watermark is the FM band, because
embedding in FL will modify the most important parts of the
image and that will degrade image quality and distort it on the other hand modifications in FH is exposing the modified pixels
to removal through compression and noise attacks.
FM is chosen as the embedding region as to provide additional
resistance to lossy compression techniques, while avoiding significant modification of the cover image [7],
Similarity Measure Watermark Extraction
Watermark Or Confidence measure
λ'
λ
Embedded Watermark Key
Watermarked Image
Original Image
Volume 52– No.20, August 2012
Figure 3: Definition of DCT regions
3.2 Discrete Wavelet Transform DWT
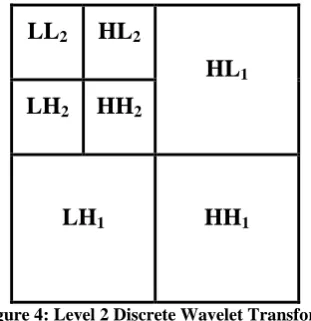
The DWT separates an image into a lower resolution approximation image (LL) as well horizontal (HL), vertical (LH) and diagonal (HH). The LL band stands for the coarse onewhich represents the low frequency part where most energy focuses. The sub-bands labeled HL, LH, and HH represent the details of waveletcoefficients. To obtain the next coarser wavelet coefficients, the sub-band LL is further decomposed as shown in Figure 4. This process can be repeated several times, which is determined by the requirement of user [8 ].LL
2HL
2HL1
LH2
HH2
LH
1HH
1Figure 4: Level 2 Discrete Wavelet Transform One of the many advantages over the wavelet transform is that that it is believed to more accurately model aspects of the HVS as compared to DCT. This allows us to use higher energy watermarks in regions that the HVS is known to be less sensitive to, such as the high resolution detail bands {LH,HL,HH). Embedding watermarks in these regions allow us to increase the robustness of our watermark, at little to no additional impact on image quality [1].
3.3 Contourlet Transform CT
The Discrete Contourlet Transform is a relatively new transform which was proposed by Do et al., [9]. The main feature of this transform is the potential to efficiently handle 2-D singularities, i.e. edges, unlike wavelets which can deal with point singularities exclusively. This difference is caused by two main properties that the CT possess: 1) the directionality property, i.e. having basis functions at many
[image:3.595.306.560.182.287.2]at various aspect ratios (depending on the scale), whereas wavelets are separable functions and thus their aspect ratio equals to 1. The main advantage of the CT over other geometrically-driven representations, e.g. curveletsand bandelets [11][13], is its relatively simple and efficient wavelet-like implementation using iterative filter banks. Due to its structural resemblance with the wavelet transform, many image processing tasks applied on wavelets can be seamlessly adapted to contourlets.
Figure.5Contourlet Filter Bank
The CT is constructed by two filter-bank stages, a Laplacian Pyramid (LP) [10] followed by a Directional Filter Bank (DFB) [9] as shown in Figure5. The LP decomposes the image into octave radial-like frequency bands to capture the point discontinuities, while the DFB decomposes each LP detail band into many directions (a power of 2) to link these point discontinuities into linear structures.
LP has the distinguishing feature that each pyramid level generates only one bandpass image (even for multidimensional cases) which does not have “scrambled” frequencies. This frequency scrambling happens in the wavelet filter bank when a highpass channel, after downsampling, is folded back into the low frequency, and thus its spectrum is reflected. In the LP, this effect is avoided by only down sampling the lowpass channel. Figure 6 shows one level LP decomposition. It generates a down sampled low pass version of the original and the difference between the original and the prediction, resulting in a bandpass image (prediction error)[10].
Figure 6: One level LP Decomposition
H
( ) Low pass Image
Band pass image
M
G
( ) Original Image
M
ImageBandpass Directional subbands
(2, 2)
Bandpass Directional subbands
[image:3.595.89.245.373.534.2] [image:3.595.322.547.571.701.2]Figure 7: DFB Frequency Partitioning (l=3) The directional filter bank is a critically sampled filter bank that can decompose images into any power of two’s number of directions. The DFB is efficiently implemented via a l-level tree structured decomposition that leads to ‘2l’ sub-bands withwedge-shaped frequency partition as shown in Figure 7.
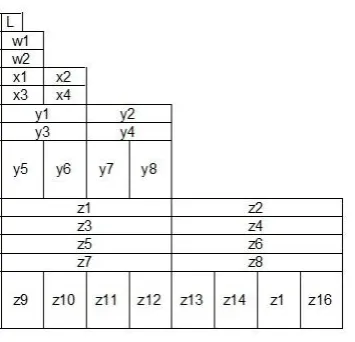
Figure 8: Contourlet transform decomposition Figure 8 shows the directional decomposition at every level obtained using contourlet transform. The no. of directional decompositions can be chosen different and it makes this transform unique. From fig. 2, it is apparent that L is the low pass version of the image and W, X, Y and Z are the directional detail bands at different levels.
Directional bands in four levels of multi resolutions are divided into 2, 4, 8 and 16 directional sub bands from coarse to fine scales respectively[13][15].
4.
WATERMARKING ALGORITHMS
Embedding and Extraction
Watermarking algorithms rely on two main procedures, embedding and extraction. This paper study and analyze 3 different watermarking algorithms in transform domain which are:
4.1. DCT based watermarking
4.1.1. Embedding Process
1. Read the cover image and watermark. 2. Define block size = 8 and mid band for DCT.
3. Generate PN sequence for Zero of length equal to number of mid band coefficients.
4. Divide the cover image into blocks of 8 X 8. 5. For each block,
a. Find DCT.
b. If (watermark bit = 0)
Add one bit of the PN sequence for Zero to each mid band coefficient.
c. Convert the block back to spatial domain.
4
.1.2. Extraction Process
1. Read the cover image watermark.
2. Define block size = 8 and mid band for DCT.
3. Generate PN sequence for zero of length equal to number of mid band coefficients.
4. Divide the cover image into blocks of 8 X 8. 5. For each block,
a. Find DCT.
b. Extract the middle band coefficients.
c. Find correlation between middle band coefficients and the PN sequence for zero. d. If correlation > threshold
Set recovered watermark bit = 0. Else
Set recovered watermark bit = 1.
6. Reshape the recovered watermark according to the size of original watermark.
4.2. DWT based watermarking
4.2.1. Embedding Process
1. Read the cover image and watermark.
2. Find the first level DWT of the cover image using haar wavelet.
3. For each bit of watermark vector,
a. Generate two PN sequences for horizontal and vertical components.
b. If watermark bit = 0
Add the PN sequences to the respective components.
4. Take the inverse DWT
4
.2.2. Extraction Process
1. Read the watermarked image and watermark. 2. For each bit
a. Generate two PN sequences for horizontal and vertical component each.
b. Find the correlation using,
correlation_h=corr2 (cH1,pn_sequence_h). correlation_v=corr2 (cV1,pn_sequence_v). correlation=(correlation_h+correlation_v)/2.
0 1 2 3 4
5 6
7 7
6 5 4
3 2 1 0
ω1
ω2
(π,π)
Volume 52– No.20, August 2012 c. If correlation > threshold
Set retrieved watermark bit = 0.
3. Reshape the retrieved watermark according to the size of the watermark.
4.1. CT based watermarking
4.3.1. Embedding Process
1. Read the cover image and watermark. 2. Apply CT on cover image
a. Decompose image using Laplacian Pyramid LP into low pass image(L) and bandpass image (w,x,y,z)
b. Decompose each bandpass image using Directional Filter Bank DFB , we get 2,4,8,16 subbands as in figure 8.
3. For each bit of watermark vector,
a. Generate PN sequence equal to watermark size m*n
b. If watermark bit = 0
Add the PN sequences to coarsest directional band pass w.
4. Take the inverse CT
4
.3.2. Extraction Process
1. Read the watermarked image and watermark. 2. Apply CT on cover image
a. Decompose image using Laplacian Pyramid LP into low pass image(L) and bandpass image (w,x,y,z)
b. Decompose each bandpass image using Directional Filter Bank DFB , we get 2,4,8,16 subbands as in figure
3. For each bit
a. Generate two PN sequences for w bandpasscomponent .
b. Find the correlation using,
correlation =corr2 (wbp,pn_sequence). c. If correlation > threshold
Set retrieved watermark bit = 0.
4. Reshape the retrieved watermark according to the size of the watermark.
5.
PERFORMANCE ANALYSIS OF
WATERMARKING TECHNIQUES
Each of the watermarking technique discussed so far has its own pros and cons. However to judge the performance of these, they should be analyzed on the same benchmark. The performance evaluation is based on various performance metrics.5.1
Measuring Imperceptibility
Imperceptibility of an embedded watermark can be expressed either as fidelity or quality measure. Fidelity represents a measure of similarity between the original and watermarked cover.
The widely used peak signal-to-noise ratio (PSNR) measurement [16] which measures the maximum signal to noise ratio found on an image is used as an objective measure for the distortions introduced by the watermarking system. The PSNR is given by [16,17]:
2 255
( , )
( , )
PSNR Iorg Iw
MSE Iorg Iw
(4)where MSE is mean square error between the original image Iorg and the watermarked one Iw. The MSE is defined as [16]:
1 1
0 0
1 2
( , ) ( ( , ) ( , ))
M N
i j
MSE Iorg Iw Iorg i j Iw i j
M N
(5)Where, M and N are the image dimensions. When SNR approaches infinity, the original image and output image are totally the same. SNR provides only a rough approximation of the quality of the watermark as it does not take into account, the Human Visual System (HVS). The evaluation relies strictly on the observations under varied conditions.
5.2
Measuring Robustness
Common signal processing attacks are applied to the watermarked images to measure and compare the robustness of the three techniques. The Bit-correct ratio (BCR) for the extracted logo after every attack is measure. The use of the bit-correct ratio (BCR) has become common recently, as it allows for a more detailed scale of values. The bit correct ratio (BCR) is defined as the ratio of correct extracted bits to the total number of embedded bits and can be expresses using the formula:
' 1
' 0
100
1,
0,
l
n n n n n
BCR l
W
W
W
W
(6)Where, l is the watermark length, Wn corresponds to the nth bit
5.3
Measuring Execution Time
Another important tool for evaluating algorithms is measure the amount of time required to embed a watermark into a host image, and then extract it afterwards. The actual time in CPU cycles will be used as a measure of execution time.
5.4
Measuring Payload
Payload or capacity simply refers to the size of watermark that can be embedded in the host image. The size is in terms of bits. Payload or capacity is another important characteristic because it has a direct negative impact on the robustness.
6.
EXPERIMENTAL RESULTS
A set of four 8-bit grayscale digital images, shown in figure 9, were selected. The embedded watermark is shown in figure 10, is a binary logo of size 32× 32 pixels.
Figure 9: Image database (size of 512×512 pixels)
[image:6.595.332.525.89.331.2]Figure 10: Embedded Watermark(size of 32×32 pixels) Results show that there are no visual degradation on images that watermarked by DCT or CT based techniques as their PSNR for 'Lena' is 66.13db and 66.10db respectively, while 32.3db for DWT based technique.
Table 1: Watermarked and Extracted 'Lena'
Watermarked Image Extracted Watermark
DCT-based
PSNR 66.1336db Bcr61.0352
DWT-based
PSNR 32.1905db Bcr 99.8047 CT-based
PSNR 66.1053db Bcr 72.2422
[image:6.595.91.243.304.472.2]Matlab 7.13 version is used to test the robustness of the 3 techniques. Various attacks geometrical and non-geometrical are used to test robustness such as histogram equalization, median filtering,Gaussian noise, JPEG compression, cropping, scaling, and rotation.In Table 7, a 32×32 watermark is embedded in 'Lena' using 3 different techniques, the watermarked image is exposed to the previous attacks, then the watermark is extracted and quality measures such as PSNR, MSE, ad BCR take place . In the 3 mentioned techniques, the watermark image could survive to non-geometrical attacks but destroyed with hard non-geometrical ones.
Table 2: PSNR of Watermarked Images
Lena Baboon Peppers Barbara
DCT-based 66.1336 66.1336 66.1336 66.1336
DWT-based 32.1905 32.1905 32.1905 32.595
CT-based 66.1053 66.1053 66.1053 66.1053
Table 4: MSE of Watermarked Images Lena Baboon Peppers Barbara
DCT-based 0.0158386 0.0158386 0.0158386 0.0158386
DWT-based 39.2674 39.2676 39.2676 39.2676
Volume 52– No.20, August 2012 Table 5: BCR% of Watermarked Images
Lena Baboon Peppers Barbara
DCT-based 100 100 99.9996 100
DWT-based 99.9992 99.942 97.9561 99.9977
[image:7.595.54.280.89.198.2]CT-based 100 99.9851 99.9908 100
Table 6: Execution time of Embedding and Extraction
Lena Baboon Peppers Barbara
Emb
ed
Ex
tr
ac
t
Emb
ed
Ex
tr
ac
t
Emb
ed
Ex
tr
ac
t
Emb
ed
Ex
tr
ac
t
D
C
T 1.4352 1.1544 1.3728 1.0920 1.3884 1.0920 1.3728 1.1076
D
W
T 5.8188 13.603 5.5692 13.775 5.7720 13.416 5.9280 13.197
CT 0.8580 0.8736 0.7956 0.8580 0.7956 0.8580 0.7956 0.8736
According to execution time , we noticed that CT-based technique is faster that both DCT and DWT, and DWT is the slowest one as it show in Table 6.
Table 7: Extracted Watermarks after Attacks.
Type of attack After Attack Watermark (BCR)% (PSNR)db
1- Histogram equal. 37.10937 2.014141
2- Median filtering 83.49609 2.041832
3- Gaussian noise 62.79296 2.035029
4- Cropping 81.34529 2.048270
5- Scaling 37.10937 2.014141
6- Rotation 37.10937 2.014141
7- JPEG
Compression 37.10937 2.014141
7.
CONCLUSION
In this paper, a comparative performance analysis has been hold between 3 watermarking transforms DCT, DWT, and CT. In DCT, the middle band was chosen to alter the watermark. It’s the most appropriate band for alteration, because it won't affect host image quality or be exposed to removal through compression or noise attacks, but experimental results show that it can't carry a lot of hidden data. In DWT,the horizontal and vertical bands were chosen for alteration, it allows us to embed large amount of hidden data without impact on image quality but in another hand it's more complex transform and takes a lot of execution time as shown in experimental results. In CT, the main feature in this transform.Itis effectively handles 2-D singularities, i.e. edges and contourlets. CT is constructed by two filter-bank stages, a Laplacian Pyramid LP and Directional Filter Bank DFB.It decomposes image into Low band pass L that contains coarse data and directional band passes that contain the details, we chose w band pass for watermark alteration, it's the coarsest band in detailed directional bands, it provides us with more space to alter large amount of hidden data without a great impact on image quality, also it is the fastest transform among the three transforms. In robustness testing watermarked images were exposed to 7 different attacks include both geometrical and non-geometrical; the three reforms survived non-geometrical attacks and destroyed in geometrical one.
From this comparative study , experimental results proves the superiority of CT , in payload , perceptibility ,and execution time , but still a weakness in robustness and surviving against geometrical attacks and it's a good point for research in the future in watermarking and information hiding fields.
8.
REFERENCES
[1] C. S. Lu, Multimedia Security: Steganography and Digital Watermarking for Protection of Intellectual Property, Idea Group Publishing, 2005.
[2] F. Hartung, and M. Kutter, “Multimedia Watermarking Techniques”, IEEE Proc. IEEE, Special Issue on Identification and Protection of Multimedia Information, vol. 87, pp. 1079–1107, July 1999.
[4] Sin-Joo Lee and Sung-Hwan Jung,"A Survey of Watermarking Techniques Applied toMultimedia",ISIE 2001.
[image:7.595.54.280.233.383.2][6] Petitcolas Fabien A., Anderson Ross J., Kuhn Markus G., "Information Hiding – A Survey", Proceedings of IEEE, Special issue on protection of multimedia content, pp 1062-1078,July 1999.
[7] Bijan Fadeena and Nasim Zarei,"Hyprid DCT-CT "Digital Image Adaptive Watermarking", 3rd International Conference on Advances in Database, Knowledge, an data Applications, IARIA 2011.
[8] Tay P., Havlicek J.P., "Image Watermarking using Wavelets". IEEE, pp 258-261, 2002.
[9] M. N. Do and M. Vetterli, “The contourlet transform:An efficient directional multiresolution image representation,” IEEE Trans. on Image Processing,vol. 14, No. 12, pp. 2091–2106, December 2005.
[10] Shereem Ghanem and Fatma A.E. Abou-Chadi, "ContourletVersus Wavelet Transform: A Performance Study for a Robust Image Watermarking", 2009. [11] Jayalakshami M., S. N. Merchant, Uday B. Desai,
"Digital Watermarking in Contourlet Domain", 18th
International Conference on Pattern Recognition, 2006. [12] Ibrahim A. El rube, Mohamed Abou El Nasr, Mostafa M.
Naim, Mahmoud Farouk, "Contourlet Versus Wavelet Transform for a Robust Digital Image Watermarking Technique", World Academy of Science, Engineering and Technology,2009.
[13] B. Chandra Mohan and S.Srinvas Kumar, "Robust Digital Watermarking Scheme using Contourlet Transform", IJCSNS International Journal of Computer Science and Network Security, vol.8, No. 2, February 2008.
[14] Malini Mohan and Anurenjan P. R, "A New Algorithm for Data Hiding in Images using Contourlet Transform", 2011.
[15] HediehSajedi and Mansour Jamzad, "A Stegaanalysis Method based on Contourlet Coefficients", International Conference on Intelligent Information Hiding and Multimedia Signal Processing, 2008.
[16] Taha El Areef, Hamdy S. Heniedy, S .Elmougy, and Osama M. Ouda, “Performance Evaluation of Image WatermarkingTechniques”, Third International Conference on Intelligent Computing andInformation Systems, Faculty of Computer& Information Sciences, ICICIS , 7002March 15-18, 2007, Cairo.