LONETSSOM Platform: Enabling Distributed
Processing, Managing and Mining of Biological
Data through Fusion of Logical Network and Web
Technologies in NETWORK Infrastructure
N. Kannaiya Raja
, AP/CSE Dept
Arulmigu Meenakshi Amman Coll of Engg.,A. Senthamaraiselvan
, AP/CSE Dept
Arulmigu Meenakshi Amman Coll of Engg.,K. Arulandam
, Prof & Head/CSE Dept,
Ganadipathy Tulasi’s Jain Coll of Engg.,K. Babu
, (M.E-P.T) Lect/CSE Dept Arulmigu Meenakshi Amman Coll of Engg.,ABSTRACT
The accurate computation of conventional methods have not relied in the revolutionary period of changes and cannot make reshaping in the biological research as the meta-mining was used for integration of data which is not compatibility for biological research. Therefore we have reshaped the conventional method using Logical Network for effective transcriptomic technology for translation. In this paper, the advanced technology of knowledge mining which have an unprecedented wealth of quantity of data have been sruitnished and we present lonet for in silico systems biology and medicine (LONETSSOM), and a web based application that exploits logical management systems and distributed data processing system are highly used for DNA microarray through a genetic consistent, computational analysis framework. The advanced framework of logical network system is LONETSSOM which perform efficient versatile annotation system and integrative analysis through multi-application programming interface delivered in the SOA. The LONETSSOM aims to setup a generic paradigm of efficient knowledge mining that promotes throughput in translation of biomedicine field through the fusion of logical network and creation of semantic web technologies.
General Terms
Biological data knowledge mining, distributed computing, network, translational biomedical research, web services.
Keywords
DNA microarray, Data set, Data Preprocessing, Statistical Analysis, Clustering, Annotation, Interpretation, WSDL, knowledge-mining.
1. INTRODUCTION
In recent years, genomic and transcriptomic
technologies have become widely used tools for biomedical research producing high unparallel form of wealth of data regarding genome- wide sruitnishing of an organism. This experiment perform global gene expression monitoring, enabling the, through questioning of the in-vivo cellular state and its regulation, in healthy and disease state for response to numerous environmental stimuli across different species etc. DNA microarray [1] is a collection of genomic applications, which is
used for identifying significant alternations in transcriptomic expression of the system, investigated and map them to specific phenotypic outcomes. By the field of molecular diagnostic we drive clinically useful, prognostic and diagnostic gene-signatures. Most probably hundreds of thousands of measurements per sample for large scale whole genome disease associated data for increasing the importance of microarrays the biological problems that can be thus addressed, introduced versatility in their design, in an effort to satisfy researches demands for increased array density sample number , content flexibility, and minimization costs. The efficient software solution obtained by the technological developments for explosion of computational complexity. The increasing number of transcriptomic studies leads to great popularity of research, based on various types of microarrays forming datasets that range from several tenths of hundreds of megabytes. Similar datasets derived from epidemiological cohorts that use higher density arrays, will a mass data of several gigabytes. This datasets are organized by SOA in data mining for unprecedented data towards research oriented data for biomedical process.
The target of gene collection analysis, variation in actual collection level of data mining can obtained from various sources which inherited in microarray technologies. We implement by using .Net behind web based interface which is using to provide web based architecture. By providing various levels functionality, regarding either the quantitative analysis or information integration and annotation based on various implementations of web based microarray analysis platforms. These can be separated in two main categories: centralized (single server) and distributed with respected to centralized solution, one of the first attempts was web accessible gene expression data analysis using SNOMAD [2].Data classification, using supervised learning methods performed by caGEDA [3]. The user friendly interface for no voice users provided by MAGMA [4]. The data management rather than analysis efficiency provided by MARS [5]. GEPAS system [6] provide successful implementation, combining extended functionalities together with neat design. It performs preprocessing statistical analysis, functional analysis and finally DEG lists [Differently expressed genes list]. In the last step clustering, classification and gene annotation are supported. This system is not parallelized but instead, they are executed as single threaded operations. The gene meta-analysis provided by Gene Mesh [7]. It performs hypothesis derived, relational analysis by matching genes with medical subject headings index, but also with other established biological vocabularies, such as KEGG, Entrez, gene ontology[GO] etc. For collection of datasets using LONETSSOM for integrated and update the data accordingly climate.
For analysis of cDNA chips, utilizing message passing interface(MPI) technology over the hellinic Lonet infrastructure
regarding distributed/parallel computing software
implementation, a seminal pilot effort was the Network platform[8].Using a ASP .Net web interface for submitting both
raw data and minimal information about a
microarrayexperiment(MIAME) information which are stored in a distributed database a significiant improvement and speed up of the data-preprocessing task was attained GEMMA[9] is another example of such a solution, deployed over the Italian EGEE infrastructure. DNA microarray analysis using BioVLAB Microarray is a cloud computing inspired solution.RNA
sequences, a cloud computing solution named
Myrna[10].Calculates differential gene expression in large RNA-seq datasets by using R/Bioconductor [11] for interval calculation, normalization and statistical testing. These latest developments emphasize in the profits of fusing bioinformatics with LONET computing technologies.
LONETSSOM [12] is a versatile web application, capable of providing experts in the fields of molecular biology and medicine with a powerful, rapid and standardized computational pipeline, able to accommodate various types of DNA microarray technologies.
LONETSSOM enables storage, processing and analysis of larger experimental datasets, overcoming inherent limitations
in memory, storage, and performance of standalone
configurations. At the same time, through the exploitation of network infrastructures and web services, it provides a unified environment for quantitative, statistical and semantic, functional analysis and makes of computational power which leads to experimental result, the rest of paper is organized as follow section II discussed related work of protein, mRNA, DNA section III.The overview of LONETSSOM and web application, and presenting tools, and designing
architecture based on the web application. Section IV shows analysis through LONETSSOM platform, finally conclusion.
2. RELATED WORK
These are various implementation of conventional based methods in a living cell which is a system were cellular components such as genome and the gene transcription and protein interaction with each other.
2.1. Genomics
Genomics provides the various important roles in modern biological research in which nucleotide sequences of all the chromosomes of an organism are embedded and mapped with location of different genes and their sequences are determined. This existing analysis of nucleic acids by using molecular biological techniques before the data’s is ready for processing in the computer. It is a technique describing a living organism is the sequence of genome which is not reliable to estimate the number of genes in an organism based on the number of nucleotide base-pair as the presence of high number of redundant copies of many genes. Genomic can help to rectify these types of problems for research work.
2.2. Transcriptomics
Transcriptomics is a study of transcriptome which is a whole set of mRNA molecules. This kind of technique has helped us to find out biologist to monitor the gene expression of cells and compare gene expression between control cells and treatment cells. Transcriptomics has some drawbacks, such as micro experiments is not always good predictor of the relative proteins. This is because of differential adaptation to the translational machinery and differential usage of amino acids of different usage of amino acids of different abundance and the lack of information on post-translational modification such as acetylation, hydroxylation, gycosylation, phosphorylation and cleavage are fundamental in understanding the interactions of
cellular components.
2.3. Proteomics
This represents the earliest attempt to identify a major sub-class of cellular components - the proteins – and their interactions. Proteomics involves the sequencing of amino acids in a protein, determining its 3D structure and relating it to the function of protein. Before computer processing comes into the picture, extensive data, particularly through crystallography and nuclear magnetic resonance (NMR), is required for this kind of study. With such data on known proteins, the structure and relationship to the function of newly discovered proteins can soon be understood.
The term proteomics was coined to make an analogy with genomics, and while it is often viewed as the next step, proteomics is much more complicated than genomics. Most importantly while the genome is rather a constant entity, the proteomic differs from cell to cell and is constantly changing through its biochemical interactions with the genome and the environment. A single organism has radically different protein expressions in different parts of its body, in different stages of life cycle or, on a smaller scale, the set of proteins found in a particular cell type under a particular type of simulation, is referred to as the proteomic of the organism or cell type, respectively.Scientists feel that the bioinformatics of proteins is crucial since characterizing thousands of proteins and their interactions is a difficult task. To understand the cellular components and their interactions completely, one needs integrated analyses of proteomic, genomic, and transcription data and a one word solution for all this bioinformatics.
3. TOOLS AND METHODS
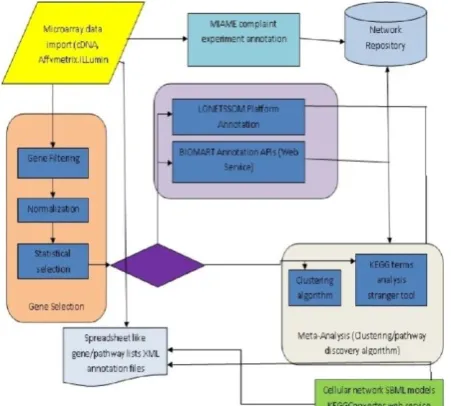
In Fig. 1, an overview of the workflow structure of LONETSSOM is illustrated. The platform has been designed in order to effectively accommodate the needs of a wide range of users with different levels of expertise, aspiring to perform versatile and varying series of operations. The core of the developed web application, namely the quantitative signal processing and statistical analysis of the microarrays, which represent the computationally expensive part of the analysis pipeline, but also the storage of the datasets as well as of the annotation files, are exploiting the Network infrastructure and create easily scrutinisible data from dataset in the network. Overall, the DNA microarray experimental data analysis tasks implemented within the platform, encompass diversified processing steps, entailing versatile, heterogeneous in nature of processing, data type and complexity tasks.
These can be basically partitioned into the categories of data import, gene selection, gene annotation tasks integrative interpretation capabilities, secure database storage and maintenance, and support of various output formats. With respect to the efficient interpretation of DNA microarray experiments, LONETSSOM supports gene classification based on clustering algorithms or cellular pathway analysis, through the integration of statistical ranking of annotated genomic experimental results (StRAnGER) [13].
In this way, statistical enrichment analysis is performed, which exploits controlled biological vocabularies like the GO [14]. Another capability of LONETSSOM is the reconstruction of cellular network super-pathway models, which are SBML-compliant [15] by exploiting the KEGG pathway IDs that are derived from the analysis performed by StRAnGER.
25 the adoption of web service technologies was another crucial
feature, in the design phase, regarding the integration of novel functionalities in the platform.
Fig. 1. Structure of the functionalities of the LONETSSOM computational environment.
That is why LONETSSOM can accommodate novel processing needs, emerging possibly from innovations in the field of biological instrumentation, by exploiting application programming interfaces (APIs), which will be programmed to support the data exchange with these applications. As the DNA microarray processing scenarios, can be particularly variable, even for the first part of the quantitative analysis, which concerns the signal processing phase and the derivation of significant gene lists, the whole procedure is divided into several processing steps, encompassing data importing, filtering, normalization, and statistical selection. The design of the screens is friendly, in order to facilitate the selections of the user, in order to assemble the analytical pipeline, according to which the dataset will be processed. Default values are provided to aid the computational analysis of microarrays even for non experts and enable a first, crude evaluation of the microarray experiments. The a priori definition of the steps that comprise the analysis pipeline is a necessary compromise for the execution of the workflows on the Network, as well as the usage of its shared resources. This certainly poses limitations to the extent of interaction of the user with the data,during their processing. Due to the queuing and security policies adopted by Network administrators for the scope of the most effective and rapid, public use of the Network resources, end users are not granted power user rights that would otherwise empower them to have full control of their data. The reason is that this would pose serious performance and security threats. Upon completion of the analysis, the results are stored in the Network, but can be downloaded at any time. These gene lists can be subjected to further processing, such as k-means clustering or even Pathway Analysis, exploiting GOand KEGG Terms.
Fully complying with its open standards support policy, LONETSSOM provides MIAME-compliant [16] annotation capabilities, regarding the description of the experimental protocol that was followed in the given microarray experiment. In this way, this valuable information is integrated upon request to the LONETSSOM repository and can be exported either in MIAME or miniML[17] compatible format. Bedrock for the analysis pipelines of LONETSSOM was Gene ARMADA [18], a DNA microarray analysis application, which has been extensively tested and used in several studies [19], [20]. LONETSSOM radically evolves its routines through extensive reprogramming, to develop new versions that enable parallel implementations of the assigned computational jobs, in distributed computing environments.
3.1. Data set
LONETSSOM currently offers a versatile data import wizard, suitable for cDNA and oligonoucleotide arrays. Regarding cDNA microarrays, LONETSSOM fully supports a variety of widely used formats for raw image data files (GenePix, ImaGene, QuantArray). Alternatively, other less popular microarray formats, or in general, microarray experiment signal files provided in tab-delimited text format,
can be accommodated through a customizable data import wizard, which ensures that the minimal necessary information required for the subsequent analysis, is provided. Regarding oligonoucleotide platforms, LONETSSOM supports the analysis of Affymetrix DNA chips and Illumina BeadArrays. In order to parse and import Affymetrix.CEL files and their corresponding array libraries, proper Bioconductor [11] packages are wrapped within LONETSSOM code for primary parsing. This element enables easy data input and interfacing with the LONETSSOM internal data structures and ensures error-free subsequent analysis. A similar strategy is adopted for Illumina BeadArrays, where the user has to upload the primary gene or probe profile output from the BeadStudio suite,accompanied by a simple file describing the experimental structure.
3.2. Data Preprocessing
1)BackgroundCorrection/Adjustment: LONETSSOM provides various data preprocessing methods both for two-color and oligonoucleotide arrays. Three options are available for spot background correction in two-color microarrays: 1) Background subtraction, 2) Calculation of the SNR: the net signal for each channel is estimated as the ratio between the signal and its background, and 3) No background correction. In the second case, the background correction is performed by calculating the SNR of a spot. This background correction method is based in the established, SNR of a signal notion, in systems theory and image processing. It is also in line with the perception of the experimentalist about signal quality, in a given experiment. As a noise filtering standard is missing regarding two-dye cDNA microarrays [21], this approach is vital, especially in the case where the tested datasets present low SNR for the majority of their signals. Concerning Affymetrix arrays, RMA and GCRMA [22] algorithms can be utilized for background adjustment, whereas for Illumina BeadArrays, the users should perform the background correction step on Illumina BeadStudio.
2. Quality Control: In the case of two-color cDNA microarrays, poor-quality spots are filtered out either manually, or by excluding spots marked as poor, by other image analysis software. Noise filtering is further performed through three filtering options applied to both channels: 1) a signal-to-noise threshold filter, 2) a filter, based in the signal and background distributions distance, and 3) a custom filter, based in several probe data. For Affymetrix arrays, poor-quality probe sets are detected using the MAS5 algorithm (present/absent call) as well as through the use of empirical filters, utilizing probeset expression and its variation among different experimental conditions. For Illumina BeadArrays, the detection score is used to filter out problematic bead sets just as similar empirical filters to those applied in the analysis of Affymetrix arrays. A second proactive mechanism for outlier detection across replicates within the same experimental condition is the application of parametric or nonparametric tests, across replicate probe expressions, referring to the specific experimental condition.
2) Normalization: Regarding two-color CDNA
[image:3.595.44.270.107.310.2]Affymetrix arrays.
3.3. Statistical Analysis:
The investigation method for better interpret relevance of the biological annotations of a group of genes, statistical descriptions and analyses of the annotations can be used. When the considered genes are selected from a predefined set or subdivided in classes, to evaluate the statistical significance of specific annotation categories provided through controlled vocabularies in each considered group of genes, their quantities, frequencies, distributions, and probabilities of occurrence can be considered. Several different statistical approaches can be used to calculate a probability value for each considered annotation category. We used the hypergeometric distribution and binomial distribution tests, and the Fishers exact test [27].The hypergeometric and binomial distribution equations include the binomial coefficient:
If calculated as a factorial ratio, on common computer platforms, this coefficient rapidly reaches the maximum overflow limit for a variable when the value of n is greater than 170. In our application n represents the number of considered genes, which can be several tens of thousands in a high-density microarray. Therefore, to calculate the hypergeometric and binomial distribution p-values, we used specific algorithms that calculate the binomial coefficient according to the Pascal’s triangle, as in:
C (n, k) =C (n.1, k.1) +C (n.1, k), for 0< k< n
When implemented iteratively, this equation provides greater efficiency and computation precision than those given by the factorial ratio.
3.4. Clustering:
Clustering algorithms have proved useful to help group together genes with similar functions based on gene expression patterns under various conditions or across different tissue samples [27], [28]. Co-expressed genes found in the same cluster demonstrate significant enrichment for function. Co expressed genes in the same cluster are probably involved in the same cellular process and strong expression pattern correlation between those genes indicates co-regulation. Inference of regulation through
clustering of gene expression data also warrants the further hypothesis of the mechanism of transcriptional regulatory network.
We have explored various clustering algorithms including the hierarchical clustering. In contrast to partitioning-based clustering, which attempts to directly decompose the data set into a set of disjoint clusters, hierarchical clustering generates a hierarchical series of nested clusters which can be graphically represented by a tree, namely, dendrogram. The branches of a dendrogram not only record the formation of the clusters but also indicate the similarity between the clusters.
In our case the proximity measure for the individual genes is the co-relation coefficient with respect to the independent components generated by the ICA algorithm a, which partitions optimally.
3.5. Annotation Retrieval and Updating
According to the above-described methodology, we implemented LONETSSOM as a system automatically retrieving gene annotations from the FTP sites of different databanks. The GO data, category definitions using controlled vocabulary terms and relationships between them, are obtained from the Gene Ontology FTP site. Several annotations and correspondences
between gene identifiers and GO categories, and other gene annotations are retrieved from the NCBI LocusLink [28], Swiss-Prot Expasy [29], KEGG [30], OMIM [31], and Affymetrix FTP sites.
Since all above cited public accessible FTP sites are regularly updated with the latest version of the data they provide, all the retrieved data need to be kept updated. Therefore, in a Active server application we implemented procedures to automatically download the data of interest from the above FTP sites at predefined intervals of time. Because the different FTP sites are updated at different time and with different frequencies, our implemented updating procedures have been synchronized to perform downloading only at the right time. Moreover,
the versions of the last downloaded data used in our application are memorized in a table of our system database and showed upon user request.
The Asp.net application not only performs automatic downloading of the latest version of gene annotations from web-accessible databanks but also imports these data in the LONETSSOM database tables. Each databank provides data in a specific format, e.g. CSV text files in a tabular format or flat text files where data are identified by keywords. Therefore, in the latter case these files need to be parsed with specific algorithms to extract only the information useful for our system goal. Some other information is inferred from the downloaded data, it is organized and structured, and then it is stored in the
LONETSSOM databases. For example, GO path codes are
generated starting from the information on category-to-category relationships in the GO database. GO path codes simplify the understanding of where a GO category is located in the Gene Ontology structure, and represent the top-down paths in the ontology from the GO root to specific GO categories. Due to the GO Direct Acyclic Graph (DAG) structure, multiple paths exist for certain categories. To generate them, we created a specific recursive scanning algorithm for tree-like structures, since from a top-down view GO DAGs are tree-like structures.
Because the LONETSSOM generates many temporary database tables to speed up system response time, the developed .Net server application also performs system maintenance tasks, deleting obsolete temporary tables.
3.6. Functional Analysis/Interpretation
The derivation of a statistically sound list of differentially expressed genes represents only the first step, toward a biologically consistent yet comprehensive functional interpretation of the biological problem investigated. Aim is to unravel through a systems level approach, the intricate interactions taking place among whole cellular processes and pathways, encompassing numerous genes. It also aspires to rationalize thediscovery process through which, genomic expression is linked to phenotypic manifestation. For this scope, tools that perform additional analysis, utilizing functional information captured by established biological ontologies or other controlled vocabularies, fruit of the concerted action of the wider
research communities, are indispensable. LONETSSOM
27
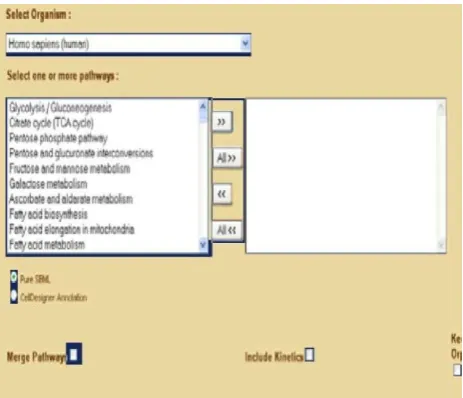
Fig. 2. KEGGConverter web application central screen
The prioritization is based both on statistical measures as well as biological content (number of genes) of each GO term. The functionality of StRAnGER is also applicable to KEGG pathways, in order to detect overrepresented KEGG pathways, based in the number of genes mapped onto them. Having thus derived a list of the significant KEGG pathways, it is possible, by importing this set of IDs into theKEGGConverter web service, to support automated reconstruction of SMBL cellular metabolic models, for in silico testing. KEGGConverter [32] is a web-based application (see Fig. 2), which uses as source KEGG markup language (KGML) files, in order to construct cellular networks, from the integration of several biochemical pathways.This web service grants the user, the ability to define the number and identity of the pathways that are incorporated, as well as the type of SBML model that the service will create.
It is thus determined whether the model will only be a pure stoichiometric one, or will integrate kinetic information about the pertaining reactions. This functionality represents a novel feature of LONETSSOM, which links different layers of biological organization, like the transcriptomic and the metabolomic.It enables a systemic perspective in the study of biological systems, transforming the platform into a versatile and powerful one, for Systems Biology research.
3.7.
Porting
LONETSSOM
to
Other
Workflows through Web Services
Web services are an emerging, promising technology to build distributed applications. It is an implementation of service oriented architecture (SOA) [33] that supports the concept of loosely coupled open-standard, language- and platform independent systems. The loosely coupled features allow service providers to modify back-end functions, while maintaining the same interface to clients. The core service functions are encapsulated and remain transparent to clients. The open-standard approach supports collaboration and integration with other services. Platform and language independence promotes service development in any language and deployment on any platform.
LONETSSOM provides web service-based access to its functionality and repository resources, facilitating its integration in other application environments, through the setup of appropriate workflows. Experiment management and retrieval tasks from the LONETSSOM repository can be remotely handled.Each task is implemented by a function that can be invoked through the developed web service and is described through the appropriate WSDL representation of the service as illustrate in Fig 3.
Fig. 3. WSDL Instance of the LONETSSOM WSDL describing basic functions for submitting and monitoring experiments to the platform.
Web services are accessed through the HTTP protocols and utilize eXtensible markup language for data exchange. This in turn implies that web services are independent of platform, programming language, tool and network infrastructure. Services can be assembled and composed in such a way to foster the reuse of existing back-end infrastructure. The basic SOA includes three service components: provider, requester and registry.WSDL is commonly defined by the service provider for invocation of the service. Simple object access protocol (SOAP) is adopted as message transfer protocol between requester and provider. The Universal Description, Discovery, and Integration are used for service registration and discovery.
The WSDL representation resides online together with LONETSSOM web repositories and can be accessed directly by workflows tools like Taverna Workbench [34]. The exposed functions and features are recognized by the workflow schedulers and become available to the user.Authentication and security is addressed through the WS Security (Rampart) kit [35]. WS-Security is a standard for adding security to SOAP Web service message exchanges. It uses a SOAP message-header element in order to attach the security information to messages, in the form of tokens conveying different types of claims along with encryption and digital-signature information. On top of the WS-Security kit, the SSL protocol [36] has been used for the proper encryption of the data during transmission between the service consumer and the web service itself. The .NET toolkit has been utilized for the development of the web services. The deployment has used the IIS application server. A single class has been created, which contains all functions that expose the functionality just described.
4. PROPOSED ARCHITECTURE
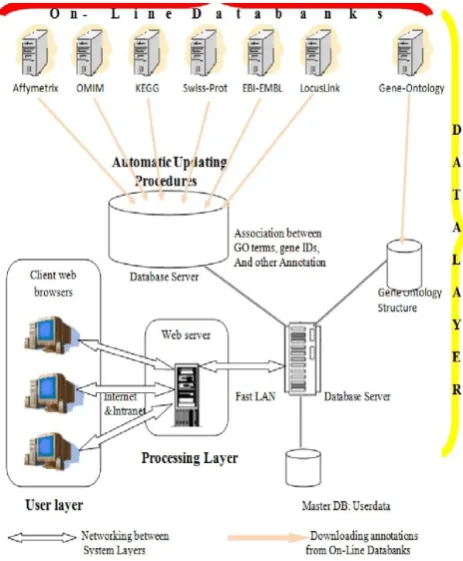
databases by automatically retrieving gene annotations and GO information from several on-line databanks, as soon as new releases become available.
In the second layer, the processing layer, a web server manages the requests coming from client computers and runs all system processing and analyses. This is the main layer of the LONETSSOM system. It is constituted of Active Server Page scripts and uses Microsoft ActiveX Data Object technology and Standard Query Language to communicate with the DBMS server on the data layer, which is connected to through a fast Local Area Network. In this layer, SQL queries are built and performed to get data from the databases in the data layer, whereas ASP scripts perform the data processing. When a user requests a LONETSSOM web page, the ASP scripts it contains execute on the web server all required system operations and statistical analyses, and results are shown within HTML pages sent to the user client computer.
The third layer, the user layer, is composed of any client computer connected to the web server on the processing layer through an Internet/intranet communication network and loading in its web browser the LONETSSOM graphic user interface implemented as HTML web pages. The LONETSSOM user interface is intended to increase at maximum system usage easiness and friendliness, leading to evaluate the functional significance of microarray experiments results through graphical views and statistical indexes in a web browser user interface usable anywhere an Internet connection is available. It is organized in modules allowing users to study the distribution of different classes of genes among GO categories, KEGG biochemical pathways, PFAM protein domains, or OMIM diseases. Each module provides a specific task.
The development of microarray technologies has generated the need for bioinformatics approaches that can help in biologically interpreting microarray experiment results. With this aim and to enrich a plain list of gene identifiers, selected through microarray experiments, with biological meaning and statistical significances, we implemented the LONETSSOM system. It includes an annotation
module as well as a number of data exploration and analysis modules that enable highlighting the most relevant functional annotations within user-defined classes of genes, independently of the methods used to define them.
LONETSSOM automatically translates lists of
[image:6.595.312.544.83.364.2]differentially expressed genes into functional profiles of several biological categories providing statistical significance
values
for each category. Among the provided categories, those defined by the GO controlled vocabulary enable functional annotations of a given gene set on a genomic scale and across different species. The LONETSSOM three-layer architecture enhances at maximum the system performances because it enables to subdivide the required computational power between the two web and DBMS servers. The implemented multidatabase structure allows enhancing system performance and maintaining separated data of different types, sources and obsolescence. For instance, data regarding Gene Ontology structure and terms are updated monthly, and their associated database can be entirely replaced each month with its new version.Fig. 4. The three-layer multi-database LONETSSOM system architecture.
Other gene annotation data in the Gene Data DB are updated with different frequencies, whereas the Master DB is continuously written with user data, according to system utilization. Because the LONETSSOM databases manage a vast quantity of increasing data, they tend to become very big, reducing the system performance. Thus, according to their updating frequencies, they are designed to enhance at best the data extraction speed from their tables and the overall system usability. During GO structure explorations and statistical analyses, some SQL queries including join operations between GO data tables and loaded user sequence IDs tables are required. Since SQL joins are CPU and disk costly and time requiring, they should be reduced at minimum through data denormalization and support tables, implementing static views on different data tables. Therefore, after downloading and importing several distinct tables with different data from public databanks, the implemented updating procedures create few big tables representing views of those tables and containing all required data joined together. This operation is very time-consuming and very costly for the DBMS server CPU but it is performed only once after each system update. Subsequently, the system uses the data in the created big tables instead of performing SQL joins between several little tables, and results are obtained more quickly.
The developed friendly web interface enables any user to easily utilize the LONETSSOM from everywhere an Internet connection is available. Besides allowing the user to upload also sequence ID lists with predefined classifications, LONETSSOM allows creating gene classifications based on the membership of each gene to specific functional categories and performing statistical analyses of these classifications. To our knowledge, this important feature is not available in other similar tools.
5. LONETSSOM PLATFORM: USE CASES
29 performance of LONETSSOM, to a single-server configuration
that is performing the same analysis tasks, through a batch script, that utilizes MATLAB R2008b scripts from its Bioinformatics toolbox. The dataset used in this case is the GEO GSE6820 dataset that comprises 18 different experimental conditions with two replicates in each condition, where a custom, noncommercial array configuration has been used. Due to this reason, the annotation of this array set could not be fully retrieved automatically from the databases; therefore, this dataset was used only for the computational evaluation of the platform and another dataset was used to highlight the descriptive strengths of LONETSSOM.
Analyzing the dataset, up to the point of the derivation of a significant gene list through utilization of the most computationally intensive normalization method (robust quadratic loess) and using the default selections suggested by the platform, the whole analysis in LONETSSOM was completed in 55.59 min (3335.59s) for the DAG configuration, and in 33.16 min (1989.78 s) for the MPI configuration. The respective performances for the single-server configuration were 143.37 min (8624.1 s), thus the speedup attained by LONETSSOM is 259% and 433% for the DAG and the MPI solutions respectively. However, as the MPI solution was related to a much large number of failures in job dispatching and executions in the Network, in certain periods, the DAG management was adopted to render the operation of the whole application more resilient, against a wide range of underperforming factors. LONETSSOM compresses the data stored, thus managing a more efficient use of the storage resources. In our case, the total size of our dataset was 266 MB, whereas compressed is downsized to 96MB, that is a profit of 277%.
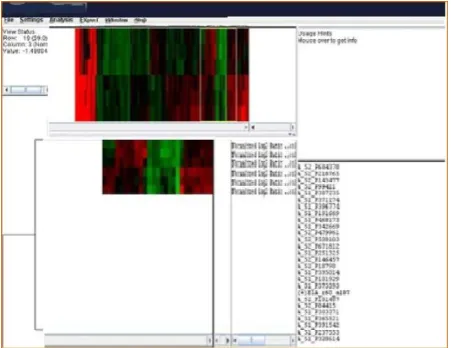
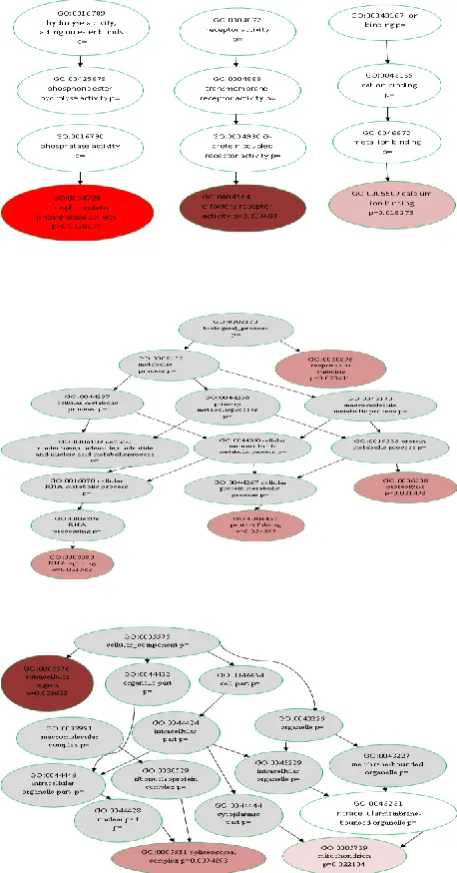
The second use case demonstrates the tangible strengths of LONETSSOM regarding the meaningful and versatile functional interpretation of transcriptomic data. The publically available GEO GSE10010 dataset is utilized for this purpose, and makes use of the Agilent-012694 Whole Mouse Genome G4122A cDNA microarrays. Its experimental design encompasses two conditions each one enumerating three replicates. The image analysis software used was Agilent Feature Extraction Software, and data were imported in LONETSSOM, through its customizable data import wizard. The dataset was fully annotated, with the help of the LONETSSOM annotation module. All details of the experiment (annotated gene lists, visualizations, clustering and pathway analysis results) are publicly available in the LONETSSOM repository and can be explored through use of the visualization shell which supports various options (see Fig. 5). Data analysis was performed using the following parameters: signal-to-noise background correction was applied to mean signal spot intensities of each replicate, followed by gene filtering requiring the foreground signal to be > = 2 times above the background signal, whereas robust linear LOWESS, with a span window of 20% of the signal distribution in each array, was applied for intrachip normalization. Genes with 2 out of three values missing in any condition were filtered out and finally 1-way ANOVA with a 0.05 p-value threshold was applied. A list of 130 differentially expressed genes was obtained which was subjected to cluster analysis (hierarchical, Pearson correlation distance measure, and average linkage; see Fig. 7) and to functional analysis exploiting the GO and KEGG controlled vocabularies, through the use of the StRAnGER web service. Regarding the GO-based analysis the service provides systems level visualization of the significant GO terms, by mapping them into illustrations of the relevant parts of the three GO trees that correspond to the categorization molecular function, cellular component, and biological process. The intensity of the colorization determines the importance of the GO term, according to StRAnGER.
Fig. 5 Overview of the LONETSSOM gene analysis results screen.
[image:7.595.303.538.76.254.2]Among the deregulated cellular processes, functions related to phosphoprotein phosphatase activity (GO: 0004721; p-value = 0.002867598), calcium ion binding (GO: 0005509; p-value = 0.01827472), proteolysis (GO: 0006508, p-value = 0.03149798) or purine metabolism (KEGG_id:230), and Jak-STAT signaling pathway (KEGG_id:4630) were identified.
Fig. 6 Tree-view tool for hierarchical clustering visualization. In the left window, the overall clustering tree is given in detail, in the central one the profiles of the genes comprising the selected genes of the tree are given in detail, while in the right their gene IDs are given.
6. DISCUSSION AND CONCLUSION
The computational complexity of the analysis
workflows, of the modern high-throughput biological
[image:7.595.302.528.370.544.2]statistical processing of very big datasets, like those that can be derived from large longitudinal, prospective or retrospective epidemiological studies. Real-life experience from the pilot period of operation of LONETSSOM, emphatically stresses the fact that porting an e-Science application in a functional Logical network environment entails great technical challenges, lots of nontrivial, yet tedious code reprogramming and lots of debugging. This is a prerequisite regarding the successful operational interfacing with the middleware.
Fig. 7. Visualization of the results of the GO terms analysis performed by StRAnGER for the GEO GSE10010 dataset. The three trees correspond to the basic categories molecular function, cellular component, biological process, from top to bottom, in which all GO terms are discerned. The more intense the color the more significant the respective GO term.
This aspect, usually overlooked in software engineering projects represents the biggest practical limitation for rapid exploitation of the fruits of interesting software implementations, which unfortunately, due to versioning problems cannot attract widespread use. LONETSSOM represents a much more flexible, and resilient, regarding its sustainable operation, web application, which manages to exploit the logical network infrastructure even for conditions of intense computing. Thus, sustainable job management is attained with minimization of queuing times, even for limited or small processor availability, an omnipresent reality regarding Logical network utilization, due to its internal
prioritization policy scheme.
In this way, the reconstruction of whole cellular networks from the experimental data is facilitated, through extensive in silico testing. Through the functional annotation and statistical evaluation of sequence ID lists, the LONETSSOM can stand out the most relevant biological information of a given gene set. Consequently, as the performed validation demonstrated, it enables enriching a plain list of gene identifiers with biological meaning and statistical significances. Based on some of the available and constantly updated genomic sources, we think LONETSSOM can represent an important aid in biologically interpreting microarray experiment results and in discovering biological knowledge from gene expression data. Other future work will introduce a grid and cloud based application for knowledge-mining from protein DNA and protein–protein interaction databases, as well as biological text mining functionalities.
7. ACKNOWLEDGMENTS
We wish to express my profound thanks to all those who helped in making this Journal a reality. Much needed moral support and encouragement is provided on numerous occasions by our whole family. We wish to thank the ICJA Publisher and the entire team of ICJA Publication for their suggestion and support.
8. REFERENCES
[1] D. Janssen. (2006).Managing the microarray data mountain, Bio-IT World. [Online]. Available at: http://www.bio-itworld.com/ BioIT_Article.aspx?id = 41292].
[2] C.Colantuoni, G.Henry, S.Zeger, and J.
Pevsner,SNOMAD(standardization and normalization of microarraydata):Web-accessible gene expression data analysis,”Bioinformatics, vol. 18, no. 11, pp. 1540–1541, Nov. 2002.
[3] S. Patel and J. Lyons-Weiler, caGEDA: A web application for the integrated analysis of global gene expression patterns in cancer,” Appl. Bioinfo., vol. 3, no. 1, pp. 49–62, 2004.
[4] H. Rehrauer, S. Zoller, and R. Schlapbach, MAGMA: Analysis of twochannel microarrays made easy,” Nucl. Acid Res., vol. 35, no.Web Server issue, pp. W86–W90, Jul. 2007.
[5] M. Maurer, R. Molidor, A. Sturn, J. Hartler, H. Hackl, G.Stocker, A.Prokesch,M. Scheideler, and Z.Trajanoski, MARS:Microarray analysis, retrieval, and storage system,” BMC Bioinfo vol. 6, art. 101 2005.
[6] J. Tarraga, I.Medina, J.Carbonell,
J.Huerta-Cepas,P.Minguez,E.Alloza,F.Al-Shahrour,S.
Vegas-Azcarate,S.Goetz,P.Escobar,F.Garcia, A.Conesa,
D.Montaner, and J.Dopazo, GEPAS, a web-based tool for
microarray data analysis
andinterpretation,”Nucl.AcidRes.,vol.36,No.Web Server issue, pp.W308–W314,Jul. 1, 2008.
[7] S. D.Jani, G.L. Argraves, J. L. Barth, and W. S. Argraves,GeneMesh:A web-based microarray analysis tool for relating differentially expressed genes to MeSH terms,”BMC Bioinfo., vol. 11, no. 1, art. 166, Apr. 1, 2010.
[8] I. Kanaris, V. Mylonakis, A. Chatziioannou, I. Maglogiannis, and J. Soldatos, NETWORK: Enabling Microarray
Experiments over the
HellenicNetworkInfrastructure,”J.Logic network Comput., vol. 7, no. 3, pp. 1–22, Aug. 2009.
[image:8.595.45.274.183.620.2]31 microarrays in distributed experiments,” BMC Bioinfo., vol.
8, Suppl. 1, art. S7, 2007.
[10] B. Langmead, K. D. Hansen, and J. T. Leek, Cloud-scale RNAsequencing differential expression analysis with Myrna,”Geno. Bio., vol. 11, art. R83, 2010.
[11] R. C. Gentleman, V. J. Carey, D. M. Bates, B. Bolstad, M. Dettling, S. Dudoit, B. Ellis, L. Gautier, Y.Ge,J. Gentry, K. Hornik, T. Hothorn, W. Huber, S. Iacus, R. Irizarry, F. Leisch, C. Li, M. Maechler, A. J. Rossini, G. Sawitzki, C. Smith, G. Smyth, L. Tierney, J. Y. Yang, and J.
Zhang,Bioconductor:Opensoftware Development for
computational biology and bioinformatics,” Geno. Bio., vol. 5, no. 10, 2004.
[12]A.Chatziioannou,I.Kanaris, I. Maglogiannis, C.Doukas, P.Moulos,E.Pilalis, and F.N. Kolisis,LONETSSOM web based Network portal: Exploiting the power of Network infrastructure for the interpretation and storage of DNA microarray experiment,” in Proc. IEEE 9th Int. Conf. Inf.Technol. Appl. Biomed. (ITAB),Carnaca,Cyprus, Nov.5– 7, 2009, pp. 15.
[13] A. Chatziioannou and P. Moulos, Exploiting statistical methodologies and controlled vocabularies for prioritized functional analysis of genomic experiments: The StRAnGER web application,” Front. Syst. Biol., to be published.
[14] M. Ashburner, C. A. Ball, J. A. Blake, D. Botstein, H. Butler, J.M. Cherry, A. P. Davis, K. Dolinski, S. S. Dwight, J. T. Eppig, M. A. Harris, D. P. Hill, L. Issel-Tarver, A. Kasarskis, S. Lewis, J. C. Matese, J. E. Richardson, M. Ringwald, G. M. Rubin, and G. Sherlock,Gene ontology: Tool for the unification of biology. The Gene Ontology Consortium,” Nat. Gen., vol. 25, no. 1, pp. 25–29, May 2000.
[15] Y. H. Yang, J. Youl Choi, K. Choi, M. Pierce,D.Gannon, and S.Kim,BioVLAB-microarray: Microarray data analysis in virtual environment,” in Proc. IEEE Int. Conf. eSci., 2008, pp. 159–165.
[16] A. Brazma, P. Hingamp, J. Quackenbush, G. Sherlock, P. Spellman, C. Stoeckert, J. Aach,W. Ansorge, C. A. Ball, H. C. Causton, T. Gaasterland, P. Glenisson, F. C. Holstege, I. F. Kim, V. Markowitz, J. C. Matese, H. Parkinson, A. Robinson, U. Sarkans, S. Schulze-Kremer, J. Stewart, R. Taylor, J. Vilo, and M. Vingron, Minimum information
about a microarray experiment (MIAME)—Toward
standards for microarray data,” Nat. Gen., vol. 29, no. 4, pp. 365–371, Dec. 2001.
[17]R.Edgar and T.Barrett, NCBIGEOstandards and services formicroarray data,” Nat. Biotechnol., vol. 24, no. 12, pp. 1471–1472, Dec. 2006.
[18] A. Chatziioannou, P. Moulos, and F. N. Kolisis, ―Gene ARMADA: An integrated multi-analysis platform for microarray data implemented in MATLAB,” BMC Bioinfo., vol. 10, p. 354, 2009.
[19]A.Tzouvelekis,V.Harokopos,T. aparountas, N. Oikonomou, A. Chatziioannou, G.Vilaras, E. Tsiambas, A. Karameris, D. Bouros, andV. Aidinis, Comparative expression profiling in pulmonary fibrosis suggests a role of hypoxia-inducible factor-1alpha in disease pathogenesis,” Amer. J. Resp. Cri. Car. Med., vol. 176, no. 11, pp. 1108–1119, Dec. 1, 2007.
[20] W. J.Welboren,M. A. Van Driel, E. M. Janssen-Megens, S. J. Van Heeringen, F. C. Sweep, P. N. Span, and H. G. Stunnenberg, ChIP-Seq of ER and RNA polymerase II defines genes differentially responding to ligands,” EMBO J., vol. 28, no. 10, pp. 14181428, 2009.
[21] R. B. Scharpf, C. A. Iacobuzio-Donahue, J. B. Sneddon, and G. Parmigiani, When should one subtract background fluorescence in 2-color microarrays?,” Biostatistics, vol. 8, no. 4, pp. 695–707, Oct. 2007.
[22] R. A. Irizarry, B. Hobbs, F. Collin, Y. D. Beazer-Barclay, K. J. Antonellis, U. Scherf, and T. P. Speed, Exploration,
normalization, and summaries of high density
oligonucleotide array probe level data,” Biostatistics, vol. 4,no. 2, pp. 249–264, Apr. 2003.
[23] G. C. Tseng, M. K. Oh, L. Rohlin, J. C. Liao, and W. H. Wong, Issues in cDNA microarray analysis: Quality filtering, channel normalization, models of variations and assessment of gene effects,” Nucl. Acid Res., vol. 29, no. 12, pp. 2549–2557, Jun. 15, 2001.
[24] B. M.Bolstad, R.A.Irizarry,M. Astrand, and T. P. Speed, A comparison of normalization methods for high density oligonucleotide array data based on variance and bias,” Bioinformatics, vol. 19, no. 2, pp. 185–193, Jan. 22, 2003.
[25] J.W.Tukey, Exploratory Data Analysis. Reading MA: Addison-Wesley, 1977.
[26] C.R.Pelz, M.Kulesz-Martin, G. Bagby, and R.C.Sears,Global rankinvariant set normalization (GRSN) to reduce systematic distortions in microarray data,” BMC Bioinfo., vol. 9, art. 520, 2008.
[27] G. Casella, and R. L.Berger. Statistical inference. 2nd edition. Belmont, CA: Duxbury Press, 2002.
[28] K. Pruitt, T. Tatusov, and D. Maglott. .RefSeq and LocusLink: NCBI gene-cantered resources. Nucleic Acids Res., vol. 29, pp. 137-140, 2001.
[29] B. Boeckmann, A. Bairoch, R. Apweiler, M. C. Blatter, A. Estreicher, and E. Gasteiger. .The SWISS-PROT protein knowledgebase and its supplement TrEMBL in 2003. Nucleic Acids Res., vol. 31, pp. 365-370, 2003.
[30] M. Kanehisa, and S. Goto. .KEGG: Kyoto Encyclopedia of Genes and Genomes. Nucleic Acid Res., vol. 28, no. 1, pp. 27-30, 2000.
[31] V. A. McKusick. Mendelian Inheritance in Man. A catalog of human genes and genetic disorders. 12th edition. Baltimore, MD: Johns Hopkins University Press, Johns Hopkins University Press, 1998.
[32] K. Moutselos, I.Kanaris, A. Chatziioannou, and F. N. Kolisis, KEGGconverter:BMC Bioinfo., vol. 10, art. 324, 2009.
[33]E.Newcomer and G.Lomow, Understanding SOA with Web Services.Reading, MA: Addison-Wesley, 2004.
[34] T. Oinn, M. Addis, J. Ferris, D. Marvin, M. Senger, M. Greenwood, T. Carver, K. Glover, M. R. Pocock, A. Wipat, and P. Li, Taverna: A tool for the composition and enactment of bioinformatics workflows,” Bioinformatics, vol. 20, no. 17, pp. 3045–3054, Nov. 22, 2004.
[35] K. Gabhart. (2007). Secure, Reliable Web Services with IIS Web Server.