Evolution and Optimization of Active Queue
Management Algorithms over High Bandwidth
Aggregates
Saurabh Sarkar
Department of CSE Dr. B.R.Ambedkar, NIT
Jalandhar, India
Geeta Sikka
Department of CSE Dr. B.R.Ambedkar, NIT
Jalandhar, India
Ashish Kumar
Department of CSE Dr. B.R.Ambedkar, NIT
Jalandhar, India
ABSTRACT
Due to enormous growth of the Internet, demands for access from multiple users and request for new services for its applications have also increased significantly. In a result there is a rise in packet loss rates and drop in network efficiency. In addition, the inability to support new services has severely hindered the widespread deployment of bandwidth-sensitive applications. So the success of TCP / IP depends on its ability to deliver services in time of extremely high demand and hence various congestion control mechanisms ensure this ability to prosper. The idea behind TCP congestion control is to control network load by having sources adjust their rates according to the level of congestion in the network. This paper focuses on how congestion control and queue management techniques have evolved in due course of time and being modified to minimize the rate of packet loss. Considering RED being most important of all we have optimized the algorithm by challenging the linearity of marking/dropping probability. We conduct a survey by applying different possible functions in contrary to the linear behavior of dropping probability for evaluating their performance in comparison to RED. We implement the optimized RED by simulating a multicast network for TCP flows.
General Terms
Active Queue Management Algorithms, RED, Non-linear model of RED.
Keywords
AQM, RED, drop probability, simulations, NS2.
1.
INTRODUCTION
Various connections in a network compete for resources like link bandwidth and buffer space in the router during network congestion. One of the conventional solutions to congestion is using the window-based TCP congestion control at the end-hosts. The Internet Engineering Task Force (IETF) considered the deployment of Explicit Congestion Notification (ECN) [1] and later on advances in active queue management [2] as a means to reduce packet loss. Initially ECN was a success in effectively reducing the transmission rates of individual connection during congestion; but it does not provide a complete solution to the congestion problem of the network as a whole. This is because TCP sources reduce their transmission rates only after detecting packet loss caused by queue overflow at the router. It takes some time between packet being dropped at the router and its detection at the source during which a large number of packets may have been
continuously being dropped while the sources continue to transmit at a rate that the network cannot support.
On the other hand AQM schemes have been proposed to complement the TCP network congestion control which helps in detecting congestion early dropping packets randomly before the buffer becomes completely full. The ability of AQM to detect incipient congestion and convey congestion notification to the end-hosts enables the sources to reduce their sending rates prior to buffer overflow. ECN is used in conjunction with AQM for signaling congestion to sources using packet marking instead of dropping packets.
2.
QUEUING ALGORITHMS
Various queuing algorithms are implemented in a network router to obtain desired bandwidth. The simplest type of queue transmits packets in the same order that it receives them. This is called a First in First out (FIFO) queue. Generally it may seem that it treats all the traffic streams equally, but it actually tends to favor resource-hungry, ill-behaved applications. The problem is that if a single application sends a burst that fills a FIFO queue, the router will wind up transmitting most of the queued packets, but will have to drop incoming packets from other applications. If these other applications adapt to the decrease in available bandwidth by sending at a slower rate, then the ill-behaved application will greedily take up the slack and could gradually choke of all the other applications.
Because FIFO queuing allows some data flows to take more than their share of the available bandwidth, it is called unfair. Fair Queuing (FQ) and Weighted Fair Queuing (WFQ) are two of the simpler algorithms that have been developed to deal with this problem. Both of these algorithms sort incoming packets into a series of flows.
Following are the few existing queuing algorithms available for our network routers [3]:
Drop Tail is a queuing algorithm based on a first-come-first-serve discipline.
Fair Queuing is an algorithm that attempts to allocate bandwidth fairly among all input flows.
Stochastic Fair Queuing involves a hash function used to map flows to a queue.
Deficit Round Robin scheduling is an algorithm that services each flow in a predefined sequence.
specified threshold is reached, it randomly discards or marks the packets. This is the most widely accepted algorithm till date.
Class Based Queuing (Packet by Packet Round Robin and Weighted Round Robin) queues packets according to criteria defined by an administrator. It provides differential forwarding service for each class. Packets are divided into a hierarchy of classes defined by input flows.
3.
DIFFERENT CLASSES OF ACTIVE
QUEUE MANAGEMENT ALGORITHMS
In this section we will discuss few important AQM algorithms that are being proposed over the last decade. The performance of the TCP congestion control mechanism in networks that implement drop-tail [3] packet discard has some drawbacks, such as synchronization of flows, inequitable distribution of packet loss among flows, and low utilization of network resources. Therefore, even with end systems equipped with important algorithms such as the TCP congestion avoidance, slow start, fast retransmit, and fast recovery mechanisms [1], the performance of the TCP congestion control algorithm over current drop-tail networks can still be unsatisfactory. Active queue management has been recommended by the Internet Engineering Task Force (IETF) as a way of mitigating the above stated performance limitations of TCP over drop-tail networks. Random Early Detection (RED) [4] is the first active queue management algorithm proposed for deployment in TCP/IP networks. The basic idea behind an active queue management algorithm is to convey congestion notification early to the TCP end-points so that they can reduce their transmission rates before queue overflow and sustained packet loss occur. It is now widely accepted that a RED controlled queue performs better than a drop-tail queue. However, RED has some parameter tuning issues that need to be carefully addressed for it to give good performance under different network scenarios. As a result several algorithms, like BLUE [5] and Stabilized RED (SRED) [5], have been developed as alternatives to RED. Although these algorithms also control congestion by discarding packets with a load-dependent probability whenever a queue in the network appears to be congested, they are designed with the objective of maintaining stabilized network queues, thereby minimizing occurrences of queue overflows and underflows, and providing high system utilization. The Dynamic RED (DRED) active queue management algorithm [5] also has similar objectives. However, unlike SRED and BLUE, this new active queue management algorithm uses a simple feedback control approach to compute the drop probabilities used to discard packets during times of queue congestion.
Although these AQM algorithms are highly robust to diverse network conditions, most of them were designed without considering their robustness against network attacks, such as the Denial-of-Service (DoS) [6,7] attacks that have been identified as a major threat to today’s Internet services. Example DoS attacks include TCP SYN attacks, ICMP directed broadcasts and DNS flood attacks. These attacks normally generate high rate transmission of packets toward the victim node. They can be detected and alleviated [3,6,7]. Recently a new kind of DoS attack, low-rate DoS attack, has been proposed in that exploits TCP’s retransmission timeout mechanism to reduce TCP throughput without being detected. Compared to traditional flooding based DoS attacks, the low-rate DoS attack does not employ a “sledge-hammer” approach of high-rate transmission of packets, and consequently eludes
detection. RED-like algorithms have already been found to be notably vulnerable to LDoS attacks.
For this a novel Robust RED (RRED) algorithm [8] is proposed to thwart the LDoS attacks. The RRED algorithm consists of a new detection algorithm and a traditional RED algorithm. The basic idea behind the RRED is to detect and filter out LDoS attack packets from incoming flows before they feed to the RED algorithm. Bloom filter techniques have been used in the implementation of the RRED algorithm to manage potentially numerous incoming flows and increase the detection accuracy. Experiment results show that the RRED algorithm is highly robust when the router is under an LDoS attack. The TCP traffic remains its ideal rate and TCP throughput is nearly fully preserved.
4.
OPTIMIZATION OF RANDOM
EARLY DETECTION USING A
NON-LINEAR MODEL FOR DROPPING
PACKETS
Understanding AQM congestion control requires knowledge on the response characteristics of the traffic to control. Internet traffic has been dominated by TCP that responds to network congestion in an Additive Increase Multiplicative Decrease (AIMD) manner [9]. We have used a non- linear model for dropping packet rather than linear model which is used in the conventional RED scheme. The non linear model explained later in this section is particularly useful for configuring the Random Early Detect ion (RED) family router queue management mechanisms that use the average queue length to compute drop probability.
We choose to study and evaluate RED-family AQM for the several reasons: First, while recently proposed AQM mechanisms such as RRED [8], DRED [5], and BLUE [5] do not strictly use the average queue to compute congestion, they have performance goals similar to that of RED- family AQMs. Second, since RED congestion control mechanisms are relatively well-understood and are commonly used as a benchmark for evaluation of other AQM mechanisms, further extending an understanding of RED-family mechanisms and illustrating possible outcomes of RED will help researchers to design experiments that fairly compare RED with other AQM mechanisms. Third, with the help of a general modification, it is easy to configure RED- family AQMs to create various test scenarios that reveal interesting AQM congestion control issues. In turn, a general non- linear model proposed can be revalidated through evaluation with different configurations presented in RED family. Lastly, since RED is already implemented in some commercial routers, our optimized RED can be used to tune these routers, thus realizing some of the potential benefits of ECN with few network infrastructure changes.
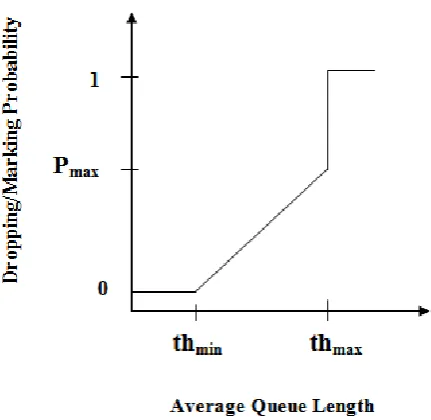
RED maintains an exponentially weighted moving average (EWMA) of the queue length which it uses to detect congestion. RED detects increases in the average queue length and uses it to determine whether or not to drop or ECN -mark a packet. More specifically, Fig 1 plots the marking/dropping probability of RED as a function of the average queue length. As the figure shows, when the average queue length exceeds a minimum threshold (thmin), packets are randomly dropped or
things, the average queue length and an initial probability parameter (Pmax). As Fig 1 shows, the calculated
marking/dropping probability is a linear function of the average queue length. The probability is 0 when the average queue length is less than or equal to thmin and linearly
increases Pmax when the average queue length approaches a
maximum threshold (thmax). If average queue length exceeds
thmax, all packets are dropped or marked.
Fig 1:The marking/dropping behavior of RED.
The general RED algorithm [4] is given below (calculate the average queue size avg):-.
If avg < thmin
Queue packet else if thmin ≤ avg < thmax
Calculate probability Pa
With probability Pa
Discard packet Else with probability 1- Pa
Queue packet else if avg ≥ thmax
Discard packet
4.1
Average Queue Size
The average queue size is calculated using an exponentially weighted average (EWA) of previous queue lengths.
If q > 0
avg = (1– wq) avg + wqq
else
t = f (time – q_time) avg = (1 – wq)t avg
The weight wq determines how rapidly avg changes in
response to changes in actual queue size. The number t is estimated by the router’s idle time; in this period m packets could have been transmitted. With wq the algorithm can avoid
reacting to short bursts of congestion.
4.2
Probability of Discard
Let c be the number of how many consecutive packets have not been discarded since the last packet was dropped. It is obvious that the higher the value of c, the higher the
probability of discard. Let Pb represent a temporary
probability varies from 0 at avg = thmin to Pmax at avg =thmin.
)
)(
(
min max minmax
avg
th
th
th
P
P
b
(1))
1
(
bb
a
P
c
P
P
(2)When c = 1 / Pb – 1, Pa = 1. But Pa increases very slowly when
c is not very big. Only when c is close to 1 / Pb – 1, Pa begins
to rise dramatically.
5.
SIMULATION SCENARIOS AND
EVALUATION
In this part, we modified the equation in step (1) by applying two different functions (viz. V1 and V2) to calculate drop probability (Pb ) and compare the results. The curves for the
two functions V1 & V2 can be assumed roughly by Fig 2:-
Fig 2:Assumed behavior of RED
In NS2 RED queue implementation doesn’t use the formula (1) above directly, instead it uses the formula below,
)
_
_
_
(
max
v
a
v
ave
v
b
P
P
b
(3)where v_a = 1.0 / (thmax – thmin), v_ave is the average queue
size, and v_b = - thmin / (thmax – thmin). This forumla is
equivalent to formula (1).
Now considering equation (3) we can see that drop probability (Pb) linearly depend upon the average queue size i.e. v_ave. In
order to increase or decrease the drop probability as shown in
Fig 2 we need a non-linear dependency of Pb upon v_ave.
For increasing the drop probability than usual we need a concave function (V1) instead of a linear function as in (3). In our simulation we have considered log as the concave function (V1) applied to transform the formula (3) in following form:-
)
)
_
log(
(
max
m
v
ave
n
P
P
b
(4)Hence m and n are constants to be derived with respect to v_a and v_ b.
As described in Fig 2 the curve intersects with original linear function at thmin and thmax, so we can say that the curve V1
[image:3.595.59.275.178.388.2] [image:3.595.319.537.261.467.2]Hence by satisfying these points in equation (4) we have the following,
n
th
m
P
(
log(
)
0
max min (5)n
th
m
P
P
max
max
(
log(
max)
(6)Also the original linear function gives us the function,
)
_
_
(
0
P
max
v
a
th
min
v
b
(7)with (5) (6) and (7), we can get values for m and n in formula (4),
))
_
/
_
log(
)
(log(
1
max
v
b
v
a
th
m
(8))
_
/
_
log(
v
b
v
a
m
n
(9)Similarly, we can assume a decrease in drop probability as shown in Fig 2 (V2) using a convex function. In our simulation we have considered x2 as the convex function (V2), which is again applied to transform the formula (3) in following form :-
)
_
(
2max
m
v
ave
n
P
Pb
(10)By obtaining the value of the constants m and n in similar way, we have:-
)
)
_
/
_
(
(
1
2 2max
v
b
v
a
th
m
(11) 2)
_
/
_
(
v
b
v
a
m
n
(12)5.1
Simulation Configuration
Considering the scenario discussed in the previous section we configured and run the related NS-2 program to get simulation results. The results are analyzed by several perl and python programs and the figures are drawn by gnuplot. The configuration of this simulation is with reference to the problem defined in [10]:
5.1.1
Network Topology
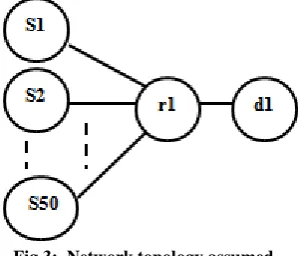
[image:4.595.99.249.593.721.2]Fig 3 shows the topology of the simulation network. There are 50 sender nodes (s1-s50), one receiver (r1) and one destination node (d1). The node d1 is investigated for its throughput and packet loss.
Fig 3: Network topology assumed.
Part of tcl main program for simulation is listed below:
set ns [new Simulator]
set NumSenders 50 set NumReceivers 1
#read scenario, seed and bottleneck bandwidth from the command line input arguments
set Scenario [lindex $argv 0] set function [lindex $argv 1] set seed [lindex $argv 2]
puts "scenario: $Scenario; function: $function; seed: $seed" ns-random $seed
set BufSize 100 set PktSize 1024 #set winSize 200 #in seconds set Duration 50
#create all nodes: note that the order of creating the nodes matter
for {set i 1} {$i <= $NumSenders} {incr i} { set s($i) [$ns node]
}
set r1 [$ns node] set d1 [$ns node] #open the nam trace file set nf [open out.nam w] $ns namtrace-all $nf
#open the traffic trace file to record all events set nd [open out5.tr w]
$ns trace-all $nd
#define a finish procedure proc finish {} {
global ns nf nd qtf $ns flush-trace close $nf close $nd close $qtf #start nam
#exec nam out.nam & exit 0
} * * *
for {set i 1} {$i <= $NumSenders} {incr i} {
$ns duplex-link $s($i) $r1 10Mb 100ms DropTail $ns queue-limit $s($i) $r1 $BufSize
}
#r1 d1 and d1 r1 are different
$ns duplex-link $r1 $d1 5Mb 100ms RED $ns queue-limit $r1 $d1 $BufSize
#trace the queue: note that link r1 d1 is different from d1 r1 set redq [[$ns link $r1 $d1] queue]
set qtf [open queue.txt w] $redq trace curq_ $redq trace ave_ $redq attach $qtf
#setting up TCP connections
$tcp($i) set fid_ $i
$tcp($i) set packetSize_ $PktSize #$tcp($i) set window_ $winSize
#set up FTP over TCP connection as traffic source set ftp($i) [new Application/FTP]
$ftp($i) attach-agent $tcp($i) $ftp($i) set type_ FTP }
#schedule events for the FTP agents
set StartTime [expr [ns-random] / 2147483647.0 / 100] puts "starttime $StartTime"
#temporarily set to 2
for {set i 1} {$i <= $NumSenders} {incr i} { $ns at $StartTime "$ftp($i) start"
$ns at $Duration+$StartTime "$ftp($i) stop" }
#ensure the ftp application have enough time to finish, so we +1
$ns at $Duration+$StartTime+1 "finish" #run the simulation
$ns run
6.
SIMULATION RESULTS
6.1
Queue Size
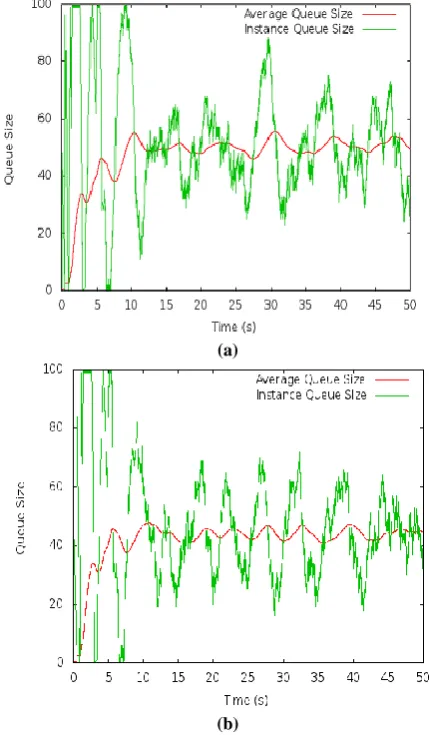
From our simulation results, we can get the curves about current queue size and average queue size as in Fig 4. The 'drop probability' is selected based on the average queue size, not the current queue size.
(a)
(b)
(c)
Fig 4:Queue size and average queue size of (a) RED (b) RED using V1 function (c) RED using V2 function.
From the plot, we can see that V1 keeps the average queue size at a lower level than regular RED, while V2 keeps the average queue size at a higher level than regular RED. This is expected as V1 is always above the original linear function given the same average queue size value in the range of [thmin,
thmax], in other words, V1 are more aggressive in terms of
dropping packets when the average queue size is between thmin and thmax. On the contrast, V2 are less aggressive than
regular RED.
6.2
Packet loss
The number of packet dropped in course of simulation period can be shown by Fig 5:
Fig 5:Pattern of packets dropped in assumed time duration
From the plot, we can see that V2 ensures less packet drop than regular RED and vice versa in case of V1 in which packet is dropped at a higher rate than V1 and regular RED algorithm.
6.3
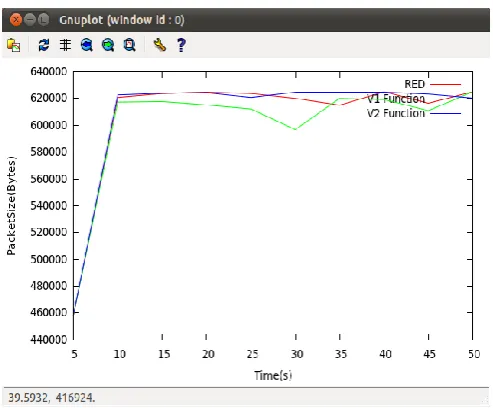
Throughput
[image:5.595.327.536.82.250.2] [image:5.595.58.273.395.763.2]Fig 6:Throughput pattern in assumed time duration
From the plot, we can see that V2 function ensures higher throughput than regular RED and V1 function.
7.
CONCLUSIONS
To avert the exploitation of bandwidth over the network various active queue management techniques have been introduced over the decade. In this paper my simulation result reflects the probable way of modifications in RED and their advantages over the regular concept of RED where packet loss can be considerably reduced. We have chosen a quadratic function (V2) showing convex pattern for drop probability and replacing v_a and v_b, used in equation (3), with their new derived values m and n respectively. Therefore various possible convex functions for drop probability can be considered and their effect on various network traffics can be evaluated for enhancing the performance of the algorithm than conventional RED algorithm.
8.
REFERENCES
[1] “Improving Internet Congestion Control and Queue Management Algorithms” by Wu-chang Feng. A dissertation submitted in partial fulfillment of the
requirements for the degree of Doctor of Philosophy (Computer Science and Engineering) in The University of Michigan, 1999.
[2] S. Dijkstra, Modeling active queue management algorithms using stochastic Petri nets, Master’s Thesis, University of Twente, 2004.
[3] Lau, F.; Rubin, S.H.; Smith, M.H.; Trajkovic, L.; , "Distributed denial of service attacks," Systems, Man, and Cybernetics, 2000 IEEE International Conference, vol.3, no., pp.2275-2280 vol.3, 2000.
[4] Shu-Gang Liu; , "Simulation and evaluation of random early detection in congestion control," Machine Learning and Cybernetics, 2008 International Conference, vol.4, no., pp.2363-2368, 12-15 July 2008.
[5] Chengyu Zhu; Yang, O.W.W.; Aweya, J.; Ouellette, M.; Montuno, D.Y.; "A comparison of active queue management algorithms using the OPNET Modeler," Communications Magazine, IEEE, vol.40, no.6, pp.158-167, June 2002.
[6] CDouligeris, C.; Mitrokotsa, A.; "DDoS attacks and defense mechanisms: a classification," Signal Processing and Information Technology, 2003. ISSPIT 2003. Proceedings of the 3rd IEEE International Symposium, vol., no., pp. 190- 193, 14-17 Dec. 2003.Brown, L. D., Hua, H., and Gao, C. 2003.
[7] Stephen Specht & Ruby Lee; “Taxonomies of Distributed Denial of Service Networks, Attacks, Tools, and Countermeasures”; May 2003.
[8] Changwang Zhang; Jianping Yin; Zhiping Cai; Weifeng Chen; , "RRED: robust RED algorithm to counter low-rate denial-of-service attacks," Communications Letters, IEEE , vol.14, no.5, pp.489-491, May 2010.
[9] Jae Chung; Claypool, M.; "Analysis of active queue management," Network Computing and Applications, 2003. NCA 2003. Second IEEE International Symposium, vol., no., pp. 359- 366, 16-18 April 2003.
[image:6.595.53.300.68.272.2]