Implementation and Comparison of Different Transform
Techniques using Kekre’s Wavelet Transform for Image
Fusion
H.B. Kekre
Tanuja Sarode Rachana Dhannawat
MPSTME, SVKM’ Computer engineering dept., Computer Sci. & Technology dept.
NMIMS university Thadomal Shahani Engineering college S.N.D.T. University, Mumbai
ABSTRACT
Image fusion combines several images of same object or scene so that the final output image contains more information. In this paper many advanced pixel level fusion techniques like Kekre’s wavelet transform, DCT Kekre’s wavelet transform, Hadamard Kekre’s wavelet transform, Walsh Kekre’s wavelet transform techniques for image fusion are proposed and compared. These methods have main advantage that they can be used for images whose sizes are not necessarily integer power of 2.
General Terms
Image Fusion, algorithm
Keywords
DCT Kekre’s wavelet, Hadamard Kekre’s wavelet, Walsh Kekre’s wavelet, image fusion.
1. INTRODUCTION
Image fusion is the technology that combines several images of the same area or the same object under different imaging conditions. In other words, it is used to generate a result which describes the scene “better” than any single image with respect to relevant properties; it means the acquisition of perceptually important information. The main requirement of the fusion process is to identify the most significant features in the input images and to transfer them without loss of detail into the fused image. The final output image can provide more information than any of the single images as well as reducing the signal-to-noise ratio.
The objective of image fusion is to obtain a better visual understanding of certain phenomena, and to enhance intelligence and system control functions. The data gathered from multiple sources of acquisition are delivered to preprocessing such as denoising and image registration. This step is used to associate the corresponding pixels to the same physical points on the object. In this method, the input images can be compared pixel by pixel. The post-processing is applied to the fused image. Post-processing includes
focus image fusion, Digital camera application, Battle field monitoring, etc [10].
2. PIXEL LEVEL FUSION TECHNIQUES:
2.1 Averaging Technique [4] [7]:
This technique is a basic and straight forward technique and fusion could be achieved by simple averaging corresponding pixels in each input image as
F(m,n) = (A(m,n) +B(m,n)) / 2 (1)
2.2 Principal Components Analysis [8] [11]:
In this method the eigenvector and eigen values of input image vector are Computed and the eigenvectors corresponding to the larger eigen value obtained, and
The fused image is:
If(x,y)=P1I1(x,y)+P2I2(x,y) (2)
where P1and P2 are the normalized components and its equal
to P1=V(1) / ∑V and P2=V(2) / ∑V where V is eigen vector
and P1+ P2=1.
2.3 Discrete Cosine Transform Technique:
In this technique images are divided into blocks then we calculate the DCT representations and take their average for corresponding blocks. Finally taken the inverse discrete cosine transform to reconstruct the fused image. Actually, this image fusion technique is called the DCT + average; modified or "improved" DCT technique [5][11].
2.4 Discrete Wavelet Transform Technique with
Haar [1] based fusion:
It uses fast Mallet’s transform [1], the algorithm first decomposes both input imagess to get an approximate image and a detail image. Images are fused using the fusion rules. The resulting fused transform is reconstructed to fused image by inverse wavelet transformation
Volume 44– No10, April 2012
H4
=
4
1
2
2
0
0
0
0
2
2
1
1
1
1
1
1
1
1
3. KEKRE’S TRANSFORM [6] [9]:
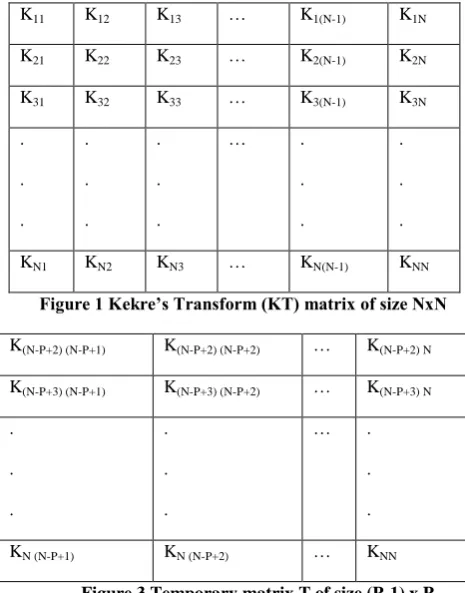
Kekre’s transform matrix can be of any size NxN, which need not to be an integer power of 2. All upper diagonal and diagonal elements of Kekre’s transform matrix are 1, while the lower diagonal part except the elements just below diagonal is zero. Generalized NxN Kekre’s transform matrix can be given as shown in (5)
) 5 ( 1 ) 1 ( ... 0 0 0 1 1 ... 0 0 0 . . ... . . . . . ... . . . . . ... . . . 1 1 ... 1 2 N -0 1 1 ... 1 1 1 1 1 ... 1 1 1 . N N N
The formula for generating the element Kxy of Kekre’s
transform matrix is,
1 : 0 1 : ) 1 ( : 1 y x y x x N y x Kxy
Kekre’s Wavelet Transform [6] [9]:
Kekre’s Wavelet transform is derived from Kekre’s transform. From NxN Kekre’s transform matrix, we can generate Kekre’s Wavelet transform matrices of size (2N)x(2N), (3N)x(3N),……, (N2)x(N2). For example, from 5x5 Kekre’s transform matrix, we can generate Kekre’s Wavelet transform matrices of size 10x10, 15x15, 20x20 and 25x25. In general MxM Kekre’s Wavelet transform matrix can be generated from NxN Kekre’s transform matrix, such that M = N * P where P is any integer between 2 and N that is, 2 ≤ P ≤ N. Consider the Kekre’s transform matrix of size NxN shown in Figure 1.
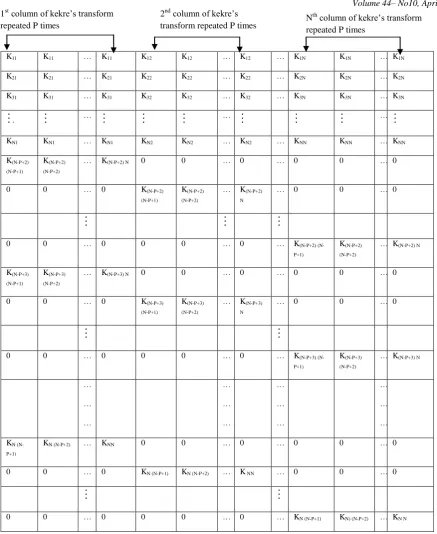
Figure 2 shows MxM Kekre’s Wavelet transform matrix generated from NxN Kekre’s transform matrix. First N numbers of rows of Kekre’s Wavelet transform matrix are generated by repeating every column of Kekre’s transform matrix P times. To generate remaining (M-N) rows, extract last (P-1) rows and last P columns from Kekre’s transform matrix and store extracted elements in to temporary matrix say T of size (P-1) x P . Figure 3 shows extracted elements of Kekre’s transform matrix stored in T.
K11 K12 K13 … K1(N-1) K1N
K21 K22 K23 … K2(N-1) K2N
K31 K32 K33 … K3(N-1) K3N
[image:2.595.54.246.73.144.2]. . . . . . . . . … . . . . . . KN1 KN2 KN3 … KN(N-1) KNN
Figure 1 Kekre’s Transform (KT) matrix of size NxN
K(N-P+2) (N-P+1) K(N-P+2) (N-P+2) … K(N-P+2) N
K(N-P+3) (N-P+1) K(N-P+3) (N-P+2) … K(N-P+3) N
. . . . . . … . . . KN (N-P+1) KN (N-P+2) … KNN
Figure 3 Temporary matrix T of size (P-1) x P
In the same way DCT kekre's wavelet Technique, Hadamard kekre's wavelet Technique and Walsh kekre's wavelet Technique are implemented. In these techniques instead of using Kekre’s transform matrix as base matrix the respective transform matrices are used as base matrices and then wavelet matrix is generated by the above illustrated technique (4)
[image:2.595.311.544.174.471.2] [image:2.595.55.283.250.436.2]Figure 2 Kekre’s Wavelet transform matrix of size MxM generated from Kekre’s transform matrix of size NxN.Where M = N
K11 K11 … K11 K12 K12 … K12 … K1N K1N … K1N
K21 K21 … K21 K22 K22 … K22 … K2N K2N … K2N
K31 K31 … K31 K32 K32 … K32 … K3N K3N … K3N
.
…
…
…
KN1 KN1 … KN1 KN2 KN2 … KN2 … KNN KNN … KNN
K(N-P+2) (N-P+1)
K(N-P+2) (N-P+2)
… K(N-P+2) N 0 0 … 0 … 0 0 … 0
0 0 … 0 K(N-P+2)
(N-P+1)
K(N-P+2) (N-P+2)
… K(N-P+2) N
… 0 0 … 0
0 0 … 0 0 0 … 0 … KP+2)
(N-P+1)
K(N-P+2) (N-P+2)
… K(N-P+2) N
K(N-P+3) (N-P+1)
K(N-P+3) (N-P+2)
… K(N-P+3) N 0 0 … 0 … 0 0 … 0
0 0 … 0 K(N-P+3)
(N-P+1)
K(N-P+3) (N-P+2)
… K(N-P+3) N
… 0 0 … 0
0 0 … 0 0 0 … 0 … KP+3)
(N-P+1)
K(N-P+3) (N-P+2)
… K(N-P+3) N
…
…
…
…
…
…
…
…
…
…
…
…
KN (N-P+1)
KN (N-P+2) … KNN 0 0 … 0 … 0 0 … 0
0 0 … 0 KN (N-P+1) KN (N-P+2) … K NN … 0 0 … 0
0 0 … 0 0 0 … 0 … KN (N-P+1) KN) (N-P+2) … KN N
1st column of kekre’s transform
repeated P times
2nd column of kekre’s
transform repeated P times N
th
Volume 44– No10, April 2012
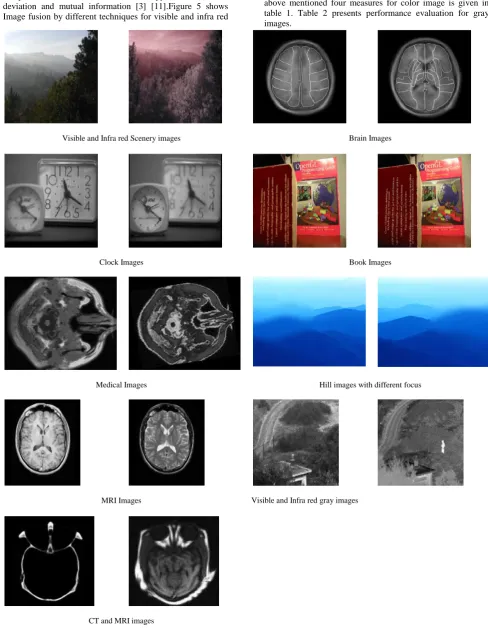
5. RESULTS AND ANALYSIS
Above mentioned techniques are tried on pair of three RGB images and six gray images as shown in fig. 4 and results are compared based on measures like entropy, mean, standard deviation and mutual information [3] [11].Figure 5 shows Image fusion by different techniques for visible and infrared
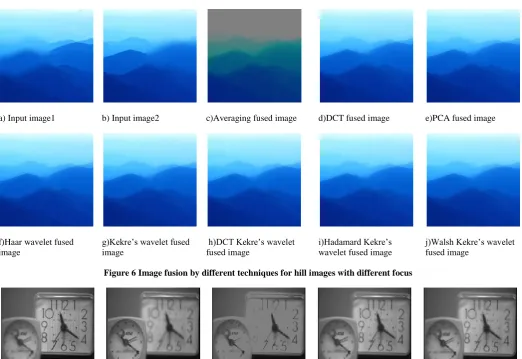
scenery images. Figure 6 shows Image fusion by different techniques for hill images with different focus. Figure 7 shows Image fusion by different techniques for gray clock images with different focus. Performance evaluation based on above mentioned four measures for color image is given in table 1. Table 2 presents performance evaluation for gray images.
Visible and Infra red Scenery images Brain Images
Clock Images Book Images
Medical Images Hill images with different focus
MRI Images Visible and Infra red gray images
CT and MRI images
[image:4.595.51.540.116.747.2]a) visible light Input image1
b) infrared light Input image2
c)Averaging fused image d)DCT fused image e)PCA fused image
f)Haar wavelet fused image
g)Kekre’s wavelet fused image
h)DCT Kekre’s wavelet fused image
i)Hadamard Kekre’s wavelet fused image
[image:5.595.39.558.70.326.2]j)Walsh Kekre’s wavelet fused image
Figure 5 Image fusion by different techniques visible and infra red images
a) Input image1 b) Input image2 c)Averaging fused image d)DCT fused image e)PCA fused image
f)Haar wavelet fused image
g)Kekre’s wavelet fused image
h)DCT Kekre’s wavelet fused image
i)Hadamard Kekre’s wavelet fused image
[image:5.595.39.562.352.711.2]Volume 44– No10, April 2012
f)Haar wavelet fused image
g)Kekre’s wavelet fused image
h)DCT Kekre’s wavelet fused image
i)Hadamard Kekre’s wavelet e fused image
[image:6.595.38.556.70.200.2]j)Walsh Kekre’s wavelet fused image
[image:6.595.54.550.246.582.2]Figure 7 Image fusion by different techniques images with different focus
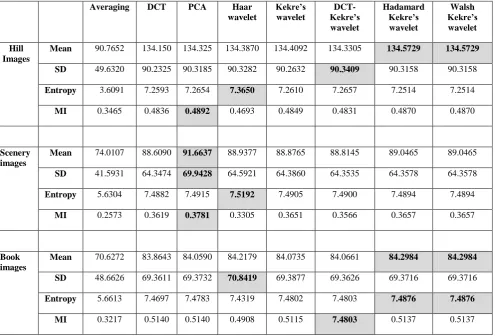
Table 1 Performance evaluation for color images
Averaging DCT PCA Haar wavelet
Kekre’s wavelet
DCT-Kekre’s wavelet
Hadamard Kekre’s wavelet
Walsh Kekre’s wavelet
Hill Images
Mean 90.7652 134.150 134.325 134.3870 134.4092 134.3305 134.5729 134.5729
SD 49.6320 90.2325 90.3185 90.3282 90.2632 90.3409 90.3158 90.3158
Entropy 3.6091 7.2593 7.2654 7.3650 7.2610 7.2657 7.2514 7.2514
MI 0.3465 0.4836 0.4892 0.4693 0.4849 0.4831 0.4870 0.4870
Scenery images
Mean 74.0107 88.6090 91.6637 88.9377 88.8765 88.8145 89.0465 89.0465
SD 41.5931 64.3474 69.9428 64.5921 64.3860 64.3535 64.3578 64.3578
Entropy 5.6304 7.4882 7.4915 7.5192 7.4905 7.4900 7.4894 7.4894
MI 0.2573 0.3619 0.3781 0.3305 0.3651 0.3566 0.3657 0.3657
Book images
Mean 70.6272 83.8643 84.0590 84.2179 84.0735 84.0661 84.2984 84.2984 SD 48.6626 69.3611 69.3732 70.8419 69.3877 69.3626 69.3716 69.3716
Entropy 5.6613 7.4697 7.4783 7.4319 7.4802 7.4803 7.4876 7.4876
MI 0.3217 0.5140 0.5140 0.4908 0.5115 7.4803 0.5137 0.5137
Table 2 Performance evaluation for gray images
Averaging DCT PCA Haar wavelet
Kekre’s wavelet
DCT-Kekre’s wavelet
Hadamard Kekre’s wavelet
Walsh-Kekre’s wavelet
Clock images
Mean 89.5221 96.3092 96.4922 96.6174 96.4766 96.5136 96.7419 96.7419
SD 40.6857 48.9355 48.9555 49.3393 49.0089 48.9689 48.9795 48.9795
Entropy 5.4238 7.3062 7.3066 7.3338 7.3087 7.3088 7.3057 7.3057
[image:6.595.53.548.620.770.2]CT MRI images
Mean 32.1246 32.2862 51.9930 32.5318 32.4113 32.4366 32.6745 32.6745
SD 32.7642 34.8291 53.4098 36.0796 34.8212 34.7672 34.7752 34.7752
Entropy 5.7703 5.9090 6.5409 5.9799 5.9108 5.9231 5.8901 5.8901
MI 0.5744 0.5674 0.7256 0.3982 0.5541 0.5544 0.5901 0.5901
Medical images
Mean 51.9185 51.7076 53.2289 51.9811 51.9424 51.8908 52.1328 52.1328
SD 36.3854 36.8805 37.4420 38.1760 36.9228 36.9002 36.8938 36.8938
Entropy 6.5385 6.6353 6.6308 6.7429 6.6412 6.6385 6.6298 6.6298
MI 0.2693 0.2702 0.2832 0.2290 0.2690 0.2659 0.2768 0.2768
Brain images
Mean 48.8479 49.3843 49.4806 49.5519 49.5237 49.5185 49.6522 49.6522 SD 49.4465 50.7464 50.8346 51.7821 50.8597 50.8453 50.9315 50.9315
Entropy 4.9575 5.1872 5.1890 5.2598 5.2020 5.2105 5.2308 5.2308
MI 0.3862 0.3959 0.3968 0.3844 0.3967 0.3965 0.4019 0.4019
MRI images
Mean 55.6803 62.5453 65.4645 62.7818 62.6141 62.6906 62.8733 62.8733
SD 58.9193 68.3032 71.1772 69.3133 68.4042 68.3605 68.4069 68.4069
Entropy 3.7671 5.6055 5.7225 5.7143 5.5988 5.6298 5.6648 5.6648
MI 0.3426 0.3807 0.4064 0.3567 0.3807 0.3815 0.3876 0.3876
Visible & infra red gray images
Mean 89.5235 90.3802 102.5909 90.6947 90.6901 90.6423 90.8800 90.8800
SD 19.7397 23.1171 48.0841 24.5829 23.1241 23.0979 23.1082 23.1082
Entropy 2.9728 3.2780 3.0784 5.3974 3.7169 3.7410 3.2382 3.2382
MI 0.1829 0.1991 0.5718 0.1777 0.2046 0.2004 0.1987 0.1987
From table 1 it is observed that for hill and book images mean indicating brightness is maximum for Hadamard Kekre’s wavelet and Walsh Kekre’s wavelet technique, while for scenery images it is maximum for PCA. And standard
Volume 44– No10, April 2012
6.
CONCLUSION
In this paper many pixel level techniques like Kekre’s wavelet technique and its combination with Kekre’s transform, DCT, Hadamard and Walsh are implemented and their results are compared with basic techniques such as averaging, PCA, DCT, Haar wavelet. It is observed that the new Kekre’s wavelet transform when used for image fusion gives comparatively good results, just closer to the best result and the added advantage is that it can be used for images of any size, not necessarily integer power of 2.
7
.
REFERENCES
[1] Nianlong Han; Jinxing Hu; Wei Zhang, “Multi-spectral and SAR images fusion via Mallat and À trous wavelet transform “,18th International Conference on Geoinformatics, 09 September 2010, page(s): 1 - 4 [2] XING Su-xia, CHEN Tian-hua, LI Jing-xian “Image
Fusion based on Regional Energy and Standard Deviation” , 2nd International Conference on Signal Processing Systems (ICSPS), 2010,Page(s): 739 -743 [3] Xing Su-xia, Guo Pei-yuan and Chen Tian-hua,” Study
on Optimal Wavelet Decomposition Level in Infrared and visual Light Image Fusion”, International Conference on Measuring Technology and Mechatronics Automation (ICMTMA), 2010 , page(s): 616 – 619 [4] Le Song, Yuchi Lin, Weichang Feng, Meirong Zhao “A
Novel Automatic Weighted Image Fusion Algorithm”, International Workshop on Intelligent Systems and Applications, ISA ,2009 , Page(s): 1 – 4
[5] MA. Mohamed and R.M EI-Den” Implementation of Image Fusion Techniques for Multi-Focus Images Using FPGA” 28th National Radio Science Conference (NRSC 2011) April 26-28, 2011, Page(s): 1 – 11
[6] Dr. H. B. Kekre, Archana Athawale, Dipali Sadavarti,”Algorithm to Generate Kekre’s Wavelet Transform from Kekre’s Transform” , International Journal of Engineering Science and Technology,Vol. 2(5), 2010, page(s): 756-767.
[7] Shivsubramani Krishnamoorthy, K.P.Soman, “Implementation and Comparative Study of Image Fusion Algorithms”, International Journal of Computer Applications, Volume 9– No.2, November 2010, page(s): 25-35.
[8] V.P.S. Naidu and J.R. Raol,” Pixel-level Image Fusion using Wavelets and Principal Component Analysis”, Defence Science Journal, Vol. 58, No. 3, May 2008,
Page(s): 338-352
[9] Dr. H. B.Kekre, Dr. Tanuja K. Sarode, Sudeep Thepade, Sonal Shroff, “Instigation of Orthogonal Wavelet Transforms using Walsh, Cosine, Hartley, Kekre Transforms and their use in Image Compression”, (IJCSIS) International Journal of Computer Science and Information Security, Vol. 9,No. 6, 2011, Page(s) 125-133.
[10] Zhang-Shu Xiao, Chong-Xun Zheng,”Medical Image Fusion Based on An Improved Wavelet Coefficient
Contrast”, 3rd
International Conference on Bioinfromatics and biomedical Engineering, 2009,
Page(s)1-4.
[11] H.B.Kekre, Tanuja Sarode, Rachana Dhannawat,” Kekre’s Wavelet Transform for Image Fusion and Comparison with Other Pixel Based Image Fusion Techniques”, vol. 10, No.3 March 2012.
9. AUTHORS PROFILE
H. B. Kekre: has received B.E. (Hons.) in Telecomm. Engineering. From Jabalpur University in 1958, M.Tech (Industrial Electronics) from IIT Bombay in 1960, M.S.Engg. (Electrical Engg.) from University of Ottawa in 1965 and Ph.D. (System Identification) from IIT Bombay in 1970 He has worked as Faculty of Electrical Engg. and then HOD Computer Science and Engg. at IIT Bombay. For 13 years he was working as a professor and head in the Department of Computer Engg. At Thadomal Shahani Engineering. College, Mumbai. Now he is Senior Professor at MPSTME, SVKM’s NMIMS. He has guided 17 Ph.Ds, more than 100 M.E./M.Tech and several B.E./ B.Tech projects. His areas of interest are Digital Signal processing, Image Processing and Computer Networking. He has more than 270 papers in National / International Conferences and Journals to his credit. He was Senior Member of IEEE. Presently He is Fellow of IETE and Life Member of ISTE Recently 11 students working under his guidance have received best paper awards. Two of his students have been awarded Ph. D. from NMIMS University. Currently he is guiding ten Ph.D. students.
Tanuja K. Sarode: has Received Bsc.(Mathematics)from Mumbai University in 1996, Bsc.Tech.(Computer Technology) from Mumbai University in 1999, M.E. (Computer Engineering) degree from Mumbai University in 2004, Ph.D. from Mukesh Patel School of Technology, Management and Engineering, SVKM’s NMIMS University, Vile-Parle (W), Mumbai, INDIA. She has more than 12 years of experience in teaching. Currently working as Assistant Professor in Dept. of Computer Engineering at Thadomal Shahani Engineering College, Mumbai. She is life member of IETE, member of International Association of Engineers (IAENG) and International Association of Computer Science and Information Technology (IACSIT), Singapore. Her areas of interest are Image Processing, Signal Processing and Computer Graphics. She has more than 100 papers in National /International Conferences/journal to her credit.