Design Plan of Modular Controller Discharge
System using Simulation
Rajesh Kumar Garg
Lecturer,Electronic & Communication Engg. Seth Jai Parkash Polytechnic Damla, Yamuna Nagar-135001
Haryana (INDIA)
Vikram Singh
Professor & Chairperson
Deptt of Computer Science & Applications Chaudhary Devi Lal University, Sirsa
Haryana (INDIA)
ABSTRACT
Modern embedded system design philosophy is heavily dependent on simulation. Simulation provides a means to model an embedded system, perform experiments with the model, test, and evaluate the designs prior to committing to implementation, thus allowing design flaws to be detected and corrected early in the design process. As increasingly more complex embedded systems are being considered for design, their design and validation is proving a Herculean task. Innovative applications demand stringent requirements, necessitating improvements in technologies and system design methodologies. It is where simulation and modeling come in to picture. In this paper, planning for design for Modular Controller Discharge System (MCDS) – an embedded system using simulation is proposed which is a modernized toilet system for trains to avoid the spillage at undesired places or at railway platforms. Speed sensors help to dump the waste at a suitable distance from the railway station. Intermediate tank is used under the toilet seat and it is designed using simulation. A microcontroller or PLC is used to control the action of storage tank.
Keywords:
Embedded system, microcontroller,design process, simulation, and retention tank
I INTRODUCTION
Railways have provided a very good transportation facility for the commuters since more than 100 years in India. It has improved a lot in almost every respect except one thing which would have been given priority, which is helping the deterioration of the surrounding environment. Travelers are advised not to use the lavatories while a train is stationed on a platform or is approaching/leaving the platform. But owing to the call of nature, must someone use latrine or urinal; it must not be spilt on or near the platform. This necessitates an intermediate storage for the excreta, which could be dumped once the train is well past the platform. It is also desired that the commode be tightly sealed with an efficient flushing system of stainless steel in order to be acid resistant. The pneumatic slide valves are made of a polymer. The overall system is controlled by a programmable logic controller (PLC). The PLC used here operates at 24 volts DC and has 4 digital inputs and 4 digital outputs. Fully controlled discharge toilet retains human waste to avoid dumping at stations and discharge it away from stations and city areas. The control unit is programmable and might be programmed according to the requirements of the system. A programmable logical controller/microcontroller can be
programmed to control devices such as limit switches, push buttons, proximity or photoelectric sensors, float switches, or pressure switches etc.( Garry Dunning ,2002)The instructions specified in the user ladder program direct the PLC how to react to the control signals coming from field sensors. After processing the input signals coming from sensors the PLC sends a signal to the field device to control its working. Resultantly, the field-controller devices are turned on or off (Fredric et.al. 2005).The sequence of instructions specified by the programmer and burnt in to the PLC ROM is called the user ladder program. Before a user ladder program is loaded the processor must be in program mode. Thereafter, if all input and output signals are wired to the correct screw terminals, the processor can be put in run mode, wherein, the program will continuously run the user ladder program instructions. Continual running of the program specified in a PLC is called scanning. As part of the processor’s problem-solving routine, the PLC scans the incoming signals, follow the preprogrammed instructions associated with each input signal, and control the programmed output field devices (Webb & Resis, 1995)
II SIMULATION IN SYSTEM
DESIGN
Simulation is utilized early in the design process to ensure the initial design is correct at a high level. Another purpose of simulation at this stage is to gather sufficient information about the system to allow rough analyses of design approaches and tradeoffs. The high-level concept of how the modular controller discharge system will be constructed is documented in the form of architecture diagram and system-level block diagrams. The steps involved in the detailed system design are depicted in Figure 1. In the first step, a developer constructs a simulation of all or parts of the initial high-level system architecture, with the intent of not only visualizing the system, but of verifying the high-level design against the system requirements. Simulations are designed to provide sufficient accuracy and detail to allow the detection of design flaws. (Jersak et al., 2004) and (Monjau & Sporer, 2003) There are two basic types of simulation: performance and functional. A performance simulator abstracts the details of how a system performs its tasks in favor of simulating the temporal aspects of the system.
favor of a rapid execution time. A high-level simulation is used when low-level system details are not needed or are not known. A low-level simulator provides fine-grained, more accurate details at the cost of longer simulation times.
Figure 1 A Typical Embedded System development process.
After simulating the initial design architecture, the designer proceeds to design the system components. Components form the fundamental building blocks of the application. Each component is designed individually. Good design practice dictates that components should conform to well-defined and documented interfaces, and should provide specific entry points. A first step in the development of a component is to construct a simulation of the component’s behavior. The purpose of the component simulation is the same as the simulation of the initial design architecture, to verify the design against the system requirements, or to verify that the component does what it is intended to do. Only after this verification through simulation has been performed should the designer proceed to the more tedious and expensive step of component implementation. Upon completion of the component implementation, the developer tests the component by simulating the inputs and execution environment of the component. (Marwedel, 2003) The behavior of the component implementation can be compared against the component simulation to verify proper functionality. The developer iterates over this process until all components have been implemented and verified. The next step in the design process is system integration. At a high level, integration involves properly connecting components together to form the final system.
(Vahid & Givargis, 2002)
III. MODULAR CONTROLLER
DISCHARGE SYSTEM
It is often seen on busy railway stations of Indian Railways that there is spillage of human excreta on the railway tracks near the platforms. It becomes suffocating and unhygienic for the persons to stand there even for a
short duration. An embedded system - modular control discharge system (MCDS) – has been designed and described in this paper. The objective of the system described here is to provide healthy and clean environs at railway stations. Modus operandi of proposed system is given as under:
Block Diagram
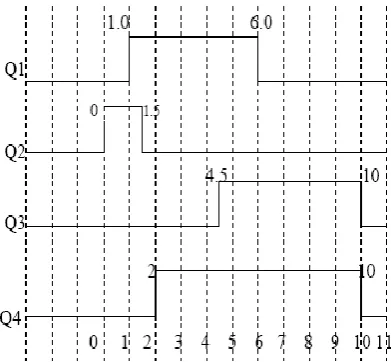
Figure 2 shows the block diagram, with the press of start button, the input I1 goes high andthe various valves operate according to the timing diagram as shown in the fig 3.
Figure 2 Block diagram of Modular Controller Discharge System (MCDS)
The first valve to operate is pressuriser valve i.e. valve Q2.
Figure 3 Timing diagram showing the opening and closing of valves of MCDS
[image:2.595.89.252.144.370.2] [image:2.595.322.535.192.381.2] [image:2.595.316.512.469.650.2]dependent upon the opening timing of the valve Q1. This
timing can be changed as per the requirements. After 2 seconds from the time of start the outlet valve Q4
operates and it remains open for 8 seconds. The opening of the outlet valve is dependent upon the velocity of the train. If the speed of the train is above the designated speed for e.g. 30 km/hr, then only the outlet valve will open. If the speed of the train is less or if the train is stationary then the outlet valve will not operate and the outlet shutter will remain closed. The inlet valve for the intermediate tank will operate after 4.5 sec. and will remain open for 5.5 second. The effluent remains stored in the intermediate tank till the train reaches a speed above the designation speed i.e. 30 km/hr. The intermediate tank is provided with a overflow hose i.e. if the train is stationary and the toilet has been used continuously say more than 8 times then the effluent will overflow through the over flow hose. Even if no person is using the toilet and speed increases above say 30 km/hr. The outlet valve Q4 will perform its cycle once
and will remain closed afterwards whole cycle will complete in 10 seconds. Before 15 seconds, the new cycle will not start even if the user presses start button more than once during the cycle. Th inlet and outlet valve can also be operated manually by pressing manual inlet switch and manual outlet switch. This is done to make input I4 and I3 high. The switches manual inlet and
manual outlet are pressed to lock and then pressed to release. [Garg et. al., 2010]
In case there is a failure of electricity or air pressure. The valves Q4 and Q3 will open automatically. The PLC is
programmed using ladder technique and its specified syntax.
Speed Sensor
:
The speed sensor is an inductive proximity switch whose function is to sense the train speed [5]. As the wheel of the train rotates it sends a pulse to the PLC on each rotation. The PLC counts the number of pulses per minute and since the number of pulses is dependent upon the speed of the train Therefore when the number of pulses is more than the set value the PLC operates the output Q4 the outletvalve. The diameter of wheel is 920 mm i.e. 0.92 meters. If the train moves with a speed of say 30 km/hr. Then N (number of pulses per minute) is as follows:
V = r x w
(Where r is radius & w is angular velocity) 30 km/hr = (0.92 x 2 л N) / 2
N=172 pulse/minute
Design of Simulator
:-
A simulator is designed and developed for helping Embedded System development team, plan their time schedule, work flow etc. and distribute human resources and other efforts over various phases of MCDS development. The simulator helps in identifying development phases of MCDS which are critical and near- critical in respect of successful operations of overall system. The objective is to 1) plan, 2) organize, and 3) manage the development process more economical. The simulator gives the results in form of critical and near-critical phases while considering the rest of phases as concurrent development activities [Zeigler, 1976] The simulator will prove an asset toengineers in planning the development process optimally [Zhao et. al., 1987]
[image:3.595.325.545.307.606.2]Simulator is a software tool resulting from application of modeling and simulation to real life systems[ Law & Averill,2000]. It involves 1) modeling of system under the study. 2) representing the model in network form. 3) execution of computer form (net work form) and evaluation of simulation experiment. The aim of this research paper is to develop a simulator for planning development process of embedded system. Embedded system development is complex task, is conveniently decomposed into several phases. [Ghezzi et.al. 1991] and [Pritsker, 1995]. The embedded system is divided in to modules. The development of each module involves a series of activities whose temporal requirements are stochastically. Development of each phase involves carrying out various SDLC activities [Hetzel, 1984] and [Payne et.al.1989].
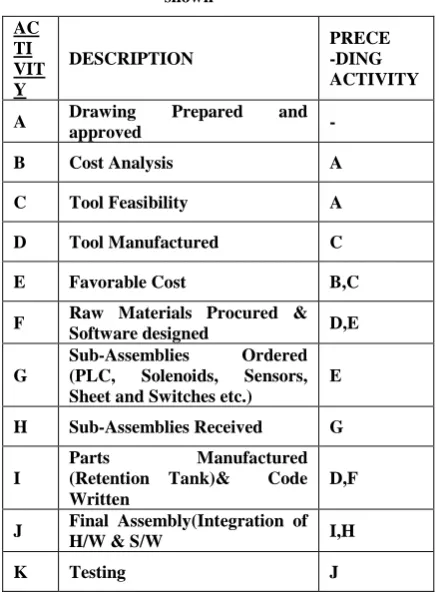
Table 1 Activities and precedence among them is shown
In development of above mentioned system following life cycle activities have been considered. These activities have a precedence relationship amongst themselves shown in Table1. (Sharma, 2008)
IV NETWORK DIAGRAM
The network diagram is according to the activities shown in Table 2.
AC TI VIT Y
DESCRIPTION
PRECE -DING ACTIVITY
A Drawing Prepared and
approved -
B Cost Analysis A
C Tool Feasibility A
D Tool Manufactured C
E Favorable Cost B,C
F Raw Materials Procured & Software designed D,E
G
Sub-Assemblies Ordered (PLC, Solenoids, Sensors, Sheet and Switches etc.)
E
H Sub-Assemblies Received G
I
Parts Manufactured (Retention Tank)& Code Written
D,F
J Final Assembly(Integration of H/W & S/W I,H
1 2 4
3
5 6
7
8 A
9
10 B
C Dum.
E
D
I F
G
H
J
[image:4.595.71.283.73.200.2]K
[image:4.595.337.480.166.456.2]Figure 4 Network representation of embedded system “Modular Controller Discharge System”
Table 2 Input data for Simulator
Where ACT[S] – ACTIVITY, S[S] - START-NODE [S] FINISH_NODE[S] – F[S]
A[S] = optimistic Time estimate for each activity, M [S] = most likely duration for each activity,
B [S] = most pessimistic Time estimate for each activity. (Deo, 2008)
Mean, µ[S] = (A[S] + 4*M [S] + B [S])/ 6 and Standard Deviation σ [S] = ((B[S]-A[S])/6)2
V DISCUSSIONS ON RESULTS
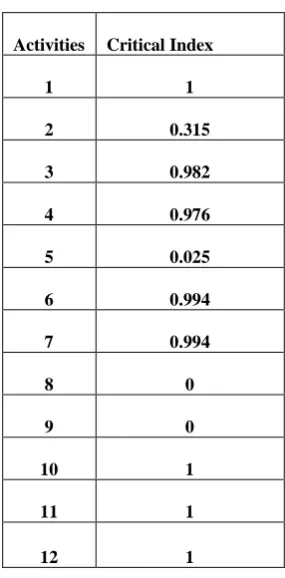
The simulator is executed with following fixed inputs N= 12, M= 10, N RUNS=1000, Error=.001 Criticality indices obtained from the simulator are given in the Table3.
Table 3 Criticality index Table
Activities Critical Index
1 1
2 0.315
3 0.982
4 0.976
5 0.025
6 0.994
7 0.994
8 0
9 0
10 1
11 1
12 1
These values are displayed in the graphical form in the chart of figure 5 Criticality indices of embedded activities determine the vital activity for operation of embedded system and therefore act as an indicator of how much resource must be allocated for developing of individual module.
Critical Index of Activities
0 0.1 0.2 0.3 0.4 0.5 0.6 0.7 0.8 0.9 1
1 2 3 4 5 6 7 8 9 10 11 12
ACTIVITIES
C
R
ITI
C
A
L
IN
D
E
X
Critical Index
Figure 5 Critical index of activities
Analyzing the simulator output for embedded system of figure 4 we find that criticality indices of embedded activity bearing numbers 1, 3, 4, 6, 7, 10, 11, 12 are on the higher side than rest of the activities. This leads us to conclude that these embedded modules are more
ACT [S]
SE [S] F[S]
A [S]
M [S]
B [S]
µ [S]
σ [S]
A(1) 1 2 3 6 10 6.2 1.36
B(2) 2 4 6 7 12 7.7 1.00
C(3) 2 3 7 9 12 9.2 .69
DUM
(4) 3 4 0 0 0 0 0
D(5) 3 7 8 12 17 12. 2 2.25
E(6) 4 5 3 6 10 6.2 1.36
F(7) 5 7 10 12 15 12. 2 .69
G(8) 5 6 4 7 10 7 1
H(9) 6 8 6 8 12 8.4 1
I(10) 7 8 10 13 17 13. 2 1.36
J(11) 8 9 6 8 12 8.4 1
K(12
[image:4.595.316.536.547.677.2]important than other for operation of whole embedded system. Any fault in risk prone embedded system modules will result into the failure of the embedded system. This concludes that these are more important than other phases of the modular controller discharge system. Any fault in these risk prone phases will result into failure. These are the activities on which more attention must be given at the time of planning for design of the system. Any delay or less attention may cause a lot of loss and unnecessary delay in completion of above mentioned project
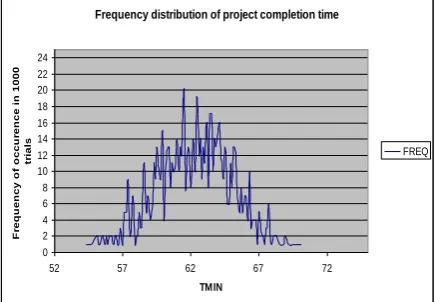
Figure 6 shows the graph between TMIN (Project completion time) and frequency. The above network is simulated 1,000 sample runs. From the graph, the minimum time for completion of the project is 54 days and maximum is 70 days.
Frequency distribution of project completion time
0 2 4 6 8 10 12 14 16 18 20 22 24
52 57 62 67 72
TMIN
F
re
q
u
e
n
c
y
o
f
o
c
c
u
re
n
c
e
i
n
1
0
0
0
tr
ia
ls
[image:5.595.73.291.262.413.2]FREQ
Figure 6 Frequency distribution of project completion time
The graph is shown in fig 6 is appears reasonably close to normal distribution. We can use this graph as it is to estimate the probability of completing the project in a given time. We can also increase the number of trials from 1000 to 5000 to enhance the confidence in the graph.
VI CONCLUSION
Embedded system development project need to be i) Planned ii) Scheduled iii) Organized and managed more efficiently as there is rapid development in embedded system business continuously year after year. Proper planning and scheduling helps us in better quality and system can be developed and delivered in time. Identify the modules of higher operational risks and concentrate more on development of such modules. The simulator developed and described in this paper will prove as a valuable tool to the embedded system development team better planning by identifying embedded activities that are vital for operation of the embedded system while manufacturing time-cost trade-offs.
REFERENCES
[1] Garry Dunning, “Introduction to Programmable Logic Controller”, Thomsan Asia Pte Ltd., Singapore, Second Edition 2002.
[2]John R, Hackworth Fredric D. Hack worth Jr, “Programmable Logic Controllers Programming methods and Applications”, Person Education (Singapore) Pte. Ltd, Third Edition, 2005.
[3] Webb, J.W. & Reis, R.A. “Programmable logic controllers: Principles and Applications” (3e), New Delhi: Prentice Hall, International 1995.
[4] Zeigler, B.P., “Theory of Modeling and Simulation”, Wiley, New York, 1976
[5] Zhao, W., et.al,”Scheduling Tasks with Resource requirement in Hard Real -Time Systems,” IEEE Transactions on Software Engineering, Vol. SE-13, No.5, pp.564-577, May 1987.
[6] Law, Averill M., and Kelton, W.D., “Simulation Modeling and Analysis”, 3rd ed., McGraw-Hill, New
York, 2000.
[7] Ghezzi, C., Jazayeri, M. and Mandrioli, D.,“Fundamentals of Software Engineering”, Prentice-Hall, Englewood Cliffs, New Jersey, 1991.
[8] Pritsker, A.A. and Allen, B. “Introduction to Simulation and SLAM II”, 4th
ed., Wiley & Sons, New York, 1995
[9] Hetzel, W., “The Complete Guide to Software Testing”, QED Information Sciences, 1984.
[10] Payne, James A., “Introduction to Simulation”, McGraw-Hill – International Students Edition, Hong Kong, 1989.
[11] Narsingh Deo, “Simulation with Digital Computer”, Prentice Hall of India Private Limited, Eighth Edition, 2008
[12] S.D. Sharma, “Operations Research”, Kedar Nath Ram Nath, Merrut, Fifteenth Edition, 2008
[13] Wiest, J. D. and F. K. Levy, “A management guide to PERT/CPM”, Prentice Hall of India Private Limited, New Delhi, Second Edition, 1978.
[14]Jersak, M., Richter, K. & Ernst, R., “Interval-Based Analysis in Embedded System Design. Mathematics and Computers in Simulation”, 66(2-3), 231-242, 2004. [15]Marwedel, P. “Embedded System Design” (1e), Boston: Springer Verlag/ Kluwer Academic Publishers.2003.
[16]Monjau, D. & Sporer, M.“A Universal Simulation Environment For Embedded Systems”. In proceedings of International Conference on Modeling, Identification and Control, Innsbruck, Austria., 2003.
[17]Vahid, F. & Givargis, T. “Embedded System Design: A Unified Hardware/Software Introduction”, New York: John Wiley & Sons.2002.