Analysis of User Requirements Gathering Practices in
Agile and Non-Agile Software Development Team
Sunaina Ghai
Department of computer science Punjabi university regional campus, mohali
Jagpuneet Kaur
Assistant professor Punjabi university, patialaABSTRACT
Software engineering is continuously gaining success day by day. In last decades a lot of growth has been observed in the software industry. Various new software development methodologies are introduced such as agile software development with increasing demand of software industry. In all these development methodologies, user requirements play an important role for completion of the successful project. If requirements are not clear it can be the reason of project failure. Now a day’s some industries are not aware about the right way to collect and fulfill the requirements. This survey based study focused on the analysis of user requirements gathering practices in agile and non-agile software development teams. Main purpose of this study is to analyze the factors involved in requirements gathering practices and rate of maximum agility in tri-city (Mohali, Chandigarh and Panchkula) on the basis of different work experiences.
General Terms
Agile requirements engineering, chi-square test, agility.
Keywords
Software Developments, Requirements Engineering, Requirements Analysis, User Requirements Analysis.
1. INTRODUCTION
Software engineering is the very integrated part of the industry from mid nineties. Software industry became significant economical activity from the last few decades. Developing the software is error prone because of many labor-intensive activities. Every year there are more software-based devices controlling functions that are critical to human survival. The chances of disasters and failures of these software-based devices have greatly increased.
In 1995, Standish Group published a survey report called ‘chaos report’. The failure rate of all type of companies is presented in this report. This rate is mentioned in below points [2].
Only 9% of projects in large companies were successful, compared to 16.2% for medium companies and 28% for small companies.
61.5 % of large company projects were challenged, compared to 46.7% for medium companies and 50.4% for small companies.
29.5 % projects were cancelled in large companies, compared to 37.1% for medium companies and 21.6% for small companies.
For every 100 projects that start, there are 94 projects restarts.
1.1 Problem definition
Effectively gathering user requirements is a critical first step of any project and perhaps one of the most challenging project management skills. Focus of study is on the analysis of user requirements gathering in agile and non-agile software development teams. It has been made possible by conducting a survey with questionnaires, and analyzing the rate of agility on the basis of responses given by of various respondents.
1.2 Evolution
Waterfall model was being followed where requirements are fixed and the next phase starts when the earlier one are finished. It represents the most widely accepted traditional developmental method. Evolutionary model and spiral model are proposed to overcome the limitation of waterfall model where prototype is first made and then that is converted to the working software. But the common limitation of all is that, at later phases no process is able to handle the change of requirements. Then, agile software development is proposed to overcome the limitation of all models that was to handle the change in requirements at later phases.
1.3 Purpose of the study
The main purpose of the study is to analyze the role of user requirements gathering practices in agile and non-agile software development teams. The study is divided into two consecutive steps:
I. Identify the factors involved in the various practices of requirements analysis
II. Analyze the rate of agile and traditional requirement gathering practices empirically on the basis of different work experiences.
1.4 Contributions of this study
The main contributions of this study are highlighted in the following points. Beneficiary of our findings are:
Agile organizations: It helps various organizations to understand the factors affecting requirements analysis procedure.
Requirement analysts: Analysts also plays an important role in requirement analysis. It is the role of the project manager or business analyst to ask the right questions and communicate effectively with all stakeholders.
that 37% of the problems occurred in the development of challenging systems are related to the Requirement phase [14].
Conceptually, requirements engineering includes three types of activity mainly eliciting requirements, analyzing requirements, recording requirements.
3. RESEARCH METHODOLOGY
To achieve the set objectives, a questionnaire was framed by taking care of the agile principles So the questionnaire not only takes part in research but also makes publicity of user requirement gathering practices to those who are not aware about agile requirements gathering practices. Respondents were contacted by direct mailing and they were offered personal appointments to fill out questionnaires. They could choose to have the company data processes anonymously. Descriptive statistics tools (mean, frequency) and chi-square test are the tools which have been used to comprehend the collected data into meaningful form. However, reliability of the questionnaire also be judged by using existing statistical tests.
4. ANALYSIS OF DATA, RESULTS AND
DISCUSSIONS
The raw data for the study was obtained with the help of a survey. In order to screen the data for meaningful purposes, the data was analyzed by using statistical tools like descriptive statistics (mean, frequency) and chi square test.
4.1 Reliability of the data
Reliability of the data is to be calculated by finding the value of coefficient of reliability that is Cronbach’s alpha. It was calculated with the help of statistical tool SPSS.
Table 4.1 Reliability value
Coefficient of reliability Value of coefficient of reliability
Cronbach’s alpha 0.745 (Acceptable)
4.2 Data analysis
The results were obtained using descriptive statistics, chi-square test, keeping in view the nature and objective of the study.
4.2.1 SECTION A
This section consists of the organization’s information covered for this survey it includes representation of organization domain, number of employees, work experience of respondents and annual turnover of the organization. 30 respondents were responded the questionnaire.
Table 4.2 Statistics of respondents
Organi zation domain
No. of employees
Work exper-ience
Annual turnover of
organiz-ations N
Valid
30 30 30 30
Missi ng
0 0 0 0
Where N is number of respondents
Table 4.2 gives the statistics of number of respondents of questionnaire. This statistics shows that the 30 respondents answered for this survey. All of the 30 respondents respond for every questions included in organization information section. The details of the every question are represented in the form of table and pie chart representation below.
[image:2.595.317.541.186.480.2]1. Organization domain representation:
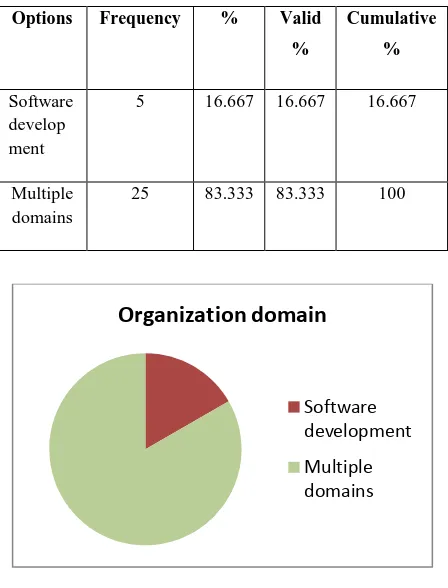
Table 4.3 Domain representation of organizations
Options Frequency % Valid
%
Cumulative
%
Software develop ment
5 16.667 16.667 16.667
Multiple domains
25 83.333 83.333 100
Figure 4.1 Organization domain
As can be seen both from the table and chart given above, 17% of the respondents surveyed belong to organizations working in software development only and 83% of the respondents surveyed belongs to organizations working in multiple domains.
[image:2.595.307.541.591.742.2]2. Number of employees representation:
Table 4.4 Number of employees
Options Frequency % Valid
%
Cumulative %
0-50 16 53.333 53.333 53.333
50-500 10 33.333 33.333 86.666
500-1000 3 10 10 96.666
Over 1000
1 3.334 3.334 100.00
Organization domain
Software development
Figure 4.2 Number of employees
As can be seen both from the table and chart given above, 53.333 % of the respondents belongs to organizations having 0-50 employees , 33.333 % having 50-500 employees, 10% having 500-1000 employees and 3.334% belongs to organization having more than 1000 employees.
[image:3.595.312.539.86.436.2]3. Work experience:
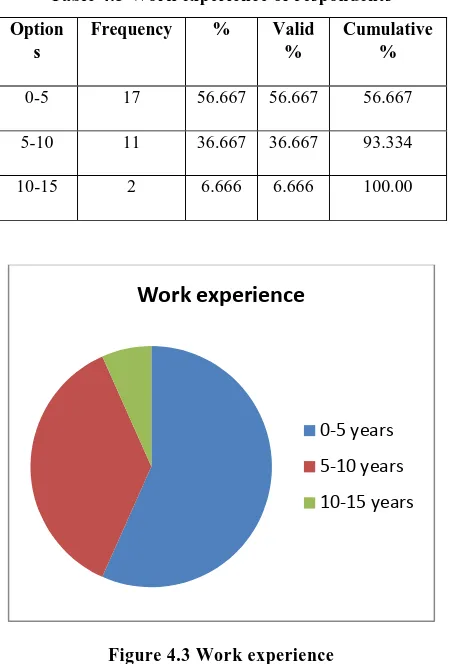
Table 4.5 Work experience of respondents
Option s
Frequency % Valid
%
Cumulative %
0-5 17 56.667 56.667 56.667
5-10 11 36.667 36.667 93.334
10-15 2 6.666 6.666 100.00
Figure 4.3 Work experience
As can be seen both from the table and chart given above, 56.667 % of the respondents belongs to organizations having experience of 0-5 years , 36.667 % having experience of 5-10 years and 6.666 % having experience of 10-15 years.
4. Annual turnover of organizations:
Table 4.6 Annual turnovers of organizations
Options Frequency % Valid
%
Cumulative %
1-25 millions
25 83.334 83.334 83.334
25-50 millions
4 13.333 13.333 96.667
more than 75 millions
1 3.333 3.333 100
Figure 4.4 Annual turnovers
As can be seen both from the table and chart given above, 83.334 % of the respondents belongs to organizations having annual turnover 0-25 billion dollars , 13.333 % of the respondents belongs to organizations having annual turnover 25-50 million dollars and 3.333% of the respondents belongs to organizations having annual turnover more than 75 million dollars.
4.2.1 SECTION A
It includes the analysis of agile perceptions.
4.2.2.1 Chi-square test
A chi square (X2) statistic is used to investigate whether distributions of categorical variables differ from one another. This test allows us to compare a collection of categorical data with some theoretical expected distribution.
Setting of hypothesis:
H0: Two categorical variables (responses and work experience) are independent.
Ha: Two categorical variables (responses and work experience) are dependent.
Testing of hypothesis:
Test of hypothesis is shown in table 5.5 below. Hypothesis is being tested with 5% level of significance. If the calculated value of chi-square test is greater than the value at 5% level of significance, the null hypothesis will be rejected and alternative hypothesis is accepted. Otherwise the null hypothesis is accepted.
Number of employees
0-50
50-500
500-1000
over 1000
Work experience
0-5 years
5-10 years
10-15 years
Annual turnovers (in dollars)
0-25 billion
25-50 billion
[image:3.595.56.282.316.648.2]Table 4.7 Categorical data set
R1 R2 R3 R4 R5 R6 R7 T
W1 11 250 100 23 16 11 0 510
W2 86 162 63 6 7 6 0 330
W3 10 24 16 5 4 0 1 60
T 206 436 179 34 27 17 1 900
Where RX: Type X response (where X=1,2,3,4,5,6,7) T: Totals.
[image:4.595.50.284.274.770.2]W1: Work experience (0-5 years). W2: Work experience (5-10 years). W3: Work experience (10-15 years).
Table 4.8 Chi-square test
N O E |O-E| |O-E|2 (|O-E|2) /E
1 110 116.7 6.7 44.89 0.385
2 250 247 3 9 0.036
3 100 101.4 1.4 1.96 0.019 4 23 19.2 3.8 14.44 0.752
5 16 15.3 0.7 0.49 0.032
6 11 9.6 1.4 1.96 0.204
7 0 0.6 0.6 0.36 0.6
8 86 75.5 10.5 110.25 1.46
9 162 159.8 2.2 4.84 0.03 10 63 65.6 2.6 6.76 0.103 11 6 12.5 6.5 42.25 3.38
12 7 9.9 2.9 8.41 0.849
13 6 6.2 0.2 0.04 0.006
14 0 0.4 0.4 0.16 0.4
15 10 13.7 3.7 13.69 0.99
16 24 29 5 25 0.862
17 16 11.9 4.1 16.81 1.413
18 5 2.3 2.7 7.29 3.17
19 4 1.8 2.2 4.84 2.689
20 0 1.1 1.1 1.21 1.1
21 1 0.06 0.94 0.8836 14.727
T 33.207
Where, O is observed frequency. E is expected frequency. T is total.
N is serial number. Chi-square = 33.207
Degrees of freedom = (7-1)*(3-1) Degrees of freedom = 12
Reject Ho because 33.207 is greater than 21.03 (for alpha = 0.05).Thus, we would reject the null hypothesis that responses and work experience are independent. Testing of hypothesis shows that that response can vary with work experience. This means that the knowledge of agile requirements analysis varies with work experience of respondents.
4.2.2.2 Overall maximum agility in tri-city on the
basis of different work experiences
As 1 (Strongly agree) as the highest priority value for agile in scale 1-7, for which the value of mean comes out to be 4. As moving towards 1 mean value will gradually decrease from 4, so less the value of mean more will be the better solution for agile. Zero response is invalid and cannot be considered as part of validation.
According to the various responses given by the respondents, overall maximum agility on the basis of different work experiences is to be calculated as given below.
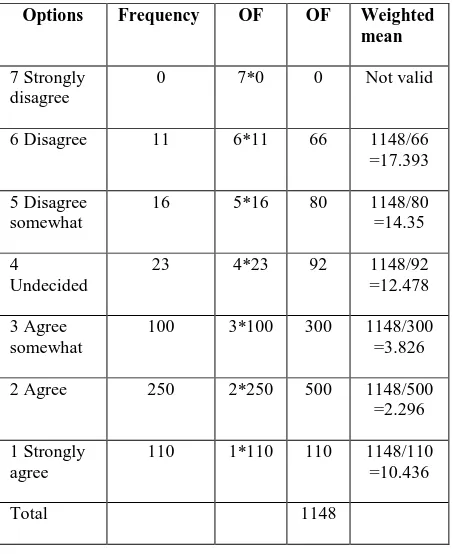
Table 4.9 Overall maximum agility with (0-5) work experience
Options Frequency OF OF Weighted
mean
7 Strongly disagree
0 7*0 0 Not valid
6 Disagree 11 6*11 66 1148/66 =17.393
5 Disagree somewhat
16 5*16 80 1148/80
=14.35
4
Undecided
23 4*23 92 1148/92
=12.478 3 Agree
somewhat
100 3*100 300 1148/300 =3.826 2 Agree 250 2*250 500 1148/500
=2.296 1 Strongly
agree
110 1*110 110 1148/110 =10.436
Total 1148
Where OF is observed frequency
According to responses given by all respondents from tri-city, 2.296 is the minimum weighted mean. Therefore overall maximum agility can be calculated.
[image:4.595.316.542.368.645.2]Table 4.10 Overall maximum agility with (5-10) work experience
Options Frequency OF OF Weighted
mean
7 Strongly disagree
0 7*0 0 Not valid
6 Disagree 6 6*6 36 694/36
=19.277 5 Disagree
somewhat
7 5*7 35 694/35
=19.828 4
Undecided
6 4*6 24 694/24
=28.916 3 Agree
somewhat
63 3*63 189 694/189 =3.672
2 Agree 162 2*162 324 694/324 =2.1419
1 Strongly agree
86 1*86 86 694/86 =8.069
Total 694
Where OF is observed frequency.
According to responses given by all respondents from tri-city, 2.1419 is the minimum weighted mean. Therefore overall maximum agility can be calculated as below.
[image:5.595.54.282.485.751.2]Overall agility = [(7-2.1419)/7]*100 = 69.4%
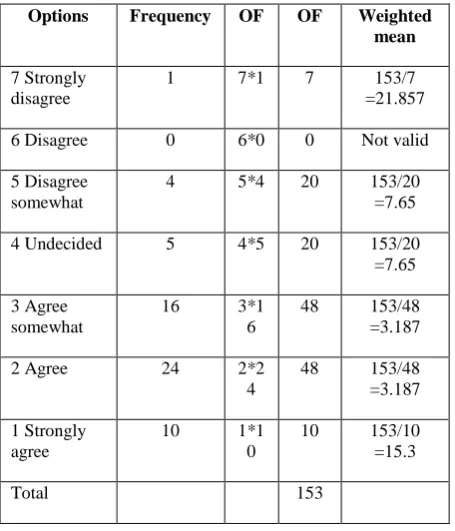
Table 4.11 Overall maximum agility with (10-15) work experience
Options Frequency OF OF Weighted
mean
7 Strongly disagree
1 7*1 7 153/7
=21.857
6 Disagree 0 6*0 0 Not valid
5 Disagree somewhat
4 5*4 20 153/20
=7.65
4 Undecided 5 4*5 20 153/20
=7.65 3 Agree
somewhat
16 3*1
6
48 153/48 =3.187
2 Agree 24 2*2
4
48 153/48 =3.187 1 Strongly
agree
10 1*1
0
10 153/10 =15.3
Total 153
Where OF is observed frequency.
According to responses given by all respondents from tri-city, 3.187 is the minimum weighted mean. Therefore overall maximum agility can be calculated as below.
Overall agility = [(7-3.187)/7]*100 = 54.47%
From the above calculated values of agility in tri-city it is clear that all software development firms which are surveyed following agile practices along with other practices. With the various successful features of agile, companies are moving towards the agile at faster rate but these have some traditional features also. So there is a hybrid environment analyzed in software development firms of tri-city. And rate of agile adoption is increasing day by day.
5. CONCLUSION
It is clear that all software development firms which are surveyed follow agile practices along with other practices. With the various successful features of agile, companies are moving towards the agile at a faster rate but these have some traditional features also. So there is a hybrid environment analyzed in software development firms of tri-city. The rate of agile adoption is increasing day by day. Rate of maximum agility with varying work experience is calculated. Maximum agility is analyzed in tri-city of respondents having experience 10-15 years.
6. ACKNOWLEDGEMENTS
I would like to place on record my deep sense of gratitude to people who helped and supported me in my work.I express my sincere gratitude to Ms. Jagpuneet kaur, Assistant professor ,Department of computer science, Punjabi University, Patiala for guiding me with attention and care. She has taken pain to go through the work and make necessary corrections when needed. Most importantly, I would like to thank my parents and the Almighty for showing me the right direction, to help me stay calm and keep moving even at times when there was no hope.
7. REFERENCES
[1] Fayad, M. E., Laitinen, M., & Ward, R. P., “Software engineering in the small”, Communications of the ACM, vol. 43(3), pp. 115–118, 2000.
[2] The Standish Group, The Chaos report, http://www.projectsmart.co.uk/docs/chaos-report.pdf (dated 8/Jan/2010).
[3] Version one, 3rd Annual Survey: “The State of Agile Development”,http://www.Versionone.com/pdf/3rd
AnnualStateOfAgile_FullDataReport.pdf, 2008.
[4] M. Huo, J. Verner, L. Zhu & M.A. Babar, “Software quality and agile methods” presented at the COMPSAC '04: Proceedings of the 28th Annual International Computer Software and Applications Conference, pp. 520-525, 2004.
[5] W. W. Royce, “Managing the Development of Large Software Systems”, in the Proceedings of 9th
International Conference Software Engineering, IEEE Computer Society, pp. 328-338, 1987.
[6] F. Paetsch, A. Eberlein & F. Maurer, “Requirements engineering and agile software development”, 12th
Infrastructure for Collaborative Enterprises, pp. 308-313, June 2003.
[7] Andrea De Lucia & Abdallah Qusef, “Requirement engineering in agile software development”, journal of emerging technologies in web intelligence, vol. 2(3), pp. 212-220, August 2010.
[8] S. Powell, F. Keenan, K. McDaid, “Enhancing agile requirements elicitation with personas”, IADIS International journal on computer science and information systems, vol. 2(1), pp. 82-95, 2007.
[9] S. Bhalerao, D. Puntambekar & M.Ingle, “Generalizing agile software development life cycle”, International journal on computer science and engineering, vol. 1(3), pp. 222-226, 2009.
[10] J. Kalermo & J. Risanen, “Agile software development in theory and practice,” M.S. thesis, Department of computer science and information system at University of Jyvaskyla, 2002.
[11] Z. Rachdeva, M. Daneva , A. Herrmann & R.J. Wieringa, “A conceptual model and process for client-driven agile requirements prioritization”, in the proceedings of the 4th international conference on research challenges in computer science, Nice, France, pp. 287-297, ISBN: 978-1-4244-4840-1, 2010.
[12] M. Maguire & N. Bevan, “User requirement analysis : a review of supporting methods”, proceedings of IFIP 17th world computer congress, Montreal, Canada, pp. 133-148, 25-30 august 2002.
[13] A. chaudhary, A. Punia & M. Pujar, “Requirements engineering role in agile development”, presented at Infosyslabs.[Online].Available:http://www.infosys.com/ Infosyslabs/publications/documents/requirement-engineering-agile-development.pdf, 2008.
[14] A. Polini, “Software Requirements”, [Online].Available: http:// www1.isti.cnr.it /~ polini/ lucidiSE / Requirements1.pdf, February 2010.
[15] A. Buchalcevova, “Research of the Use of Agile Methodologies in the Czech Republic”, C. Barry, M. Lang, W. Wojtkowski, G. Wojtkowski, S. Wrycza, & Zupancic, The Inter-Networked World: ISD Theory, Practice, and Education. Springer-Verlag: New York, ISBN 978-0387304038, 2008.
[16] M.A. Awad, “A comparison between agile and traditional software development methodologies”, M.S. Thesis, University of western Australia, 2005.