Genotype-Specific Quantitative PCR Assay
Francesca Bonvicini,aElisabetta Manaresi,aGloria Bua,aSimona Venturoli,bGiorgio Gallinellaa,b
Department of Pharmacy and Biotechnologyaand S. Orsola-Malpighi Hospital, Microbiology Unit,bUniversity of Bologna, Bologna, Italy
Three genotypes have been identified within the parvovirus B19 species (B19V), and such genetic diversity may have significant implications for the development of molecular detection assays. In the present study, B19V genetic variability has been exam-ined on a subset of genomic sequences available in the NCBI nucleotide database, and a quantitative PCR (qPCR) assay able to detect, differentiate, and quantify all viral variants has been established. The designed primers and probes have been used for the development of alternative detection formats, based on a combined use of intercalating dye and genotype-specific hydrolysis probes. The qPCR assay analytical performances have been determined on the 1st WHO International Reference Panel for Parvovirus B19 Genotypes. The developed qPCR protocols allow for the detection of genotypes 1 to 3 with equal accuracy, and with a limit of detection (LOD) of 200 IU/ml. A comparison of routine performance was carried out with respect to a previously established assay specifically validated on B19V genotype 1. For 130 clinical samples analyzed, 126 showed concordant results (31 positive and 97 negative), while 4 showed discordant results. Overall, the genotype-specific qPCR assay showed a sensitivity of 93.94% and a specificity of 97.94%, with an agreement rate of 96.92%. The proposed qPCR assay and the alternative protocols developed, each with robust performance, may allow choice with respect to operational systems and diagnostic requirements and might contribute to provide a more reliable diagnostic service and epidemiological surveillance of B19 virus.
H
uman parvovirus B19 (B19V) is a widespread human-patho-genic virus and a member of theErythrovirusgenus in theParvoviridaefamily (1). In the last decade, due to the introduction of innovative molecular techniques, the taxonomy in the family has grown in complexity to accommodate a still-increasing num-ber of newly recognized viruses (2). Specifically, B19 viruses are now formally subdivided into three genotypes, the prototype ge-notype 1 and the two variant gege-notypes 2 and 3, and further sub-types (3,4). In particular, within genotype 1, the majority of iso-lates are referred to as genotype 1a, while a few isoiso-lates from Asia show separate clustering and are referred to as genotype 1b (5). Within genotype 3, two distinct subtypes are usually referred to as genotypes 3a and 3b (6). All B19V genotypes appear to cocirculate, but their relative frequencies are strikingly different: genotype 1a is ubiquitous worldwide, genotype 2 is rare and sporadically de-tected in different geographic settings, including Europe, and ge-notypes 3a and 3b are detected at higher frequencies in western Africa and at lower frequencies in other geographic areas (7–10). The three B19V genotypes are assumed to have similar biolog-ical properties, pathogenic capacities, and transmission routes and pose a similar diagnostic challenge in the clinical setting (11). Of relevance, all genotype variants can be contaminants of blood and blood-derived products, so mandatory screening for removal of high-titer blood units from manufacture processes must be able to detect all genotypes (12,13). Nucleic acid amplification proce-dures, specifically enabling the detection and exact quantification of all genotypes and including an internal control, should be con-sidered the standard analytical method for the molecular detec-tion of B19V DNA in clinical applicadetec-tions and plasma screening (14). The pursuit of two main requirements, namely, the capabil-ity of detection of all genotypes of B19V and a standardized quan-tification of viral targets, can take advantage of an ample amount of sequence information from nucleotide databases and can rely on the recent availability of international standards as reference materials (15).
The aim of the present study was to investigate sequence vari-ability within the B19V species to design and validate a quantita-tive PCR (qPCR) assay for the detection, quantification, and dis-crimination of all B19V DNA genotypes in biological samples. Following a bioinformatic analysis on a subset of B19V genomic sequences available in the NCBI nucleotide database, represen-tative of genotypes 1 to 3 and related subtypes, a suitable target region for B19V amplification and probe-specific genotyping was identified. A triplex qPCR format was devised. Consensus primers able to recognize all genotypes by including only a single base degeneration were used in a real-time PCR assay together with two genotype-specific hydrolysis probes. The combined use of a generic double-stranded DNA (dsDNA) intercalating dye (Sybr green) to detect amplicon accumulation and genotype-spe-cific fluorescent probes guarantees both a high flexibility in the detection of newly emerging variants and a specific identification of prototype or variant genotypes. An internal control reagent for assay validation was amplified in a parallel amplification reaction. In a derived protocol, the same primers and hydrolysis probes could be used as reagents for coupled B19V detection and geno-typing, together with internal control amplification, in a single-tube approach, by using a commercially available kit. The analyt-ical performances of the qPCR assay were evaluated on the 1st WHO International Reference Panel for Parvovirus B19 Geno-types for nucleic acid amplification technique (NAT)-based assays (15) and, subsequently, on clinical samples tested with a
lab-de-Received29 July 2013 Returned for modification21 August 2013 Accepted28 August 2013
Published ahead of print4 September 2013
Address correspondence to Giorgio Gallinella, [email protected].
Copyright © 2013, American Society for Microbiology. All Rights Reserved.
doi:10.1128/JCM.01970-13
on May 16, 2020 by guest
http://jcm.asm.org/
veloped qPCR methodology, previously established and validated to detect genotype 1 targets (16).
MATERIALS AND METHODS
Samples.The 1st WHO International Reference Panel for Parvovirus B19 Genotypes for NAT-based assays (NIBSC 09/110) includes four different panel members (members M1 to M4): M1, M2, and M3 consist of geno-type 1, genogeno-type 2, and genogeno-type 3a B19V-positive plasma samples, re-spectively, and M4 is a negative plasma sample. The material was supplied by the National Institute for Biological Standards and Controls (NIBSC) as liquid/frozen material. Single-use aliquots were prepared and stored at
⫺70°C. Serial 1-log dilutions were prepared in M4-negative plasma and used in the qPCR assays. The assigned potency of each NIBSC 09/110 panel member is 106IU/ml, relative to the NIBSC 99/802 standard (15).
One hundred thirty consecutive serum samples were analyzed at the Microbiology Unit of Policlinico S.Orsola-Malpighi, Bologna, Italy, in the periods of May and June 2012 (n⫽69) and May and June 2013 (n⫽61), with a specific request of B19V DNA detection. Clinical samples were available to the research group as part of the institutional diagnostic ser-vice at the microbiology unit. All analyzed samples were collected, pro-cessed, and assigned an anonymous code number according to approved and certified protocols, meeting the requirements of the Ethical Commit-tee of Policlinico S.Orsola-Malpighi and Italian privacy law (decree 196/ 2003, 1110).
Nucleic acid extraction.The NIBSC 09/110 M1 to M3 panel members and the serum samples were processed by using the NucliSENS easyMAG equipment (bioMérieux). A 100-l volume of sample was processed by following the manufacturer’s instructions, and nucleic acids were col-lected in a 100-l volume of eluate. Plasmid pEC01 (16), containing as an insert a synthetic sequence, was added at 109copies/ml to the lysis buffer
during the procedure, copurified with sample nucleic acids, and used as the analytical control reagent in the lab-developed qPCR assay. Con-versely, in the derived protocol exploiting the QuantiFast pathogen PCR kit (Qiagen), the highly concentrated internal control DNA supplied by Qiagen was added to the lysis buffer at a ratio of 0.1l per 1l of sample elution.
Bioinformatic analysis.A total of 147 B19V genomic sequences (120 of genotype 1, 12 of genotype 2, and 15 of genotype 3) deposited in the NCBI nucleotide database were selected, aligned, and compared using the Clone Manager 9 Professional Edition software (Scientific & Educational Software). These sequences were selected because they encompassed the complete or almost complete (only sequences larger than 4 kb were used) internal region of B19V and are representative of isolates collected at different times and in different locations.
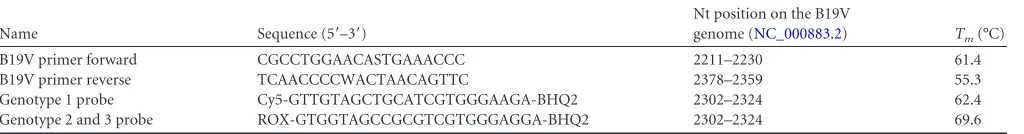
qPCR assay.The qPCR assay has been designed and is reported ac-cording to MIQE guidelines (17). Primers and probes used in the ampli-fication reactions were obtained from Eurofins MWG Operon and are reported inTable 1. Amplification reactions were carried out by using the RotorGene 3000 system (Corbett Research).
Alternative qPCR assay formats were developed. In a basic triplex qPCR assay, the combination of Sybr green and hydrolysis probe technol-ogies was exploited. Reactions were carried out in a 25-l final volume containing 10l of sample eluate, 1⫻QuantiTect PCR Sybr green PCR mix (Qiagen), 0.5M primer pair, and 0.1M of each B19V genotype-specific probe. Amplification of the pEC01 internal control was
per-formed in a separate reaction tube, in the same run. The thermal profile consisted of 15 min at 95°C and 50 cycles of 20 s at 95°C, 40 s at 50°C, with signal acquisition in the Cy5 and ROX channels, 15 s at 72°C, and 15 s at 80°C, with signal acquisition in the 6-carboxyfluorescein (FAM)/Sybr channel. A final melting curve was performed, with thermal profile ramp-ing from 65°C to 95°C at a 12°C/min rate, coupled with continuous signal acquisition in the FAM/Sybr channel. In the derived QuantiFast pathogen PCR assay, reactions were carried out in a 25-l final volume containing 10l of sample eluate, 1⫻QuantiFast pathogen master mix (Qiagen), 0.5
M primer pair, and 0.1M of each B19V genotype-specific probe, 1⫻ internal control assay. The thermal profile consisted of 5 min at 95°C and then 50 cycles of 15 s at 95°C and 30 s at 60°C, with signal acquisition in the Cy5, 5-carboxy-X-rhodamine (ROX), and 6-carboxy-4=,5= -dichloro-2=,7=-dimethoxyfluorescein (JOE) channels.
Fluorescence data analysis.Fluorescence data were collected at dif-ferent temperatures and in the difdif-ferent channels depending on the qPCR detection format and were analyzed by using the functions available in the RotorGene 6.0 software. Quantification cycles (Cq) were defined by set-ting the fluorescence threshold at 0.1 relative units. Quantification of viral DNA was obtained by the absolute quantification method, for the differ-ent acquisition channels.
For the triplex qPCR assay, analysis at 80°C in the FAM/Sybr channel allowed for the simultaneous detection of all B19V variants, while viral genotyping of genotype 1 and genotypes 2 and 3 was carried out at 50°C in the Cy5 and ROX channels, respectively. The pEC01 internal control, amplified in a separate tube, was quantified by analyzing fluorescence data collected in the FAM/Sybr channel. Melting analysis was carried out for the FAM/Sybr channel to define the melting profile and the melting tem-perature (Tm) of the products. In preliminary experiments, specific accu-mulation of amplicons was also confirmed by agarose gel electrophoretic analysis. For the QuantiFast pathogen qPCR assay, all reporter dyes were acquired at the end of the annealing step: genotype 1 in the Cy5 channel, genotypes 2 and 3 in the ROX channel, and the internal control in the JOE channel.
Data analysis.Data analysis was carried out by GraphPad Prism 5.0 software (GraphPad Software, Inc.). Calibration curves were generated by linear regression analysis on Cq values versus log IU of standards.
Data were analyzed by 2-by-2 contingency tables and Bland-Altman analysis. Agreement between methodologies was measured by Cohen’s kappa statistics ().
RESULTS
Experimental design.Sequence variability within the B19V spe-cies was evaluated in order to design and validate a multiplex, internally controlled qPCR assay for the detection and quantifica-tion of B19V DNA in biological samples. The specific requirement of the test was to detect, differentiate, and quantitate with equal accuracy the different genotypes of B19V. Bioinformatic anal-ysis was conducted on an ample subset of genomic sequences from the NCBI nucleotide database, representative of geno-types 1 to 3 and their subgeno-types, leading to the identification of a suitable target region for amplification and genotyping. The inter-national NIBSC standard panel (NIBSC 99/110), comprising ge-notype 1, gege-notype 2, and gege-notype 3a B19V-positive plasma sam-TABLE 1B19V primer and probe sequences used in the study
Name Sequence (5=–3=)
Nt position on the B19V
genome (NC_000883.2) Tm(°C)
B19V primer forward CGCCTGGAACASTGAAACCC 2211–2230 61.4 B19V primer reverse TCAACCCCWACTAACAGTTC 2378–2359 55.3 Genotype 1 probe Cy5-GTTGTAGCTGCATCGTGGGAAGA-BHQ2 2302–2324 62.4 Genotype 2 and 3 probe ROX-GTGGTAGCCGCGTCGTGGGAGGA-BHQ2 2302–2324 69.6
on May 16, 2020 by guest
http://jcm.asm.org/
[image:2.585.41.553.78.145.2]ples, was used for assay setup and validation. Subsequently, the routine performance of the newly developed qPCR assay was eval-uated by comparison to an established, validated lab-developed qPCR assay, amplifying the same target region but specific for B19V genotype 1 (16).
Bioinformatic analysis.Based on the alignment of selected B19V sequences, three genotype-specific consensus sequences were obtained and subsequently used for an intergenotype align-ment. The region between nucleotide 2211 and 2378 (numbering refers to that used for NCBI accession no.NC_000883.2) was se-lected as the target for amplification and for the design of efficient primers and probes, described inTable 1. Forward and reverse primers able to recognize all genotypes were designed, including only a single base degeneration. Within the amplification target region, discrimination among genotypes was determined by using two different genotype-specific hydrolysis probes, targeting dis-tinctive internal sequences on the amplified product. A sequence-specific oligonucleotide probe was designed for the detection of the genotype 1 product and a consensus oligonucleotide probe for both genotypes 2 and 3.
By using the sequence of the amplicon as a query, a total of 816 hits were detected by BLAST analysis, representative of B19V se-quences encompassing the target amplification region. Because of truncation of reported sequences, 575 included the forward primer, 802 included the reverse primer, and 772 included the genotype 1 or 2 and 3 probe target sequences. In particular, only 14 out of 575 (2.4%) sequences including the forward primer binding site did not include the reverse primer or any probe bind-ing sites. Of these aligned sequences, 12/575 (2.0%) showed a single nucleotide mismatch within the forward primer target se-quence, and of these, 4/575 (0.7%) concerned the pentamer at the 3=end of the primer. Then, 5/802 (0.6%) showed a single nucleo-tide mismatch within the reverse primer target sequence, and only 3/802 (0.4%) concerned the pentamer at the 3=end of the primer. Within the aligned subset of sequences, there were no isolates presenting mismatches on both forward and reverse primer bind-ing sites. Finally, for the probes, while they show selective discrim-ination between genotype 1 and genotypes 2 and 3 based on four nucleotide substitutions, further heterogeneity was observed within genotypes. In particular, for the genotype 1 probe, out of 664 sequences, a T-to-C transversion at nucleotide 2303 was pres-ent in 28 sequences, and an additional 20 sparse substitutions could be traced within the probe sequence. A combined mismatch in both the probe 1 and the forward primer binding sites was observed only in the two isolates representative of genotype 1b. For the genotype 2 and 3 probe, only two sequences out of 108 showed a single mismatch.
Multiplex qPCR assays. Given the choice of primers and probes, reporter dyes were selected as compatible with the pro-posed multiplex qPCR assays. Target-specific, but genotype-inde-pendent, accumulation of amplification products obtained by consensus primers could be monitored by Sybr green fluores-cence. Dual target- and genotype-specific accumulation of ampli-fication products could be monitored by specific hydrolysis probes where genotype 1 probe was labeled with CY5, while the consensus genotype 2 and 3 probe was labeled with ROX. All probes were labeled at the 3=end with a nonfluorescent quencher (black hole quencher 2 [BHQ2]). Such probes could be used in combination with Sybr green without any interference.
For internal control of the whole analytical procedure, fixed
amounts of exogenous targets were added to the sample in the preanalytical phase. Two possibilities were exploited, differing in the use and detection of the internal control. In the first protocol, EC01 target amplification was carried out in parallel reactions, using EC01-specific primers and Sybr green as the detection sys-tem. As an alternative protocol, the highly concentrated internal control DNA supplied by Qiagen was coamplified in the same reactions as B19V targets, and its amplification products, in the absence of Sybr green, were detected by a hydrolysis probe labeled with JOE.
Assay validation.The 1st WHO International Reference Panel for Parvovirus B19 Genotypes for NAT-based assays (NIBSC 09/ 110) was used as a basis for assay setup and then employed to assess and validate the analytical characteristics of the developed assay. For each panel member, serial 1-log dilutions were prepared in reference-negative plasma, from 106IU/ml to 102IU/ml. Each
dilution of each panel member, considered an independent sam-ple, was processed in replicate experimental runs, as specified in the tables, in order to take into account both intra- and interassay variability. For each amplification plot, quantification cycles (Cq) were obtained as an invariant parameter related to amplicon ac-cumulation. For the different assay formats proposed, calibration curves were constructed by linear regression analysis, plotting the Cq values as a function of the defined concentration of NIBSC 09/110 panel members. The specificities of the amplification products and unambiguous genotyping were assessed by melting curve analysis, by theTmdefinition for Sybr green (genotype 1,
Tm⫽83.27⫾0.10°C; genotype 2,Tm⫽84.09⫾0.10°C; genotype
3,Tm⫽84.60⫾0.09°C), and by matched hybridization to the
specific hydrolysis probes.
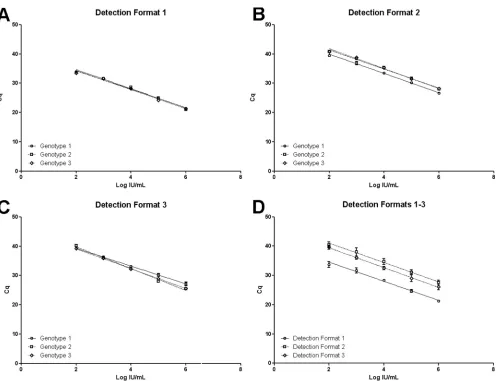
Results of linear regression analysis of calibration curves are reported inTable 2and in graphical form inFig. 1AtoD. Different experimental protocols and related quantification formats were evaluated. The main design of the experimental protocol included a consensus genotype-independent amplification of targets mon-itored by fluorescence due to an intercalating dye (qPCR assay detection format 1) that could be coupled to genotype-specific detection of amplified targets monitored by fluorescence due to hydrolysis probes (qPCR assay detection format 2). In the first instance, B19V-specific, but genotype-independent, accumula-tion of amplificaaccumula-tion products obtained by consensus primers was monitored by Sybr green fluorescence (Fig. 1A). The assay showed linearity in the test range for all genotypes, and calibration curves obtained for the three genotypes did not differ significantly from each other (slope,P⫽0.61; intercept,P⫽0.17). Therefore, a single calibration curve obtained for pooled genotype standards is suitable for exact quantification of any genotype. Then, within the same reactions, B19V genotype-specific accumulation of amplifi-cation products could also be monitored by fluorescence emission linked to hydrolysis probes (Fig. 1B). This allowed direct genotyp-ing of targets, discriminatgenotyp-ing genotype 1 from variant genotype 2 or 3. Furthermore, in this case too, the assay showed linearity in the test range for all genotypes; however, calibration curves showed a nonsignificant difference in slopes (P⫽0.49) coupled to a significant difference in intercept (P⬍0.0001), due to a higher fluorescence of genotype 1-specific probe than of the genotype 2 and 3 probe. In this experimental protocol, the EC01 internal control needed to be amplified in a separate reaction, and its ac-cumulation could be monitored by Sybr green fluorescence. For
on May 16, 2020 by guest
http://jcm.asm.org/
the EC01 internal control target, variation in Cq values was re-corded as a measure of assay performance (Cq⫽27.11⫾0.22).
As an alternative, in the derived experimental protocol em-ploying the QuantiFast reaction mix (qPCR assay detection for-mat 3), B19V genotype-specific accumulation of amplification products was monitored only by fluorescence emission linked to hydrolysis probes (Fig. 1C), and again calibration curves showed linear correlations in the test range. However, curves differed sig-nificantly from each other (slope,P⬍0.0001), so quantification for each genotype needed to be carried out on each respective curve. In this assay format, according to kit instructions, the in-ternal control was coamplified in the same amplification reaction with viral targets. This did not lead to any measurable competitive interfering effect, and its accumulation could be monitored by JOE fluorescence from a specific probe as a measure of assay per-formance (Cq⫽25.63⫾0.18).
Finally, when considering all standard samples independently from genotypes, all assay formats yielded linear correlations in the test range (Fig. 1D). Calibration curves did not show significant differences between the slopes (P⫽0.48) but did show significant differences in the intercepts (P⬍0.0001), showing equal sensitiv-ity but imposing the need for offset calibration depending on the detection format. The 95% limit of detection (LOD) of the assay, independently of the detection format, was calculated as 2.30 log IU/ml (2⫻102IU/ml).
Assay on clinical specimens.A total of 130 consecutive serum samples sent to the laboratory with a specific request of B19V PCR were analyzed with the newly developed qPCR assay, and results were compared to a reference assay (16). For each test run, a 103
IU/ml genotype 1 standard (NIBSC 99/802) was included as a
reference sample. Of the 130 samples, 126 showed concordant results (31 positive and 97 negative), while 4 showed discordant results (2 positive in the reference qPCR and negative in the newly developed assay, and 2 showing the opposite). All positive samples were genotype 1 (Table 3).
Comparison was first carried out between data obtained from the Sybr green channel, for both the reference and the new qPCR assay. The quantitative evaluation of B19V targets was carried out by interpolation of Cq values on the calibration curve obtained for pooled genotypes, in the assay validation for qPCR assay detection format 1 (slope⫽ ⫺3.268, intercept⫽41.10), directly imported in the software quantification algorithm. The mean quantitative value of the 103IU/ml reference sample was 1.2⫻103⫾0.8⫻103
IU/ml, in agreement with data obtained in the assay validation. For clinical samples, the new qPCR assay showed a sensitivity of 93.94% and a specificity of 97.94%, with an overall agreement rate of 96.92% ( ⫽0.919) with respect to the previously established assay (Table 3). The four discordant samples all showed a viral load below 3⫻102IU/ml. Quantitative data of the concordant
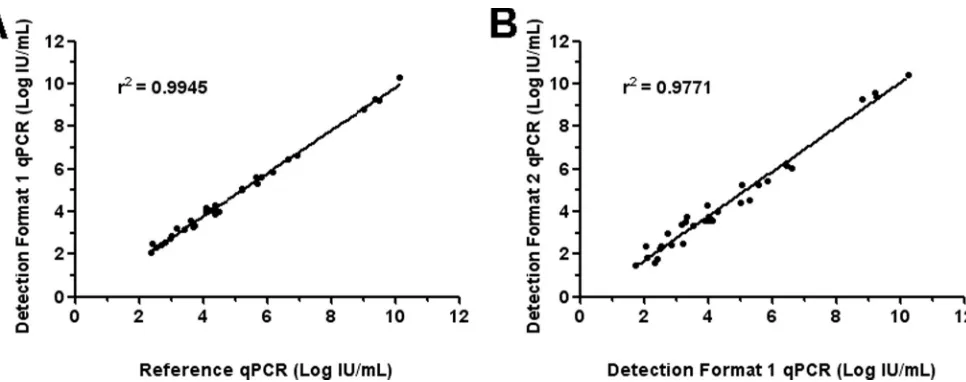
positive samples were correlated (Fig. 2A), and anr2coefficient of
correlation of 0.995 was obtained. The Bland-Altman analysis in-dicated that differences for each pair of quantitative results were within 0.5 log, demonstrating the accurate quantification perfor-mance of the triplex qPCR assay Sybr green format.
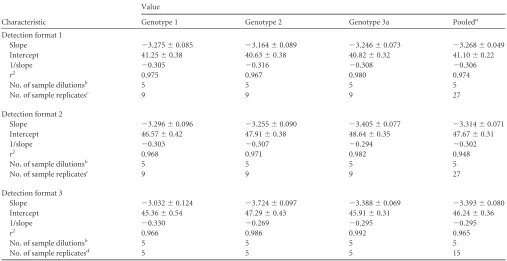
[image:4.585.39.546.78.339.2]Data obtained by genotype-specific hydrolysis probes in detec-tion format 2 were also analyzed. All samples showed concordant results with those of detection format 1, with fluorescent signal present only at the CY5 channel, indicating that all detected tar-gets were B19V genotype 1. These data were further confirmed by TABLE 2Linear regression analysis of calibration curves for the three detection formats of the qPCR assay
Characteristic
Value
Genotype 1 Genotype 2 Genotype 3a Pooleda
Detection format 1
Slope ⫺3.275⫾0.085 ⫺3.164⫾0.089 ⫺3.246⫾0.073 ⫺3.268⫾0.049 Intercept 41.25⫾0.38 40.63⫾0.38 40.82⫾0.32 41.10⫾0.22
1/slope ⫺0.305 ⫺0.316 ⫺0.308 ⫺0.306
r2 0.975 0.967 0.980 0.974
No. of sample dilutionsb 5 5 5 5
No. of sample replicatesc 9 9 9 27
Detection format 2
Slope ⫺3.296⫾0.096 ⫺3.255⫾0.090 ⫺3.405⫾0.077 ⫺3.314⫾0.071 Intercept 46.57⫾0.42 47.91⫾0.38 48.64⫾0.35 47.67⫾0.31
1/slope ⫺0.303 ⫺0.307 ⫺0.294 ⫺0.302
r2 0.968 0.971 0.982 0.948
No. of sample dilutionsb 5 5 5 5
No. of sample replicatesc 9 9 9 27
Detection format 3
Slope ⫺3.032⫾0.124 ⫺3.724⫾0.097 ⫺3.388⫾0.069 ⫺3.393⫾0.080 Intercept 45.36⫾0.54 47.29⫾0.43 45.91⫾0.31 46.24⫾0.36
1/slope ⫺0.330 ⫺0.269 ⫺0.295 ⫺0.295
r2 0.966 0.986 0.992 0.965
No. of sample dilutionsb 5 5 5 5
No. of sample replicatesd 5 5 5 15
aData from all panel members considered independently from genotype.
b
Serial 1-log dilutions of panel members 1 to 3, from 106
IU/ml to 102
IU/ml. cThree replicate samples in three different test runs.
d
Three and two replicate samples in two different test runs.
on May 16, 2020 by guest
http://jcm.asm.org/
theTmof amplified products from serum samples (Tm⫽83.01⫾
0.16°C).
Quantitative results obtained by qPCR assay detection format 1 were plotted against those found with detection format 2 to check the accuracy of B19V genotyping (Fig. 2B). Ther2
coeffi-cient of correlation was 0.977, and differences between pairs of quantitative values were within 0.77 log, as indicated by the Bland-Altman analysis.
DISCUSSION
B19V genetic variability.Parvovirus B19 is a single viral species composed of three separate evolutionary lineages, clustering in three distinct genotypes. In the design of a molecular detection assay for B19V DNA, the choice of appropriate target regions and optimized primers/probes can now take advantage of a well-rep-resented set of viral genomes available from databases, so that alignment of sequences will indicate optimal regions for primer and probe design. In our work, by limiting analysis to complete or almost complete sequence entries from the NCBI database, about 150 sequences were selected for alignment, representative of dif-ferent genotypes and difdif-ferent epidemiological settings in time and location of collection. We assumed a differentiation in geno-types 1a, 1b, 2, 3a, and 3b as a result of previous investigations.
[image:5.585.46.545.61.442.2]For genotype 1a, sequence alignment yields a consistent con-sensus sequence, with a minimal number of conserved polymor-phisms. Strikingly, such a consensus sequence already emerges following alignment of the few first isolates and is not altered by progressively considering more and more recent isolates. If a high rate of mutation is accepted for B19 genome evolution (18,19), FIG 1Calibration curves for the three detection formats of the qPCR assay. Cq values obtained for each different NIBSC 99/110 panel member dilution are plotted against assigned concentrations expressed in log IU/ml. In panels A to C, for the different detection formats, curves are separately obtained for each genotype. In panel D, for the different assay detection formats, curves derive from pooled genotypes.
TABLE 3Comparison of the genotype-specific qPCR and reference qPCR assays, for 130 consecutive clinical samples
Genotype-specific qPCR assay result
No. of samples by reference qPCR assay result
Positive Negative Total
Positive 31 2 33a
Negative 2 95 97
Total 33a 97 130
aAll samples positive by either assay were genotype 1.
on May 16, 2020 by guest
http://jcm.asm.org/
[image:5.585.40.287.635.715.2]this might indicate spreading of diversity from an initial cluster of “founder sequences,” tentatively placed in the 1960s when geno-type 2 could have been replaced by genogeno-type 1 as the prevalent genotype. A continuous evolutionary process of B19V is also sug-gested from recent molecular epidemiological studies utilizing large data sets, indicating that even within genotype 1a, a slow and gradual accumulation of point mutations can give way to period-ical, dynamic replacement of strains with higher sequence diver-gence (20,21). On the whole, the genetic diversity of genotype 1a remains low, and primers and probes are expected to recognize targets with high expectation values. The distance of genotype 1b is about 4% from genotype 1a, but the circulation of this subgeno-type, and of additional rarer variants still within the genotype 1 cluster, seems to be geographically restricted (5,8).
Genotypes 2 and 3 pose different problems. In both cases, fewer genomic sequences are available, the intragenotypic diver-sity is higher, and, although consensus sequences can be obtained, their consistency is lower than for genotype 1, and it may be ex-pected that the addition of further sequences may bring to evi-dence additional diversity. Furthermore, genotype 2 is considered an older genotype, likely to be frequently present as part of the human persistent virome (bioportfolio) (22) but infrequently found as circulating virus. Genotype 3 is a circulating virus that can be prevalent in defined geographic settings (8,9). Their higher sequence divergence may pose diagnostic challenges, and primers and probes may recognize targets with lower expectation values (23,24).
Genotype-specific qPCR assay design. All these consider-ations led us to a hypothesis in the design of primers and probes for a molecular amplification assay. First, alignment of sequences allowed the definition of consensus sequences for each genotype; thereafter, alignment of the three consensus sequences yielded a whole-species consensus that was used to define positions of primers and probes. As a rationale, a target region was defined, conserved enough to be amplified by consensus primers with equal efficiency for all genotypes but encompassing specific signa-ture sequences, allowing distinction among genotypes by means of specific probes. In fact, a conserved region corresponding to the
central exon of the B19 genome possessed these characteristics. Inclusion of a single degenerated base in each of the primers en-sured matching to all genotypes and subtypes. Within this target region, a signature sequence offered the possibility to differentiate between genotype 1, on the one side, and variant genotypes on the other. Further discrimination between genotypes 2 and 3 might then be obtained by evaluation ofTmvalues and possibly
con-firmed by sequencing of amplification products. Any choice of primers and probes does not, however, exclude the possibility of mismatches to individual clinical isolates, causing impaired an-nealing and leading to underestimation or misdetection of targets. For our assay, single-base mismatches are present either on one of the primer binding sites or on the probe binding site, at a fre-quency lower than 1%.
Genotype-specific qPCR assay validation. The alternative qPCR protocols developed, each with robust performance, may allow choice with respect to operational systems and diagnostic requirements. Genotype-independent detection of B19V DNA by means of Sybr green may be an alternative to genotype-specific detection by means of hydrolysis probes, and the two detection formats may be successfully combined, maintaining equal sensi-tivity and specificity of the assay. This scheme guarantees both a high flexibility in the detection of newly emerging variants with possible additional sequence heterogeneity and a specific identifi-cation of prototype or variant genotypes. Detection of an internal reaction control, essential for routine clinical applications, needs to be carried out in a parallel amplification in a Sybr green-based detection format; otherwise, it can be coamplified and detected by a specific hydrolysis probe in the absence of Sybr green. Analytical performances of the designed molecular assay in the different de-tection formats have been analyzed according to standardized guidelines for harmonization in analytical assays. The availability of an international panel of standard reference material allowed the initial setup of the assay and then the construction and evalu-ation of quantitative calibrevalu-ation curves for assay validevalu-ation. The results obtained indicate that our assay ensures a validated and robust detection and quantitative determination of B19 nucleic acid targets in biological specimens.
FIG 2Correlation between quantitative results for concordant B19V-positive samples. (A) Log IU/ml determined by qPCR assay format 1 is plotted against log IU/ml determined by the reference qPCR (16); (B) log IU/ml determined by qPCR assay format 2 is plotted against log IU/ml determined by qPCR assay format 1.
on May 16, 2020 by guest
http://jcm.asm.org/
[image:6.585.54.537.64.255.2]Epidemiological and clinical relevance.The prototype geno-type 1 is the main circulating virus in all areas of the world (9). Indeed, in all clinical samples analyzed in our study and collected for two consecutive months, in two different years, positivity was confined to genotype 1, confirming its prevalent circulation in our area in accordance with the known epidemiological behavior of B19V in Europe and the United States. However, the advantage to perform B19V detection with a validated qPCR methodology able to discriminate and quantitate different genotypes derives from two considerations. First, variant genotypes are known to circu-late at higher frequencies in areas other than Europe or the United States, and in addition the changing demographic and epidemio-logical scenario will probably lead to a more global circulation of genotype 3 (5,6,8,9). Second, a reliable viral diagnosis should be able to detect variant genotypes even in particular sporadic clinical situations when standard assays, focused on genotype 1, may fail in B19V detection (7,10,23,24).
Modern diagnostic laboratories rely mainly on commercially available, validated diagnostic assays. However, diagnostic kits also need to face problems due to target heterogeneity, and for B19V some reports and proficiency panel evaluations suggest that qPCR assays may not always obtain uniform analytical perfor-mances (7,25–27). On the other hand, the in-house development of molecular assays will need a high degree of conformity to ana-lytical guidelines and validation procedures to ensure reliable re-sults. Our proposed molecular assay, able to accurately detect and quantitate different genotypes, might be useful in this respect, widening the availability of B19V-specific PCR detection to an ample number of laboratories and contributing to a reliable diag-nostic service and epidemiological surveillance of B19 virus.
ACKNOWLEDGMENTS
The technical support of Lorena Mezzofanti and Marinella Plazzi (S.Orsola-Malpighi Hospital, Microbiology Unit) is gratefully acknowl-edged.
REFERENCES
1.Gallinella G.2013. Parvovirus B19 achievements and challenges. ISRN Virol. doi:10.5402/2013/898730.
2.King A, Lefkowitz E, Adams M, Carstens E (ed).2011. Ninth report of the International Committee on Taxonomy of Viruses. Elsevier, New York, NY.
3.Gallinella G, Venturoli S, Manaresi E, Musiani M, Zerbini M.2003. B19 virus genome diversity: epidemiological and clinical correlations. J. Clin. Virol.28:1–13.
4.Servant A, Laperche S, Lallemand F, Marinho V, De Saint Maur G, Meritet JF, Garbarg-Chenon A.2002. Genetic diversity within human erythroviruses: identification of three genotypes. J. Virol.76:9124 –9134. 5.Toan NL, Duechting A, Kremsner PG, Song le H, Ebinger M, Aberle S, Binh VQ, Duy DN, Torresi J, Kandolf R, Bock CT.2006. Phylogenetic analysis of human parvovirus B19, indicating two subgroups of genotype 1 in Vietnamese patients. J. Gen. Virol.87:2941–2949.
6.Parsyan A, Szmaragd C, Allain JP, Candotti D.2007. Identification and genetic diversity of two human parvovirus B19 genotype 3 subtypes. J. Gen. Virol.88:428 – 431.
7.Cohen BJ, Gandhi J, Clewley JP.2006. Genetic variants of parvovirus B19 identified in the United Kingdom: implications for diagnostic testing. J. Clin. Virol.36:152–155.
8.Corcoran C, Hardie D, Yeats J, Smuts H. 2010. Genetic variants of human parvovirus B19 in South Africa: cocirculation of three genotypes and identification of a novel subtype of genotype 1. J. Clin. Microbiol.
48:137–142.
9.Hubschen JM, Mihneva Z, Mentis AF, Schneider F, Aboudy Y, Gross-man Z, Rudich H, Kasymbekova K, Sarv I, Nedeljkovic J, Tahita MC, Tarnagda Z, Ouedraogo JB, Gerasimova AG, Moskaleva TN,
Tik-honova NT, Chitadze N, Forbi JC, Faneye AO, Otegbayo JA, Charpen-tier E, Muller CP.2009. Phylogenetic analysis of human parvovirus B19 sequences from eleven different countries confirms the predominance of genotype 1 and suggests the spread of genotype 3b. J. Clin. Microbiol.
47:3735–3738.
10. Liefeldt L, Plentz A, Klempa B, Kershaw O, Endres AS, Raab U, Neumayer HH, Meisel H, Modrow S.2005. Recurrent high level parvo-virus B19/genotype 2 viremia in a renal transplant recipient analyzed by real-time PCR for simultaneous detection of genotypes 1 to 3. J. Med. Virol.75:161–169.
11. Ekman A, Hokynar K, Kakkola L, Kantola K, Hedman L, Bonden H, Gessner M, Aberham C, Norja P, Miettinen S, Hedman K, Soderlund-Venermo M.2007. Biological and immunological relations among hu-man parvovirus B19 genotypes 1 to 3. J. Virol.81:6927– 6935.
12. Modrow S, Wenzel JJ, Schimanski S, Schwarzbeck J, Rothe U, Olden-burg J, Jilg W, Eis-Hubinger AM.2011. Prevalence of nucleic acid se-quences specific for human parvoviruses, hepatitis A and hepatitis E vi-ruses in coagulation factor concentrates. Vox Sang.100:351–358. 13. Parsyan A, Candotti D.2007. Human erythrovirus B19 and blood
trans-fusion—an update. Transfus. Med.17:263–278.
14. Baylis SA.2008. Standardization of nucleic acid amplification technique (NAT)-based assays for different genotypes of parvovirus B19: a meeting summary. Vox Sang.94:74 – 80.
15. Baylis SA, Ma L, Padley DJ, Heath AB, Yu MW, Collaborative Study Group.2012. Collaborative study to establish a World Health Organiza-tion InternaOrganiza-tional genotype panel for parvovirus B19 DNA nucleic acid amplification technology (NAT)-based assays. Vox Sang.102:204 –211. 16. Gallinella G, Bonvicini F, Filippone C, Delbarba S, Manaresi E, Zerbini
M, Musiani M.2004. Calibrated real-time PCR for evaluation of parvo-virus B19 viral load. Clin. Chem.50:759 –762.
17. Bustin SA, Benes V, Garson JA, Hellemans J, Huggett J, Kubista M, Mueller R, Nolan T, Pfaffl MW, Shipley GL, Vandesompele J, Wittwer CT.2009. The MIQE guidelines: minimum information for publication of quantitative real-time PCR experiments. Clin. Chem.55:611– 622. 18. Norja P, Eis-Hubinger AM, Soderlund-Venermo M, Hedman K,
Sim-monds P.2008. Rapid sequence change and geographical spread of hu-man parvovirus B19: comparison of B19 virus evolution in acute and persistent infections. J. Virol.82:6427– 6433.
19. Shackelton LA, Holmes EC.2006. Phylogenetic evidence for the rapid evolution of human B19 erythrovirus. J. Virol.80:3666 –3669.
20. Molenaar-de Backer MW, Lukashov VV, van Binnendijk RS, Boot HJ, Zaaijer HL.2012. Global co-existence of two evolutionary lineages of parvovirus B19 1a, different in genome-wide synonymous positions. PLoS One7:e43206. doi:10.1371/journal.pone.0043206.
21. Suzuki M, Yoto Y, Ishikawa A, Tsutsumi H.2009. Analysis of nucleotide sequences of human parvovirus B19 genome reveals two different modes of evolution, a gradual alteration and a sudden replacement: a retrospec-tive study in Sapporo, Japan, from 1980 to 2008. J. Virol.83:10975–10980. 22. Norja P, Hokynar K, Aaltonen LM, Chen R, Ranki A, Partio EK, Kiviluoto O, Davidkin I, Leivo T, Eis-Hubinger AM, Schneider B, Fischer HP, Tolba R, Vapalahti O, Vaheri A, Soderlund-Venermo M, Hedman K.2006. Bioportfolio: lifelong persistence of variant and proto-typic erythrovirus DNA genomes in human tissue. Proc. Natl. Acad. Sci. U. S. A.103:7450 –7453.
23. Knoester M, von dem Borne PA, Vossen AC, Kroes AC, Claas EC.2012. Human parvovirus B19 genotype 3 associated with chronic anemia after stem cell transplantation, missed by routine PCR testing. J. Clin. Virol.
54:368 –370.
24. Koppelman MH, Rood IG, Fryer JF, Baylis SA, Cuypers HT. 2007. Parvovirus B19 genotypes 1 and 2 detection with real-time polymerase chain reaction assays. Vox Sang.93:208 –215.
25. Baylis SA, Buchheit KH.2009. A proficiency testing study to evaluate laboratory performance for the detection of different genotypes of parvo-virus B19. Vox Sang.97:13–20.
26. Baylis SA, Shah N, Minor PD.2004. Evaluation of different assays for the detection of parvovirus B19 DNA in human plasma. J. Virol. Methods
121:7–16.
27. Hokynar K, Norja P, Laitinen H, Palomaki P, Garbarg-Chenon A, Ranki A, Hedman K, Soderlund-Venermo M.2004. Detection and dif-ferentiation of human parvovirus variants by commercial quantitative real-time PCR tests. J. Clin. Microbiol.42:2013–2019.