L E T T E R
Open Access
Historically largest geomagnetic sudden
commencement (SC) since 1868
Tohru Araki
Abstract
Being stimulated by the previously reported large amplitude (202 nT at Kakioka) geomagnetic sudden commencement (SC) on 24 March 1991, we searched larger amplitude SCs in the past. We tried to collect old magnetograms and used the list of SC observed at Kakioka (27.5° gm.lat.) for the period 1924 to 2013 and Colaba (10.5°)-Alibag (10.3°) for 1868 to 1967. We found that the largest amplitude SC occurred on 24 March (the same day as 1991 SC), 1940. The H-component amplitude is larger than 273 nT at Kakioka and 310 nT at Alibag. We could also obtain the copy of the magnetogram of Cape Town (−33.3°) which shows 164 nT amplitude. The statistical analysis shows that the occurrence rate of SCs is less than 5% for amplitude larger than 50 nT and less than 1% for amplitude larger than 100 nT at both Kakioka and Alibag. Large amplitude SCs tend to occur during the declining phase of the solar activity. Finally, we discussed the possible increase of the dynamic pressure associated with the interplanetary shock causing the largest SC.
Keywords:Geomagnetic sudden commencement (SC); Solar activity; Largest SC; Interplanetary shock
Introduction
An anomalous geomagnetic sudden commencement (SC) occurred at 03:41 UT on 24 March 1991. It was character-ized by a large and short duration (1 to 2 min) magnetic pulse in the very initial stage of the SC which propagated from the day side to the night side (Araki et al. 1997). The H-component amplitude and rise time were measured as 202 nT and 28 s, respectively, by 1-s sampled values of Kakioka (27.5° gm. lat.) near 12-h LT. Since SCs with amp-litude larger than 100 nT is rare (less than 1% as shown later) at Kakioka and the rise time is mostly 3 to 4 min (Maeda et al. 1962), the amplitude of this pulse is anomal-ously large and the rise time is anomalanomal-ously short. One-minute routine geomagnetic observations could not re-solve accurately such a rapid variation.
It was the largest in the list of the SSC (storm sudden commencement) after IGY (1957 to 1958) prepared by Kakioka observatory. In the separate list of the SI (sud-den impulse) which is also provided by Kakioka, there was a larger SI with 220 nT amplitude that occurred on 13 November 1960. The 24 March 1991 SC, therefore, is the second largest among SSCs and SIs observed at Kakioka
after IGY. The term SC used here includes both SSC and SI.
The CRRES satellite observed this anomalous SC at 2.6 Re geocentric distance and 2.5-h LT near the equa-torial plane (Blake et al. 1992, and Wygant et al. 1994). It detected a large magnetic pulse of about 130 nT ampli-tude and an associated bipolar electric pulse of the peak-to-peak amplitude of about 80 mV/m. It also observed a drift echo event of high-energy charged particles which were locally accelerated and appeared periodically with the drift period. This means instantaneous formation of the inner radiation belt. The high-energy electron data of EXOS-D (Akebono) satellite indicated that this radiation belt lasted more than 1 year (Yukimatsu et al. 1994).
The source of this SC is presumed to be a solar flare which occurred at 22:47 UT on 22 March 1991 (Blake et al. 1992). The flare effect was transmitted to the earth in about 29 h.
A computer simulation by Li et al. (1993) shows that a propagating electromagnetic pulse due to a sudden mag-netospheric compression at 15-h LT accelerated magneto-spheric charged particles to form the inner radiation belt. Although it is interesting to see the corresponding solar wind variations near earth, no data were available in the interplanetary space. Ulysses detected large disturbances
Correspondence:[email protected]
Polar Research Institute of China, Shanghai, China
of the coronal mass ejection at 2.5 AU from the sun and 60° east of Earth in ecliptic longitude (Phillips et al. 1992), but it was difficult to find the variation corresponding to the 24 March storm at Earth.
This SC provided a rare chance to study the particle acceleration mechanism due to sudden magnetospheric compressions and the theoretical analyses have been continued afterward (e.g., Gannon et al. 2005). The high time variation rate of this SC is interesting also as a space weather event. Large amplitude SCs are also important to study the possible maximum limit of the interplanetary shock strength.
From these points of view, it is worth studying that larger amplitude SCs occurred in the past. Here, we re-port the results of our survey of the largest amplitude SC since 1868.
Data analysis
Being stimulated by the 24 March 1991 SC described above, we surveyed all normal-run magnetograms accu-mulated at Kakioka observatory for the period 1924 to 1957 and found the largest amplitude SC which occurred on 24 March (the same day as the 1991 SC) 1940. Kakioka reported that the amplitude was larger than 273 nT. We could also obtain the magnetogram copy of the day at Alibag (10.3° gm. lat.) which shows the similar time variation with Kakioka. The amplitude was registered as 310 nT.
Microfilm copies of old magnetograms before IGY (1957 to 1958) had been collected by National Geophys-ical Data Center (NGDC), NOAA, Boulder but once they were sent to the Denver Office of National Archive and Record Agency (NARA), and they were totally lost there accidentally. It was a great loss in geomagnetism. It becomes difficult to study old geomagnetic events.
We asked copies of the original magnetograms to the WDC for Geomagnetism, in Copenhagen, Edinburgh, and Kyoto, and Institut de Physique du Globe de Paris. Al-though we could obtain data of several stations, most of them were not clear to identify the SC because it occurred during a severe geomagnetic storm triggered by a preced-ing SC. A few printed magnetograms were available, how-ever, in published data books (stored in NGDC) of Cape Town (−33.3° gm. lat.), Greenwich (53.3°), and Niemeg (51.7°). The record of Cape Town was clear, showing the time variation similar to that of Kakioka and Alibag.
The magnetograms of Kakioka, Alibag, and Cape Town are shown in Figure 1. The record of Cape Town seems to be manually traced and deformed when it was copied from the data book and so the accurate measurement of the amplitude was difficult. Noisy dark spots were deleted from all magnetograms.
In Figure 1, two successive SCs occurred around 13:48 UT and 15:38 UT on 24 March 1940. The H-component
amplitude of the first SC was 73 nT and 59 nT at Kakioka and Alibag, respectively. The onset of the SC was not clear at Cape Town. A typical magnetic storm developed after the first SC. The initial phase lasted for about 1 h and then the second SC with larger amplitude occurred during the beginning part of the main phase. The amplitude of the second SC was 310 nT at Alibag and larger than 273 nT at Kakioka as mentioned above. We measured 164 nT ampli-tude from the magnetogram copy of Cape Town.
The H-component of all three stations rapidly decreases after the second SC. It suggests that the IMF was strongly southward when the second SC occurred and the ring current development was accelerated after the second SC. It is faster in the afternoon side (Alibag and Cape Town) than the night side (Kakioka). The geomagnetic field was
Figure 1Geomagnetic records of 24 March 1940 SC event. (a)
highly disturbed during the main phase after the SC and severe space weather events occurred which disturbed telegraph communication lines. LIFE Magazine (1940) reported ‘Spots on the face of the sun mess up Earth’s communications’. This storm was described as one of the largest geomagnetic storms since 1859 (Cliver and Svalgaard 2004).
It is said that a large solar flare of importance occurred around 11:30 UT on 23 March 1940 (Newton 1940). If this is the source of the geomagnetic storm under con-sideration, the time for transit to the earth is about 28 h. It is very near to the transit time, 29 h for the 24 March 1991 SC.
Now, Kakioka observatory provides the list of SSC (in-cluding SI after IGY) for the period from 1924 to the present but it does not include the second SC because SCs occurring during preceding magnetic storms are registered as SI according to the rule of Kakioka. The amplitude (>273 nT) of the second SC was found in the list of the principal magnetic storm prepared separately by Kakioka observatory.
Mayaud (1973) compiled a list of SSC for 100 years after 1868. He classified geomagnetic stations into two groups, Tropical stations and North-South stations. The main station of the former is Colaba-Alibag, India, and Batavia (−16.1° gm. lat.), Indonesia and nearby stations are used as the secondary stations. The geomagnetic ob-servation at Colaba (10.5°) in the south part of Bombay (present Mumbai) city moved to the outskirts, Alibag, in the beginning of the twentieth century when the electric
railway was constructed in Bombay. European stations in the geomagnetic latitude range of 49° to 53°, Kew, Saint-Mauer, Val Joyeux, and Chambon-la Foret, were used for the North stations and Melbourne and Toolangi were used for South primary stations. Christchurch, Amberly, and Watherroo were the secondary South stations. The geomagnetic latitude of these South stations is between −40° and −46°. The list shows the amplitude of SCs at Tropical station (AT) and North-South station (ANS) but there is no AT data for 1868 to 1870. The two SSC lists described above register 1,805 SCs at Kakioka for 1924 to 2013 and 2,307 SCs at Colaba-Alibag for 1871 to 1967, respectively.
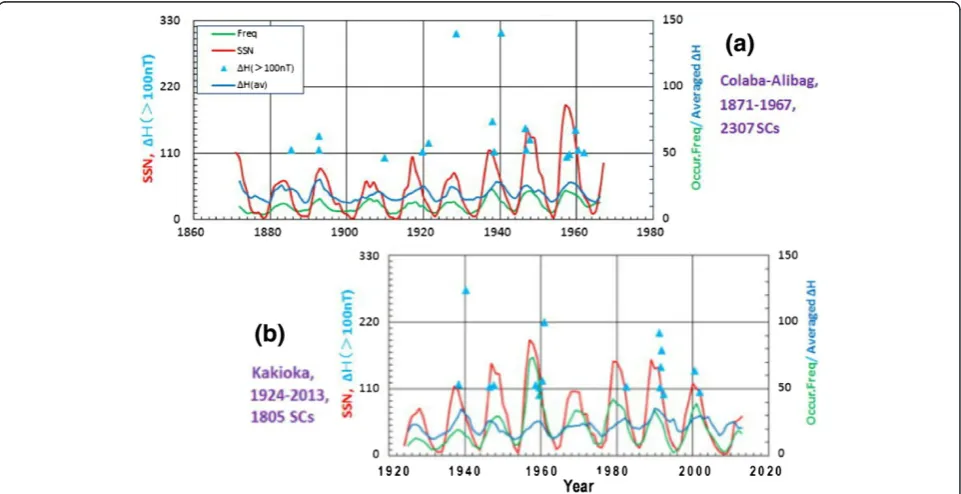
The annual variations of the 3-year running averages of the occurrence frequency and amplitude of SCs are shown together with the averaged sunspot number (SSN) in Figure 2. The upper left panel (a) is for Colaba-Alibag and the lower right panel (b) is for Kakioka. Large SCs with amplitude larger than 100 nT are also plotted by blue triangles. Number of these large SCs was 18 and 19 for Colaba-Alibag and for Kakioka, respectively.
Figure 2 shows that the SC of 24 March 1940 is the largest at both Colaba-Alibag and Kakioka. There is the second largest SC in the plot for Colaba-Alibag which occurred on 7 July 1928. The amplitude AT is 308 nT but ANS is 235 nT which is much smaller than 1,161 nT for 24 March 1940 SC. Also, the corresponding amp-litude at Kakioka is only 8 nT. We consider, therefore, that 7 July 1928 event is not so large on a global scale but is locally enhanced near Alibag. The third and fourth
largest SC in the Mayaud list occurred on 16 January 1938 and 26 July 1946 with the amplitude [AT, ANS] = [163, 129] and [151, 100] nT, respectively. The ANS amp-litude, 1,161 nT, of the 1940 SC is the largest ANS among all 2,307 SCs in the list. This amplitude is extremely large compared with the SCs below the second rank. The sec-ond and third largest ANS are 249 nT (9 September 1909) and 246 nT (22 September 1946), respectively.
The Mayaud list did not give the AT values at all for the period 1868 to 1870 when the amplitude ANS were given to 86 SCs. Also, there is no AT value of 18 SCs out of 75 SCs registered by ANS for 1871 and 1872. The ANS of the total of 104 (=86 + 18) SCs with no AT data, however, is less than 89 nT and then we presume that SCs with AT larger than 100 nT did not occur in the period 1868 to 1872. The AT values of 29 SCs are taken from Batavia but the maximum is 61 nT. On the basis of these considerations, we concluded that the SC on 24 March 1940 is largest since 1868.
From Figure 2, we can also see that large amplitude SCs tend to occur in the maximum or declining phase of the sunspot cycle. This tendency is similar to the an-nual variation of large magnetic storms. Mayaud (1975) analyzed yearly variations of the amplitude and occurrence frequency of SC but he did not pay special attention to large amplitude SCs.
Watari (2012, private communication) defined the nor-malized sunspot phase (NSSP) where the period of each sunspot cycle is normalized to 11 years. The phase of the maximum sunspot number is 4.3 year which was deter-mined as the statistical average. Figure 3 shows the NSSP dependence of the amplitude of SCs larger than 50 nT at Kakioka. From this figure, we can say that SCs with ampli-tude larger than 100 nT occur during the SSN phase 3 to 7. The three SCs larger than 150 nT were observed in the declining phase 6 to 7.
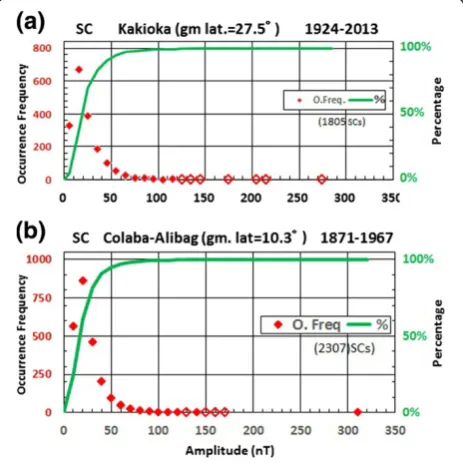
In Figure 4, the occurrence frequency of the SC ampli-tude is plotted in each 10 nT bin together with the cu-mulative percentage. The open red diamonds indicate occurrence of only one SC in a 10 nT bin. Figure 4 tells us that the SC amplitude is mostly 10 to 30 nT at both Kakioka and Colaba-Alibag. The ratio of SCs with ampli-tude larger than 50 nT is 4.6% at Kakioka and 4.7% at Colaba-Alibag. The percentage of SCs larger than 100 nT is less than 1% at both stations. We can recognize again that the amplitude of 24 March 1940 SC was ex-tremely large.
Discussions
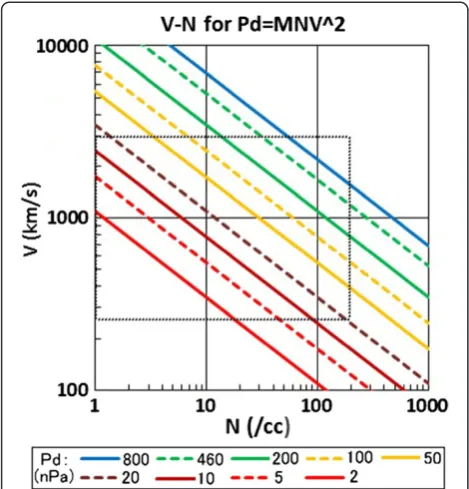
Siscoe et al. (1968) assumed a linear relationship, ΔH=C Δ(Pd^0.5) between the SC amplitude (ΔH) and the jump of the square root of the solar wind dynamic pressure (Pd), and determined experimentally the linear coefficient, C. After them, several values have been proposed forCwhich are summarized in Araki et al. (1993). The coefficient actu-ally given byC=αkfwhereαdenotes effects of the electric currents induced in the earth,kindicates direct Pd effects, andfis determined by the manner of interaction between the solar wind and the magnetosphere (usually taken as 1). Usually,αis taken as 1.5 which means that the SC ampli-tude is enhanced 1.5 times on the ground by the induced earth currents. We assume here thatC=15 nT/(nPa)^0.5 as the most appropriate value. If 2 nPa is taken as the initial Pd, the SC amplitude 300 nT needs increase of Pd to 457 nPa. Figure 5 shows the calculated relation-ship between the solar wind density (N) and velocity (V)
Figure 3Amplitude of SC larger than 50 nT at Kakioka versus the normalized sunspot phase (NSSP).The size of the circle of the data point is proportional to the sunspot number.
for several values ofPd=MNV^2 where M is the mass of positive ions of the solar wind.
Siscoe et al. (1968) assumed existence of 4% helium ions in the solar wind which leads to the equivalent mass, M=1.16 Mp where Mp is the proton mass. They also converted the observed upstream dynamic pressure to that at the stagnation point of the magnetopause multiplying the coefficient [(γ+1)/2]^[(γ+1/(γ−1)] (γ)^ [−γ/(γ+1)] where γis the ratio of the specific heat. The coefficient is 0.881 for γ= 5/3 and the final expression for the dynamic pressure becomes Pd=1.02 MpNVs^2. Here, we use the simple expression, Pd=MpNVs^2. Numerically it is almost same as the expression of Siscoe et al (1968).
The dotted rectangle in Figure 5 indicates an area bounded by N=200/cc,V=250 km/s, and 3,000 km/s. The values, 200/cc and 3,000 km/s, are assumed as the possible maximum values forNandV, respectively (Cliver et al. 1990; Tsurutani et al. 2003; Russell et al. 2013).
Table 1 indicates sets of (N,V) which give 460 nPa (green dashed line in Figure 5). We consider that (N,V) = (50/cc, 2,348 km/s) and (100/cc,1,660 km/s) forPd=460 nPacan be accepted as possible extreme cases.
If the non-linear effect is taken into account, however, the Pd jump larger than what is required from the linear relationship above will be needed. On the other hand, the effect of the current induced in the earth might re-quire a smaller Pd jump because larger amplitude SCs have higher time variation rate (Araki et al. 2004) and so the coefficientαfor the induction effect might be larger than the usual value 1.5. Takeuchi et al. (2002) showed the relationship between the SC rise time and solar wind parameters. It is difficult to judge which of these two competing processes is dominant but we consider that the estimation above for the Pd jump could be accepted as the first-order approximation.
Although the amplitude of SCs shows a clear depend-ence on local time and latitude (Araki et al. 2006, 2009; Shinbori et al. 2009), the previous papers did not pay at-tention to it in the selection of SC events to calculate the coefficient C. We need to check this point for more detailed analysis.
Competing interests
The authors declare that they have no competing interests.
Acknowledgments
Many people contributed to searching old magnetograms of the event studied here. The author would like to acknowledge Joe H. Allen, S. McLean, H. Coffey, and J. Mabie of the NGDC, NOAA, M. Alex of the Indian Institute of Geomagnetism, J. Bitterly of the Institut de Physique du Globe de Paris, T. Clark of the British Geological Survey, S. Tsunomura of the Kakioka Geomagnetic Observatory, WDC for Geomagnetism, Copenhagen and WDC for Geomagnetism, Kyoto. Especially, Joe Allen and S. McLean came to the NARA Denver office with the author to check old magnetograms. Joe Allen also took him to the warehouse of NGDC for the search of the data. J. Mabie found the data book of Cape Town which includes the printed magnetogram used effectively in this analysis. This work was carried out using the archived data for nearly 100 years from the Kakioka and Colaba-Alibag Observatories. The author appreciates efforts of both observatories to maintain the continuous geomagnetic observation. The useful comments from the reviewers of this paper are highly acknowledged.
Received: 26 September 2014 Accepted: 27 November 2014
References
Araki T, Funato K, Iguchi T, Kamei T (1993) Direct detection of solar wind dynamic pressure effect on ground geomagnetic field. Geophys Res Lett 20:775–778
Araki T, Fujitani S, Emoto M, Yumoto K, Shiokawa K, Ichinose T, Luehr H, Orr D, Milling D, Singer H, Rostoker G, Tsunomura S, Yamada Y, Liu CF (1997) Anomalous sudden commencement on March 24, 1991. J Geophys Res 102(A7):4075–4086
Araki T, Takeuchi T, Araki Y (2004) Rise time of geomagnetic sudden
commencements—statistical analysis of ground geomagnetic data—. Earth Planets Space 56:289–293
Araki T, Keika K, Kamei T, Yang H, Alex M (2006) Nighttime enhancement of the amplitude of geomagnetic sudden commencements and its dependence on IMF-Bz. Earth Planets Space 58:45–50
Araki T, Tsunomura S, Kikuch T (2009) Local time variation of the amplitude of geomagnetic sudden commencements (SC) and SC-associated polar cap potential. Earth Planets Space 61:e13–e16
Blake JB, Kolasinski WA, Fillus RW, Mullen EG (1992) Injection of electrons and protons with energies of tens of Mev into L < 3 on 24 March 1991. Geophys Res Lett 19:821–824
Cliver EW, Svalgaard L (2004) The 1859 solar-terrestrial disturbance and the current limits of extreme space weather activity. Sol Phys 224:407–422
Figure 5Relationship of N and V of the solar wind for constant Pd=MNV^2. The dotted rectangle indicates a region of (N, V) which might be actually observed.
Table 1 Solar wind density (N) and velocity (V) which give the dynamic pressure Pd = 460 nPa
N (/cc) 10 50 100 200 300
Cliver EW, Feynman J, Garret HB (1990) An estimate of the maximum speed of the solar wind, 1938–1989. J Geophys Res 95(A10):17103–17112 Gannon JL, Li X, Temerin M (2005) Parametric study of shock-induced transport
and energization of relativistic electrons in the magnetosphere. J Geophys Res 110:A12206, doi:10.1029/2004JA010679, 200
Li X, Roth I, Temerin M, Wygant JR, Hudson MK, Blake JB (1993) Simulation of the prompt energization and transport of radiation belt particles during the March 24, 1991 SSC. Geophys Res Lett 20:2423–2426
LIFE Magazine (1940) 8(15):38, April 8
Maeda H, Sakurai K, Ondoh T, Yamamoto M (1962) Solar terrestrial relationships during the IGY and IGC. Ann Geophys 18:305–333
Mayaud PN (1973) A hundred year series of geomagnetic data 1868–1967. IAGA Bulletin No.33
Mayaud PN (1975) Analysis of storm sudden commencements for the years 1868–1967. J Geophys Res 80:111–122
Newton HW (1940) The active solar and magnetic period 1940 March 20 to April, 2. Observatory 63:129–134
Phillips S, Bame J, Gosling JT, McComas DJ, Goldstein BE, Smith EJ, Balogh A, Forsyth RJ (1992) ULYSSES plasma observation of coronal mass ejections near 2.5 AU. Geophys Res Lett 19:1239–1342
Russell CT, Mewaldt RA, Luhmann JG, Mason GM, von Rosenvinge TT, Cohen CMS, Leske RA, Gomez-Herrero R, Klassen A, Galvin AB, Simunac KD (2013) The very unusual interplanetary coronal mass ejection of 2012 July 23: a blast wave mediated by solar energetic particles. Astrophys J 770:38
(5 pp), 10.1088/0004-637X/770/1/38
Shinbori A, Tsuji Y, Kikuchi T, Araki T, Watari S (2009) Magnetic latitude and local time dependence of the amplitude of geomagnetic sudden
commencements. J Geophys Res 114:A04217, doi:10.1029/2008JA013871 Siscoe GL, Formisano V, Lazarus AJ (1968) Relation between geomagnetic
sudden impulses and solar wind pressure changes: an experimental investigation. J Geophys Res 73:4869–4874
Takeuchi T, Russell CT, Araki T (2002) Effect of the orientation of interplanetary shock on the geomagnetic sudden commencement. J Geophys Res 107 (A12):1423, doi:10.1029/2002JA009597
Tsurutani BT, Gonzalez WD, Lakhina GS, Alex S (2003) The extreme magnetic storm of 1–2 September 1859. J Geophys Res 108(A7):1268,
doi:10.1029/2002JA009504
Wygant J, Mozer RF, Blake JB, Maynard N, Singer H, Smiddy M (1994) Large amplitude electric and magnetic field signature in the inner magnetosphere during injection of 15 Mev electron drift echoes. Geophys Res Lett 21:1739–1742
Yukimatsu AS, Ejiri M, Takagi S, Terasawa T, Kohno T, Makino M (1994) Structural variation of radiation belt associated with solar flare and SC event observed by radiation monitor (RDM) aboard Akebono (EXOS-D). In: Proceeding of eighth international symposium on solar terrestrial physics. Sci. Comm. of Solar Terr. Phys, Sendai, Japan, p P150
doi:10.1186/s40623-014-0164-0
Cite this article as:Araki:Historically largest geomagnetic sudden commencement (SC) since 1868.Earth, Planets and Space201466:164.
Submit your manuscript to a
journal and benefi t from:
7Convenient online submission
7Rigorous peer review
7Immediate publication on acceptance
7Open access: articles freely available online 7High visibility within the fi eld
7Retaining the copyright to your article