Copyright©2005 by the Genetics Society of America DOI: 10.1534/genetics.104.037523
Lineage-Specific Loss of Function of Bitter Taste Receptor Genes
in Humans and Nonhuman Primates
Yasuhiro Go,*
,1Yoko Satta,* Osamu Takenaka
†,2and Naoyuki Takahata*
*Department of Biosystems Science, Graduate University for Advanced Studies (Sokendai), Hayama, Kanagawa 240-0193, Japan and†Primate Research Institute, Kyoto University, Inuyama, Aichi 484-8506, Japan
Manuscript received October 15, 2004 Accepted for publication January 28, 2005
ABSTRACT
Since the process of becoming dead genes or pseudogenes (pseudogenization) is irreversible and can occur rather rapidly under certain environmental circumstances, it is one plausible determinant for characterizing species specificity. To test this evolutionary hypothesis, we analyzed the tempo and mode of duplication and pseudogenization of bitter taste receptor (T2R) genes in humans as well as in 12 nonhuman primates. The results show that primates have accumulated more pseudogenes than mice after their separation from the common ancestor and that lineage-specific pseudogenization becomes more conspicuous in humans than in nonhuman primates. Although positive selection has operated on some amino acids in
extracellular domains, functional constraints against T2Rgenes are more relaxed in primates than in
mice and this trend has culminated in the rapid deterioration of the bitter-tasting capability in humans. Since T2R molecules play an important role in avoiding generally bitter toxic and harmful substances,
substantial modification of theT2Rgene repertoire is likely to reflect different responses to changes in
the environment and to result from species-specific food preference during primate evolution.
N
O doubt, organisms have increasingly acquired new (Adleret al. 2000;Chandrashekaret al. 2000; Matsu-nami et al. 2000). Unfortunately, however, the corre-genes by tandem duplication and/orpolyploidi-zation (Ohno 1970). However, as evolution has pro- spondence between bitter substances (ligands) and re-ceptors is poorly known. One exception is one of the ceeded, loss of genes has also occurred whenever they
became dispensable under certain circumstances of in- human T2Rgenes, which is proven to be responsible for perception of phenylthiocarbamide (Kimet al. 2003). terplay between genes and their environments. In
ani-mals, nutrition that is ingested daily from surroundings Both T1R and T2R have seven transmembrane do-mains as a common character of GPCRs. Despite this must have been one of the most important
environmen-tal factors and must have permitted genes involved in structural similarity, these two molecules exhibit no ob-vious amino acid sequence similarities. Rather, T1R and vitamin C biosynthesis (Nishikimiet al. 1994) and
essen-tial amino acid biosynthesis (Lehninger1996) to be non- T2R are closely related to the pheromone receptors V2R and V1R, respectively (MatsunamiandAmrein2003). functional. A similar phenomenon may be found in
genes for the sense of taste since tasting plays a crucial T2R genes form a larger multigene family than T1R genes. In contrast to the presence of only 3T1Rgenes role in providing animals with information about proper
assessments of foods and appropriate behaviors. Mam- in the mammalian genome (Nelson et al. 2001;Li et al. 2002),⬎30T2Rgenes exist (Conteet al. 2003;Shi mals can basically sense tastes of sweet, sour, bitterness,
salt, and umami (the taste of monosodium glutamate). et al. 2003). The recent chicken genome project ( Hill-ieret al. 2004) ascertained that theT2Rgene repertoire Of these five modalities, sweet, bitter, and umami
sub-stances are perceived by G-protein-coupled receptor had expanded in the ancestral mammalian lineage after its divergence from reptiles/birds and that the capacity (GPCR) signaling pathways (Wong et al. 1996). Two
GPCR families are involved in these pathways: One is for sensing bitter substances has broadened in mammals T1R, which is associated with sweet and umami sub- relative to chickens, which possess only 3 T2R genes. stances (Nelson et al. 2001; Li et al. 2002), and the Between mammalian orders such as humans and mice, other is T2R, which is associated with bitter substances the orthologous relationships ofT2Rgenes are found to be either one to one or one to multiple (Conte et al. 2003; Shiet al. 2003). Since the one-to-multiple
Sequence data from this article have been deposited with the EMBL/ orthology has resulted from lineage-specific gene
dupli-GenBank Data Libraries under accession nos. AB198983–AB199308. cation, the T2R gene family has continuously under-1Corresponding author:Department of Biosystems Science, Graduate
gone gene duplication even after the mammalian
radia-University for Advanced Studies (Sokendai), Hayama, Kanagawa
240-tion. It is also known that the human and mouseT2R 0193, Japan. E-mail: [email protected]
2Deceased. gene families contain eight and three pseudogenes,
314 Y. Goet al.
30 sec, and 68⬚for 30 sec with an additional extension at 68⬚
spectively (Conte et al. 2003;Shiet al. 2003). The
ab-for 5 min. PCR products were electrophoresed using 1.5%
sence of orthologous pseudogenes between humans
agarose gel and purified by the QIAquick gel extraction kit
and mice immediately indicates that pseudogenization (QIAGEN, Chatsworth, CA). PCR products were directly se-[the process of becoming pseudogenes by disrupting quenced or sequenced after cloning (Zero Blunt TOPO PCR
cloning kit, QIAGEN).
intact open reading frames (ORFs)] ofT2Rgenes
oc-Data analysis: Sequences were aligned by CLUSTAL_X
curred independently in mammalian lineages. Since
(Thompsonet al. 1997) and the resulting alignment was
manu-pseudogenization can occur rather rapidly under
cer-ally adjusted. Codon positions specified in this study
corre-tain circumstances, we can regard it as one possible spond to those in the alignedT2Rsequences, in which the determinant for characterizing species specificity. This numbering starts at the first codon ofHosa-T2R39.
Phyloge-netic trees were reconstructed by the neighbor-joining (NJ)
view was actually exemplified by the olfactory receptor
(SaitouandNei1987) and/or maximum parsimony (Fitch
(OR) gene (Gilad et al. 2003, 2004) and pheromone
1971; Hartigan 1973) methods implemented in MEGA2
receptor (VR) gene families (ZhangandWebb2003).
(Kumaret al. 2001). In the NJ trees, thepdistances for
nucleo-In these families, more pseudogenes have accumulated tide or amino acid sequences were used to infer the topology in hominoids and Old World monkeys (OWMs) than (SaitouandNei1987). To examine whether natural selection
has been exerted on individual amino acids, the computer
in other mammals and it has been argued that the
program of DataMonkey (http://www.datamonkey.org/) was
transition from smell or pheromone dependency to full
used (Kosakovsky Pond and Frost 2005). This program
trichromatic color vision dependency in their life might
involves five steps. First, to obtain a reliable estimate of the
have relaxed functional constraints againstORandVR number of substitutions occurred at a single amino acid site, genes (Giladet al. 2003, 2004;ZhangandWebb2003). a nucleotide substitution model fitted to the data was selected
by the likelihood ratio test and/or Akaike information criteria
Because of important roles of T2R in avoiding
gener-score. Second, to obtain ancestral sequences, a codon-based
ally bitter, toxic, and harmful substances, changes in the
substitution model fitted to the data was selected using the T2Rgene repertoire could in turn affect the behavior of
maximum-likelihood method with the MG94 model (Museand
animals, especially the feeding behavior. Here, to gain Gaut1994). Third, the average numbers of synonymous (E S) insights into evolutionary changes in theT2Rgene rep- and nonsynonymous (EN) sites in a particular phylogenic tree
for each codon were computed, as inSuzukiandGojobori
ertoire, we have conducted a comparative analysis ofT2R
(1999), by considering the nucleotide substitution biases
esti-genes among humans, nonhuman primates, tupais, and
mated from the data. Fourth, the total numbers of synonymous
mice. We show that lineage-specific gene duplication
(NS) and nonsynonymous (NN) substitutions throughout the
and pseudogenization played important roles in altering phylogenetic tree were counted for each codon site. Finally, theT2Rgene repertoire in individual primates. we tested whether the number of nonsynonymous
substitu-tions per nonsynonymous site (dN; NN/EN) is significantly
different from the number of synonymous substitutions per
synonymous site (dS; NS/ES) using the extended binominal
MATERIALS AND METHODS
distribution. In addition, to estimate the numbers of per-site
synonymous substitutions (bS) and per-site nonsynonymous
Sources of DNA samples :Genomic DNAs used here were
substitutions (bN) for each branch of a given tree, the
com-for the chimpanzee (Pan troglodytes; Patr), the gorilla (Gorilla
puter program Bn-Bs (Zhanget al. 1998) was used.
gorilla; Gogo), the orangutan (Pongo pygmaeus; Popy), the agile gibbon (Hylobates agilis; Hyag), the rhesus monkey (Macaca mulatta; Mamu), the silvered leaf monkey (Trachypithecus
crista-RESULTS tus; Trcr), the white-tufted-ear marmoset (Callithrix jacchus;
Caja), the brown capuchin (Cebus apella; Ceap), the
thick-Comparative analysis ofT2Rgenes between humans
tailed bush baby (Otolemur crassicaudatus; Otcr), the Senegal
and mice :Previous studies identified 33–ⵑ34T2Rgenes
galago (Galago senegalensis; Gase), the slow loris (Nycticebus
in humans and 36–ⵑ40 in mice (Conteet al. 2002, 2003;
coucang; Nyco), the ring-tailed lemur (Lemur catta; Leca), and
the common tree shrew (Tupaia glis; Tugl). These DNAs were Shi et al. 2003). We reexamined T2R genes for the
generously provided by Primate Research Institute, Kyoto Uni- human (NCBI; Build 34 Version 2) and the mouse
versity. Genomic DNAs for human (Homo sapiens; Hosa)
popu-(NCBI; Build 32 Version 1) genome sequences by
lations were purchased from Coriell (Camden, NJ).
BLASTN and TBLASTN with all annotated human and
PCR amplification and sequencing:Genomic PCR was
per-mouse T2R genes as queries. These database searches
formed with the polymerase KOD-Plus under conditions
rec-ommended by the manufacturer (TOYOBO). Because allT2R identified 1 additional mouseT2Rpseudogene (mt2r37*;
genes are intronless andⵑ900 bp in size, the nucleotide se- an asterisk indicates a pseudogene), so that there are 41
quences of the entire coding region were obtained by single paralogous genes in mice, including 6 pseudogenes. In
PCR. The first primer sets for PCR were designed for each
humans, on the other hand, 25T2Rfunctional genes and
T2Rcoding region to amplify ORFs as long as possible. For
11 pseudogenes were confirmed. Among 11 pseudogenes,
some closely relatedT2R genes, degenerated primers were
designed. In case of failure of amplification by the first primer 6 were already identified in bothConteet al. (2002) and
sets, other primer sets were designed for conserved regions Shi et al. (2003) and the remaining 5 by one of these
between human and mouse T2R homologous genes. The studies. The proportion ofT2Rpseudogenes is 31% (11/
primer sequences are available in supplemental Table 1 at
36) in humans and 15% (6/41) in mice (Table 1).
http://www.genetics.org/supplemental/. Amplifications were
The NJ tree was reconstructed on the basis of amino
carried out under the following standard conditions:
315 Bitter Taste Receptor Genes in Primates
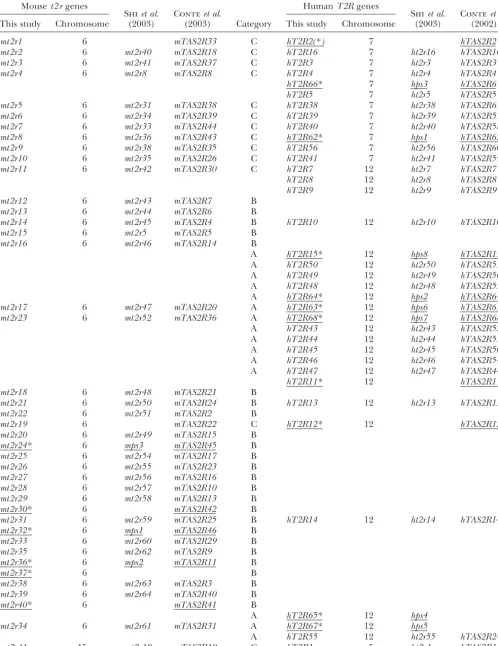
TABLE 1
Nomenclature of the mouset2 rgenes and their human orthologous genes
Mouset2 rgenes HumanT2Rgenes
Shiet al. Conteet al. Shiet al. Conteet al.
This study Chromosome (2003) (2003) Category This study Chromosome (2003) (2002)
mt2r1 6 mTAS2R33 C hT2R2(*) 7 hTAS2R2
mt2r2 6 mt2r40 mTAS2R18 C hT2R16 7 ht2r16 hTAS2R16
mt2r3 6 mt2r41 mTAS2R37 C hT2R3 7 ht2r3 hTAS2R3
mt2r4 6 mt2r8 mTAS2R8 C hT2R4 7 ht2r4 hTAS2R4
hT2R66* 7 hps3 hTAS2R6
hT2R5 7 ht2r5 hTAS2R5
mt2r5 6 mt2r31 mTAS2R38 C hT2R38 7 ht2r38 hTAS2R61
mt2r6 6 mt2r34 mTAS2R39 C hT2R39 7 ht2r39 hTAS2R57
mt2r7 6 mt2r33 mTAS2R44 C hT2R40 7 ht2r40 hTAS2R58
mt2r8 6 mt2r36 mTAS2R43 C hT2R62* 7 hps1 hTAS2R62
mt2r9 6 mt2r38 mTAS2R35 C hT2R56 7 ht2r56 hTAS2R60
mt2r10 6 mt2r35 mTAS2R26 C hT2R41 7 ht2r41 hTAS2R59
mt2r11 6 mt2r42 mTAS2R30 C hT2R7 12 ht2r7 hTAS2R7
hT2R8 12 ht2r8 hTAS2R8
hT2R9 12 ht2r9 hTAS2R9
mt2r12 6 mt2r43 mTAS2R7 B
mt2r13 6 mt2r44 mTAS2R6 B
mt2r14 6 mt2r45 mTAS2R4 B hT2R10 12 ht2r10 hTAS2R10
mt2r15 6 mt2r5 mTAS2R5 B
mt2r16 6 mt2r46 mTAS2R14 B
A hT2R15* 12 hps8 hTAS2R15
A hT2R50 12 ht2r50 hTAS2R51
A hT2R49 12 ht2r49 hTAS2R56
A hT2R48 12 ht2r48 hTAS2R55
A hT2R64* 12 hps2 hTAS2R64
mt2r17 6 mt2r47 mTAS2R20 A hT2R63* 12 hps6 hTAS2R63
mt2r23 6 mt2r52 mTAS2R36 A hT2R68* 12 hps7 hTAS2R68
A hT2R43 12 ht2r43 hTAS2R52
A hT2R44 12 ht2r44 hTAS2R53
A hT2R45 12 ht2r45 hTAS2R50
A hT2R46 12 ht2r46 hTAS2R54
A hT2R47 12 ht2r47 hTAS2R44
hT2R11* 12 hTAS2R11
mt2r18 6 mt2r48 mTAS2R21 B
mt2r21 6 mt2r50 mTAS2R24 B hT2R13 12 ht2r13 hTAS2R13
mt2r22 6 mt2r51 mTAS2R2 B
mt2r19 6 mTAS2R22 C hT2R12* 12 hTAS2R12
mt2r20 6 mt2r49 mTAS2R15 B
mt2r24* 6 mps3 mTAS2R45 B
mt2r25 6 mt2r54 mTAS2R17 B
mt2r26 6 mt2r55 mTAS2R23 B
mt2r27 6 mt2r56 mTAS2R16 B
mt2r28 6 mt2r57 mTAS2R10 B
mt2r29 6 mt2r58 mTAS2R13 B
mt2r30* 6 mTAS2R42 B
mt2r31 6 mt2r59 mTAS2R25 B hT2R14 12 ht2r14 hTAS2R14
mt2r32* 6 mps1 mTAS2R46 B
mt2r33 6 mt2r60 mTAS2R29 B
mt2r35 6 mt2r62 mTAS2R9 B
mt2r36* 6 mps2 mTAS2R11 B
mt2r37* 6 B
mt2r38 6 mt2r63 mTAS2R3 B
mt2r39 6 mt2r64 mTAS2R40 B
mt2r40* 6 mTAS2R41 B
A hT2R65* 12 hps4
mt2r34 6 mt2r61 mTAS2R31 A hT2R67* 12 hps5
A hT2R55 12 ht2r55 hTAS2R24
mt2r41 15 mt2r19 mTAS2R19 C hT2R1 5 ht2r1 hTAS2R1
316 Y. Goet al.
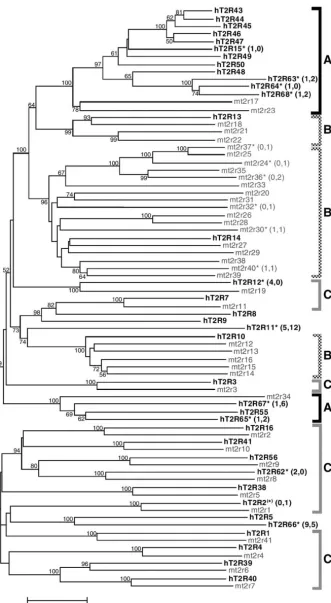
Figure1.—Phylogenetic tree of bitter
taste receptor (T2R) genes based on
amino acid sequences. Genes in humans and mice are shown as solid and shaded, respectively. The tree was reconstructed
by the NJ method (Saitou and Nei
1987) on the basis of thepdistances, and
only⬎50% bootstrap values are shown at
each node (1000 replications). Pseu-dogenes in this study are defined by the presence of ORF disruptive mutations and are indicated by asterisks (*). The codon frames in pseudogenes are in-ferred from those of closely related func-tional genes. The nomenclature of
hu-man T2R genes is the same as that in
Conteet al. (2002) andShiet al. (2003). However, because of the different desig-nation systems of the mouse genes used
by two research groups (Conte et al.
2002, 2003;Shiet al. 2003), we have
re-named the mouse genes. Detailed no-menclatures in humans and mice are in Table 1. The numbers in parentheses stand for those of nonsense and indel mutations, respectively. The definitions of categories A, B, and C are given in the text.
(Figure 1) and the evolutionary relationships between tion, there is a group of 12 human genes with two mouse orthologs. For convenience, this group also is classified human and mouseT2Rgenes can be divided into three
categories with respect to their orthology (Table 1). In into category A. In category B, a single human gene is orthologous to a group of mouse genes (one-to-multiple category A, a group of three human genes is orthologous
one-317 Bitter Taste Receptor Genes in Primates
to-one orthologous relationships are found in 13 gene example. There are twohT2R10orthologs in slow loris (Nyco) and three in bush babies (Otcr) as well as five pairs and these are classified into category C (one-to-one
orthology). Five uncategorized human genes (hT2R5, in mice, whereas there is only onehT2R10ortholog in nonhuman anthropoidea (Table 2). Duplicability at this hT2R8,hT2R9,hT2R11*, andhT2R66*) remain due to
the absence of their counterparts in mice. Among 11 locus in prosimians appears to be as high as in mice. In category A, on the other hand, the T2R43 group human pseudogenes, 6 (hT2R15*,hT2R64*,hT2R63*,
hT2R68*,hT2R65*, andhT2R67*) occur in the 15 cate- (T2R15, -43–50, -63, -64, -68) experienced at least 19 duplications in anthropoidea (data not shown). This gory A genes, none in the three category B genes, 3
(hT2R2*, hT2R62*, and hT2R12*) in the 13 category extensive duplication is in contrast to the case of mice in which only one gene duplication produced mt2r17 C genes, and 2 (hT2R66* andhT2R11*) in the 5
uncate-gorized genes. On the other hand, all 6 mouse pseu- and mt2r23, collectively orthologous to the primate T2R43 group (Figures 1 and 2).
dogenes (mt2r24*,mt2r30*,mt2r32*,mt2r36*,mt2r37*,
and mt2r40*) are found in the 25 category B genes; Pseudogenization of T2R genes : To determine a branch in the phylogenetic tree of primateT2Rgenes none exist in the 3 category A genes and 13 category
C genes. along which a particular gene was disrupted, we
parsi-moniously placed nonsense mutations as well as
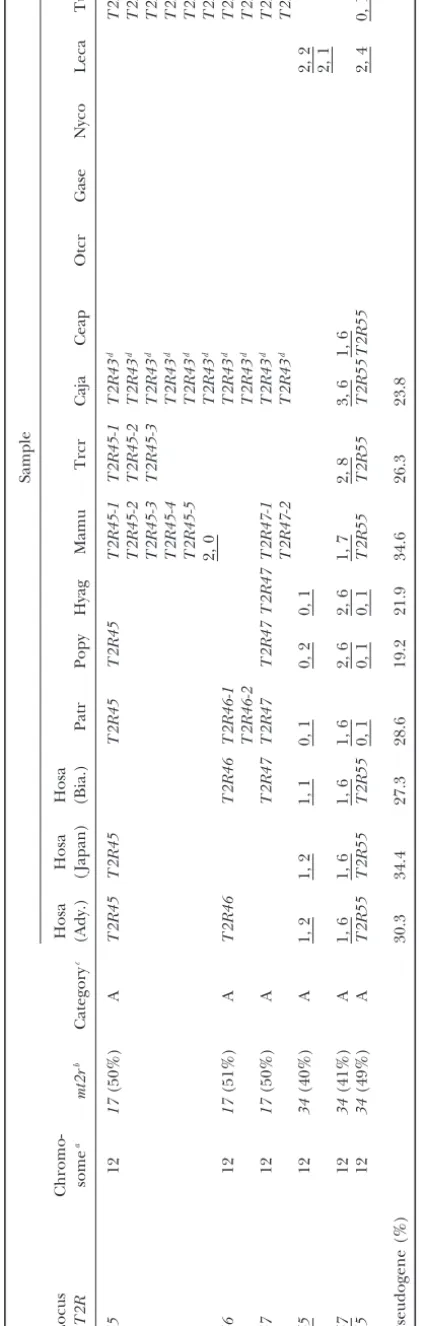
inser-PrimateT2Rgenes:To elucidate theT2Rgene
reper-toire in primates, we amplified 348 genes for three hu- tions and/or deletions (indels) that can cause frameshift mutations (Figure 2). Because there are no shared pseu-mans [Adygei (Eastern European), Japanese (Asian),
Biaka (African Pygmies)], 12 nonhuman primates, and dogenes between humans and mice, no disruptive muta-tion was placed in the common ancestral lineage. Among tupais by means of the PCR technique [33 genes from
Hosa (Adygei); 32, Hosa ( Japanese); 33, Hosa (Biaka); primates, shared disruptive mutations result in eight pseu-dogenes common to more than one species (Figure 36, Patr; 29, Gogo; 29, Popy; 26, Hyag; 35, Mamu; 26,
Trcr; 20, Caja; 21, Ceap; 7, Otcr; 4, Gase; 5, Nyco; 8, Leca; 2). T2R66is an example of the pseudogenization that predated the divergence between anthropoidea and and 4, Tugl]. The length of these amplified sequences
ranges from 707 to 960 bp with the average beingⵑ840 prosimians. The remaining 23 disruptive mutations oc-cur on terminal branches and result in lineage-specific bp. As expected, the number of successfully amplified
genes decreases in species distantly related to humans pseudogenes: 5 in prosimians and tupais, and 18 in anthropoidea (see below).
(such as prosimians and tupais) and this reduction is
most likely due to mutations in the primer-attached Species-specific changes regarding pseudogenization:
Of 23 lineage-specific pseudogenes, 3 (hT2R62*,hT2R2*, sites. Among anthropoidea [hominoids, OWMs, and
New World monkeys (NWMs)] in which at least 20 genes andhT2R64*) are confined in humans (Figure 3). In hT2R62*, there are two nonsense mutations (CAG→ were obtained for each species, there are no significant
differences in the proportion ofT2Rpseudogenes (Ta- TAG at codon position 235 and GAA → TAA at 292). Since both of these mutations are fixed in the sample ble 2, but see later results about differential rates of
pseu-dogenization). However, the proportion differs greatly from 17 human populations (Figure 3A) and since the chimpanzee ortholog is functional,T2R62 in humans among the three categories of orthologous
relation-ships. There are 46 pseudogenes among 115 genes in must have been inactivated long ago, but after the diver-gence between humans and chimpanzees. On the other category A, none among 29 genes in category B, and
18 among 125 genes in category C. Fisher’s exact test hand, hT2R2* was produced relatively recently. It was previously annotated as a pseudogene owing to a two-among pairs of categorized genes shows the preferential
occurrence of pseudogenes in category A (P⬍0.001), base deletion at codon position 160 (Conteet al. 2002; Shi et al. 2003). However, since we found the intact or pseudogenes are statistically more abundant in
cate-gory A genes with extra copies than in catecate-gory B or form in Adygei (Eastern European), Mbuti (African Pyg-mies), and Biaka (African Pygmies) (Figure 3B), the C genes without extra copies. Nonetheless, it is worth
keeping in mind that in primates, pseudogenization is hT2R2locus is actually polymorphic in terms of the two-base deletion. Regarding hT2R64*, there is one fixed not a rare event in genes without extra copies (category
C genes). nonsense mutation of TGG →TGA at codon position
280. It is interesting to note that the orangutan ortholog To infer the evolutionary history of primate T2R
genes, the NJ tree was again reconstructed on the basis (Popy-T2R64*) also suffers a nonsense mutation of TGG→TGA, but at codon position 49 (Figure 3C). of amino acid sequences of all available primate and
mouse sequences (Figure 2). Since none of the primates The remaining 19 lineage-specific pseudogenes are as follows: Patr (1), Gogo (2), Popy (1), Hyag (2), Mamu have extra copies of category C genes, duplicability (the
ability of loci to be duplicated) appears to be unchanged (2), Trcr (3), Caja (2), Ceap (1), Otcr (1), Leca (2), and Tugl (2). This observation indicates that all anthro-throughout the primate and mouse lineages. By
con-trast, duplicability in category A and B genes differs poidea used in this study (Hosa, Patr, Gogo, Popy, Hyag, Mamu, Trcr, Caja, and Ceap) have their own pseudogenes. not only between primates and mice, but also within
319 Bitter Taste Receptor Genes in Primates
320 Y. Goet al.
Figure2.—Phylogenetic tree of 305T2Rgenes based on amino acid sequences in primates and mice. Genes used are from hominoids (blue), OWMs (red), NWMs (green), prosimians (yellow), tupais (gray), and mice (black). The NJ tree is reconstructed
by using thep distances. The numbers in boldface type correspond to those in the locus designation system for humanT2R
genes. Pseudogenes are indicated by asterisks (*). Nonsense (red crosses) and indel (blue crosses) mutations responsible for pseudogenization are placed along branches. The definitions of categories A, B, and C are the same as in Figure 1.
lineage leading to humans. Two fixed and one polymor- particular gene occurred several times independently in different species. Like T2R64 mentioned above, phic pseudogene in humans arose within 6 million years
(MY) after the divergence from chimpanzees, whereas T2R55is disrupted independently in prosimians, tupais, and four apes (chimpanzees, gorillas, orangutans, and 15 pseudogenes in nonhuman anthropoidea arose in a
total of 117 MY (seeGoodman et al. 1998 and Figure agile gibbons), T2R39 in two apes (orangutans and agile gibbons), two OWMs (rhesus monkeys and silvered 4). The rate of pseudogenization is thus significantly
different between humans and nonhuman anthro- leaf monkeys), and one NWM (marmosets), T2R9 in gorillas and marmosets, andT2R10in bush babies and poidea (Fisher’s exact test; P ⬍ 0.05, one-tailed). It is
be-321 Bitter Taste Receptor Genes in Primates
Figure3.—Partial alignments of the nucleotide sequences of primateT2Rgenes. Dots show the same nucleotides as those in the top sequence, which were retrieved from GenBank. Both asterisks and shaded boxes show the location of mutations that
impair intact ORFs. (A)T2R62is pseudogenized by two nonsense mutations (CAG→TAG at codon position 235 and GAA→
TAA at 292). (B)T2R2is polymorphic in terms of a two-base deletion at codon position 160 in human populations. Only Adygei
(from Eastern Europe), Biaka, and Mbuti Pygmies (both from Africa) possess the intact genes, while the deletion is found in all sequences collected from 10 other human populations (Karitiana, Surui, Waorani Indians from South America, Russians from Eastern Europe, Druze from the Middle East, Atayal, Chinese, Japanese from Eastern Asia, and Khmers and Melanesians
from Southeast Asia) and from GenBank resources. (C)T2R64is a human-specific pseudogene (TGG→TGA at 280). This
gene also became a pseudogene in the orangutan through an independent nonsense mutation (TGG→ TGA at 49). (D)
Independent mutations disruptT2R55in the four apes: chimpanzees (five-base deletion at 172–173), gorillas (one-base insertion
at 271), orangutans (one-base deletion at 303), and gibbons (two-base deletion at 103); in the prosimians: ring-tailed lemurs (two one-base deletions at 43 and 227, two-base deletion at 116, one-base insertion at 271, and two nonsense mutations at 90 and 236); and in the tupai: common tree shrews (one-base insertion at 66).
came nonfunctional by a single nonsense mutation in the lated the difference of dN ⫺ dS codon by codon (see
materials and methods) for 150 undisrupted sequences
common ancestral lineage between humans and
chimpan-zees as well as by independent indel mutations in rhesus from primates and mice. To reduce sampling errors in this analysis, we excluded any codon that is absent in monkeys and silvered leaf monkeys (Figure 2).
Selection for and against functional domains ofT2R more than half the sequences (⬎75). Figure 5 shows
that codons withdN⬎dSare abundant in ECs whereas
genes:We examined whether differential selective
pres-sure has been acting on different domains of primate codons withdN⬍dSpredominate in TMs⫹ICs. Fisher’s exact test (P⬍0.01) also shows that positively selected functionalT2Rgenes. T2R molecules consist of three
domains: transmembrane (TMs), intracellular (ICs), amino acids (dN ⬎ dS) are much more frequently ob-served in ECs (15 of 84 sites) than in TMs⫹ ICs (8 of and extracellular (ECs) (Adleret al. 2000). To evaluate
322 Y. Goet al.
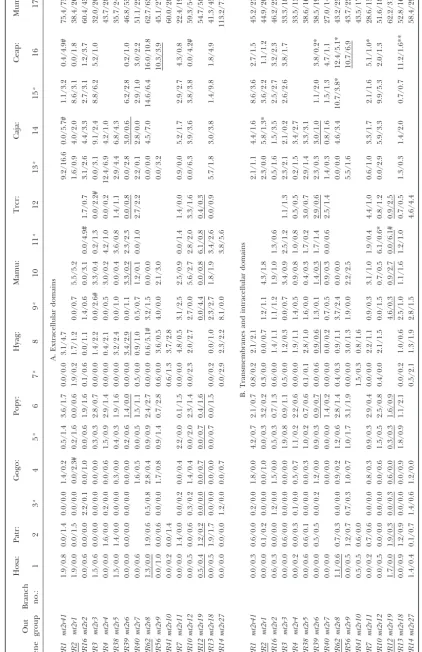
ing to branch numbers from 1 to 16 in Table 3) and for 1 branch leading from the common node of primates to mice (corresponding to branch number 17 in Table 3). Among 272 possible comparisons of branches and genes in primates and mice, 227 pairs of thebSandbNvalues were obtained because of lack of sequences for some genes in some species. These comparisons were made separately for ECs (Table 3A) and TMs ⫹ ICs (Table 3B). For the primate EC comparisons, 8 show that bN is significantly larger thanbS(bN⬎bS), whereas for the 16 mouse comparisons, none showbN⬎ bSbut two ex-hibitbS⬎bN. The ratio ofbNtobSin ECs averaged over all T2R genes is 0.94 in primates and 0.79 in mice. Although positive selection contributed to these rela-tively high ratios, relaxation of selective constraints in
Figure4.—The rate of pseudogenization in humans and
primates appears to be a more important factor. To test
nonhuman anthropoidea. Each cross on a terminal branch
shows species-specific pseudogenization. The divergence this conjecture, we compared the ratios in TMs ⫹ICs
times (MY) represented above each branch are fromGood- between primates and mice. There is only 1 withbN⬎
man et al. (1998). While three human-specific pseudogenes b
Sand 7 withbS⬎bNin the primate comparisons, whereas
have arisen within 6 MY, 15 (1⫹2⫹2⫹2⫹2⫹3⫹2⫹1)
all 16 showbS ⬎ bN in the mouse comparisons. There
pseudogenes in nonhuman anthropoidea have accumulated
is thus little evidence for positive selection in TMs ⫹
within 117 MY (6 ⫹7⫹ 14⫹ 18⫹14 ⫹14 ⫹22⫹ 22).
Pseudogenization that occurred along internodal branches ICs and the average ratio ofbNtobSis 0.57 in primates
(dashed lines) is excluded from consideration. and 0.47 in mice. More importantly, since the increased
amount of the ratio is similar in both domains, it is likely that primate T2R genes in categories B and C human and mouseT2Rgenes). Thus, some amino acid underwent relaxed negative selection rather than rein-changes in ECs are selected for and most amino acid forced positive selection compared with the mouse or-changes in TMs⫹ICs are selected against. thologs.
Lineage-dependent selection onT2Rgenes:It is also Likewise, we examined thebSandbNvalues in primate
intriguing to examine how concordantly or discordantly category A genes for comparison. Figure 6 contrasts the selection operates between the primate and mouse lin- bSandbNvalues between categories A and C as well as eages. We used 16T2R genes in category B and C to between domains EC and TM⫹IC. In both domains, analyze theirbSandbNvalues (seematerials and meth- the bN value tends to be higher in category A than in category C irrespective of thebSvalue. The Mann-Whitney ods) for 16 branches leading to primates
(correspond-Figure5.—The extent of positive and negative selection on individual codons. Schematic positions of three functional
domains of the T2R gene (ECs, TMs,
and ICs) are shown on thex-axis. The
value above and below thex-axis,
respec-tively, indicates an excess and deficiency in the number of per-site
nonsynony-mous substitutions (dN) over per-site
syn-onymous ones (dS) in an individual
co-don. The zero value means dN ⫽ dS.
Asterisks (*) show significant positive
se-lection (P ⬍ 0.05) based on the
323 Bitter Taste Receptor Genes in Primates
324 Y. Goet al.
generally difficult to discern the complete repertoire of other chemosensory receptor genes in mammals. In the case of olfactory receptor (OR) genes, this difficulty is due mainly to the fact that they form an exceptionally large multigene family (856 genes in humans, 1404 in mice, and 971 in dogs according to the HORDE data-base at http://bip.weizmann.ac.il/HORDE/). On the other hand, the number of T2R genes is moderately small and suspected to be at mostⵑ40 in the mamma-lian genome. This fact has facilitated our study to dis-cern the great majority of theT2Rgene repertoire in anthropoidea. Indeed, for each nonhuman anthropoid we have identified at least 20 genes that are orthologous to 36 humanT2Rgenes (Table 2).
In OR genes, hominoids (especially humans) and OWMs have a higher proportion of pseudogenes than do NWMs or lemurs (Gilad et al. 2003, 2004), and in pheromone receptor (VR) genes, hominoids and OWMs are thought to have completely lost the functional genes
(Zhangand Webb2003). By contrast, among
anthro-poidea there are no significant differences in the pro-portion of the T2Rpseudogenes, which suggests that the tempo and mode of pseudogenization in T2R is different from that inORandVR.
In primates, many more pseudogenes have accumu-lated in category A (46 pseudogenes of 115 genes) than in category B (0 of 29) and in category C (18 of 125) (Fisher’s exact test;P⬍0.001). In mice, all pseudogenes are restricted to category B and absent in categories A and C. This contrast strongly suggests that the more frequently duplication occurs, the more pseudogenes tend to accumulate. This trend is also evident for prosimians, in which three duplicated T2R10 genes are found and one of them is a pseudogene (Figure 2 and Table 2). It therefore appears that the evolutionary process ofT2R genes exemplifies the birth-and-death model for
multi-Figure6.—ThebSandbNvalues of category A genes (䉭)
and category C genes (䊉) in ECs (top) and TMs⫹ICs (bot- gene families (Nei et al. 1997), as for MHC (Hughes
tom). Thex- andy-axis stand forbSandbN, respectively. The andNei1989;Neiet al. 1997), immunoglobulin (Ota
primate genes used for category A are T2R15, T2R43-44, andNei1994), histone (Piontkivskaet al. 2002), and
T2R45, T2R46, T2R47, T2R48, T2R49, T2R50, and T2R55,
ORgenes (Younget al. 2002). However, major
determi-and those for category C areT2R1,T2R2,T2R3,T2R4,T2R7,
nants that have shaped the gene repertoire may well
T2R16,T2R38,T2R39,T2R40,T2R41,T2R56, andT2R62.
differ from family to family. Broadly, determinants are either internal (genomic) or external (environmental). The gene repertoire of rRNA and histone multigene test also revealed that the ratio ofbNtobSis significantly
families is likely to be determined by internal (physiolog-higher in category A genes than in category C genes in
ical or genomic) requirements. On the other hand, the both ECs (P⬍0.05) and TMs⫹ICs (P⬍0.01). Similar
gene repertoire in MHC andOR genes is likely to be to the comparison between primates and mice, these
determined by requirements for defense against exoge-results indicate that category A genes within primates
nous pathogens and perception of chemical substances, underwent relaxed negative selection.
respectively. The situation of T2R resembles that of MHC and OR in that the gene repertoire is largely shaped by available foods.
DISCUSSION
325 Bitter Taste Receptor Genes in Primates
human-specific pseudogenes (hT2R2*, hT2R12*, and neutral mutations in a small population. This conclu-sion can be tested by the f values of individual T2R hT2R62*) belong to category C (Figure 2 and Table 1).
Equally importantly, humans have accumulated more genes between primates and mice. Under the slightly deleterious hypothesis, we would expect more or less pseudogenes per unit of time than nonhuman
anthro-poidea (Figure 4). Taken together, these observations the same ratio offptofrregardless of the genes involved. However, this is not the case. Although thefp/frratio indicate accelerated deterioration of tasting particular
bitter substances in humans. Interestingly, there are also averaged over 31 genes is 1.27 and consistent with the relatively small effective size in primates, the individual lineage-specific pseudogenes in some nonhuman
pri-mates and such pseudogenization tends to repeat in ratio values vary greatly from 0.58 (T2R15) to 2.21 (T2R41). This large variation in the fp/fr ratio among different lineages. As shown in Figure 2, there are six
such genes (T2R64,T2R55,T2R39,T2R9,T2R10, and loci can be more easily accounted for by relaxed nega-tive selection than by reduced effecnega-tive size.
T2R15) that were repeatedly dysfunctional in more than
one primate species. Repeated disruptions of these We have shown that functional constraints are weaker against genes in category A than in category C (Figure genes in different primates and tupais strongly suggest
that the fate of taste receptor genes is associated with 6). Hence, there is a trend that newly duplicated cate-gory A genes in primates tend to have accumulated non-environmental factors rather than with genetic ones.
Nev-ertheless, sinceT2R55and T2R39are functional in hu- synonymous substitutions and contributed to expansion of the gene repertoire, which might allow primates to mans, these genes are likely indispensable to tasting
partic-ular bitter substances throughout human evolution. perceive numerous bitter substances in a changing envi-ronment. We have also shown that primateT2Rgenes We have demonstrated that functional constraints are
more relaxed for the primateT2Rgenes than for the were subjected to extensive lineage-dependent pseudo-genization of functionally diversified duplicated copies. mouse genes (Table 3). Since the number of positively
selected amino acids in ECs is significantly larger than It appears that under joint effects of gene duplication and pseudogenization as well as interplay between genes that in TMs⫹ ICs (Figure 5), the average ratio of bN
tobSin primates is greater in EC s (0.94) than in TMs⫹ and environments, primateT2Rgenes have evolved to-ward species-specific repertoires.
IC s (0.57). Similarly, the average ratio in mice is 0.79
in EC s and 0.47 in TMs ⫹ IC s. We have noted that This research was supported in part by the Japanese Society for increased amounts of these ratios in primates relative Promotion of Science grant no. 12304046 (to N.T.).
to mice are almost the same between EC s (0.94/0.79) and TMs⫹IC s (0.57/0.47), indicating that irrespective
of the domains,ⵑ20% of the functional constraints are LITERATURE CITED
more relaxed in the primate lineage than in the mouse Adler, E., M. A. Hoon, K. L. Mueller, J. Chandrashekar, N. J.
Rybaet al., 2000 A novel family of mammalian taste receptors.
lineage. This relaxation in the primate lineage is
re-Cell100:693–702.
flected in the presence of a relatively larger number of
Chandrashekar, J., K. L. Mueller, M. A. Hoon, E. Adler, L. Feng
pseudogenes in primates (20ⵑ35%) than in mice (15%). et al., 2000 T2Rs function as bitter taste receptors. Cell 100:
703–711.
Recently, two research groups studied the pattern of
Conte, C., M. Ebeling, A. Marcuz, P. NefandP. J. Andres-Barquin,
the molecular evolution ofT2Rgenes in humans and
2002 Identification and characterization of human taste
recep-chimpanzees (Parry et al. 2004; Wang et al. 2004). tor genes belonging to the TAS2R family. Cytogenet. Genome
Res.98:45–53.
Specifically,Wanget al. (2004) examined the extent of
Conte, C., M. Ebeling, A. Marcuz, P. NefandP. J. Andres-Barquin,
functional constraints in 25 pairs of human and
chim-2003 Evolutionary relationships of the Tas2r receptor gene
fam-panzeeT2Rorthologs and in 28 pairs of mouse and rat ilies in mouse and human. Physiol. Genomics14:73–82.
Fischer, A., Y. Gilad, O. ManandS. Pa¨a¨bo, 2005 Evolution of
orthologs. Their conclusion is similar to ours: TheT2R
bitter taste receptors in humans and apes. Mol. Biol. Evol.22: genes in humans and chimpanzees are under relaxed
432–436.
selective constraints compared with those in mice and Fitch, W. M., 1971 Toward defining the course of evolution:
mini-mum change for a specific tree topology. Syst. Zool.20:406–416.
rats. Furthermore, Fischer et al. (2005) reported the
Gilad, Y., O. Man, S. Pa¨a¨boandD. Lancet, 2003 Human specific
evolutionary study ofT2Rgenes in humans, four great
loss of olfactory receptor genes. Proc. Natl. Acad. Sci. USA100: apes, and two OWMs and compared the ratio of per- 3324–3327.
Gilad, Y., V. Wiebe, M. Przeworski, D. LancetandS. Pa¨a¨bo, 2004
site nonsynonymous substitutions to per-site
synony-Loss of olfactory receptor genes coincides with the acquisition
mous substitutions in primates (fp) with that in rodents
of full trichromatic vision in primates. PLoS Biol.2:120–125.
(fr). Since the fp value is significantly larger than fr, Goodman, M., C. A. Porter, J. Czelusniak, S. L. Page, H. Schneider
et al., 1998 Toward a phylogenetic classification of primates based
these authors argued that the elevated ratio in primates
on DNA evidence complemented by fossil evidence. Mol.
Phylo-results from the reduced effective population size and
genet. Evol.9:585–598.
can be attributed to fixation of slightly deleterious muta- Hartigan, J. A., 1973 Minimum evolution fits to a given tree.
Bio-metrics29:53–65.
tions (Ohta 1975). Theoretically speaking, if the
re-Hillier, L. W., W.Miller, E.Birney, W.Warren, R. C.Hardison
duced effective population size is truly the cause of
et al., 2004 Sequence and comparative analysis of the chicken
the elevated ratio in primates, allT2Rgenes should be genome provide unique perspectives on vertebrate evolution.
Nature432: 695–716.
326 Y. Goet al.
Hughes, A. L., andM. Nei, 1989 Evolution of the major histocom- Ohta, T., 1975 Statistical analyses of Drosophila and human protein polymorphisms. Proc. Natl. Acad. Sci. USA72:3194–3196. patibility complex: independent origin of nonclassical class I
genes in different groups of mammals. Mol. Biol. Evol.6:559–579. Ota, T., andM. Nei, 1994 Divergent evolution and evolution by the birth-and-death process in the immunoglobulin VH gene
Kim, U. K., E. Jorgenson, H. Coon, M. Leppert, N. Rischet al.,
family. Mol. Biol. Evol.11:469–482. 2003 Positional cloning of the human quantitative trait locus
Parry, C. M., A. Erkner andJ. Le Coutre, 2004 Divergence of underlying taste sensitivity to phenylthiocarbamide. Science299:
T2R chemosensory receptor families in humans, bonobos, and 1221–1225.
chimpanzees. Proc. Natl. Acad. Sci. USA101:14830–14834.
Kosakovsky Pond, S. L., andS. D. W. Frost, 2005 Not so different
Piontkivska, H., A. P. RooneyandM. Nei, 2002 Purifying selection after all: comparison of various methods for detecting
amino-and birth-amino-and-death evolution in the histone H4 gene family. acid sites under selection. Mol. Biol. Evol.22:1208–1222.
Mol. Biol. Evol.19:689–697.
Kumar, S., K. Tamura, I. B. JakobsenandM. Nei, 2001 MEGA2:
Saitou, N., andM. Nei, 1987 The neighbor-joining method: a new molecular evolutionary genetics analysis software. Bioinformatics
method for reconstructing phylogenetic trees. Mol. Biol. Evol. 17:1244–1245.
4:406–425.
Lehninger, A. L., 1996 Biochemistry, Ed. 2. Kalyani Publishers, New
Shi, P., J. Zhang, H. YangandY. P. Zhang, 2003 Adaptive diversifi-Delhi.
cation of bitter taste receptor genes in mammalian evolution.
Li, X., L. Staszewski, H. Xu, K. Durick, M. Zolleret al., 2002
Hu-Mol. Biol. Evol.20:805–814. man receptors for sweet and umami taste. Proc. Natl. Acad. Sci.
Suzuki, Y., andT. Gojobori, 1999 A method for detecting positive USA99:4692–4696.
selection at single amino acid sites. Mol. Biol. Evol.16:1315–1328.
Matsunami, H., andH. Amrein, 2003 Taste and pheromone
per-Thompson, J. D., T. J. Gibson, F. Plewniak, F. JeanmouginandD. G.
ception in mammals and flies. Genome Biol.4:220.
Higgins, 1997 The CLUSTAL_X windows interface: flexible
Matsunami, H., J. P. MontmayeurandL. B. Buck, 2000 A family
strategies for multiple sequence alignment aided by quality analy-of candidate taste receptors in human and mouse. Nature404:
sis tools. Nucleic Acids Res.25:4876–4882. 601–614.
Wang, X., S. D. ThomasandJ. Zhang, 2004 Relaxation of selective
Muse, S. V., andB. S. Gaut, 1994 A likelihood approach for
compar-constraint and loss of function in the evolution of human bitter ing synonymous and nonsynonymous nucleotide substitution
taste receptor genes. Hum. Mol. Genet.13:2671–2678. rates, with application to the chloroplast genome. Mol. Biol. Evol.
Wong, G. T., K. S. GannonandR. F. Margolskee, 1996
Transduc-11:715–724. tion of bitter and sweet taste by gustducin. Nature381:796–800.
Nei, M., X. GuandT. Sitnikova, 1997 Evolution by the birth-and- Young, J. M., C. Friedman, E. M. Williams, J. A. Ross, L. Tonnes -death process in multigene families of the vertebrate immune Priddyet al., 2002 Different evolutionary processes shaped the system. Proc. Natl. Acad. Sci. USA94:7799–7806. mouse and human olfactory receptor gene families. Hum. Mol.
Nelson, G., M. A. Hoon, J. Chandrashekar, Y. Zhang, N. J. Ryba Genet.11:535–546.
et al., 2001 Mammalian sweet taste receptors. Cell106:381–390. Zhang, J., andD. M. Webb, 2003 Evolutionary deterioration of the
Nishikimi, M., R. Fukuyama, S. Minoshima, N. Shimizu and K. vomeronasal pheromone transduction pathway in catarrhine pri-Yagi, 1994 Cloning and chromosomal mapping of the human mates. Proc. Natl. Acad. Sci. USA100:8337–8341.
nonfunctional gene for L-gulono-␥-lactone oxidase, the enzyme Zhang, J., H. RosenbergandM. Nei, 1998 Positive Darwinian selec-for L-ascorbic acid biosynthesis missing in man. J. Biol. Chem. tion after gene duplication in primate ribonuclease genes. Proc.
269:13685–13688. Natl. Acad. Sci. USA95:3708–3713.
Ohno, S., 1970 Evolution by Gene Duplication. Springer-Verlag, New