Computer Aided Tomography for
Reconstruction of Medical Images Using
Ramp Filter
Kode Akhila1, Dr.B.Naga Jyothi2, Medisetti Gowtham3, Puppala Pandu Ranga Rao4, Singaluri Haripriya5 , Francis Manoj Kare6 .
U.G. Student, Department of Electronics and Communication Engineering, D.M.S.S.V.H College of Engineering
Machilipatnam, Andhra Pradesh, India1,3,4,5,6
Professor, Department of Electronics and Communication Engineering, D.M.S.S.V.H College of Engineering
Machilipatnam, Andhra Pradesh, India2
ABSTRACT: The main objective of this project is reconstruction of medical images using computerized tomography. A basic problem in imaging with x-rays (or other penetrating radiation)is that a 2Dimensional image is obtained of a 3Dimensional object. This means that structures can overlap in the final image, even though they are completely separate in the object. This is particularly troublesome in medical diagnosis where there are many anatomic structures that can interfere with what the physician is trying to see. To solve this problem, several cross sectional views are taken and then reconstruct the final image from these views or slices. In this project we implement the image reconstruction from the cross sections tomographic views in MATLAB. We will use algorithm called Filtered Back Projection technique during reconstruction. In less technical terms, a back projection is formed by smearing each view back through the image in the direction it was originally acquired. The final back projected image is then taken as the sum of all the back projected views. The input for the algorithm is cross sectional radiation views. These views can be
downloaded from online data bases and the output is the reconstructedimage.
KEYWORDS:Cross sectional views, Filtered Back Projection, Smearing and Reconstruction.
I. INTRODUCTION
II.RELATEDWORK
1. Fourier slice theorem:
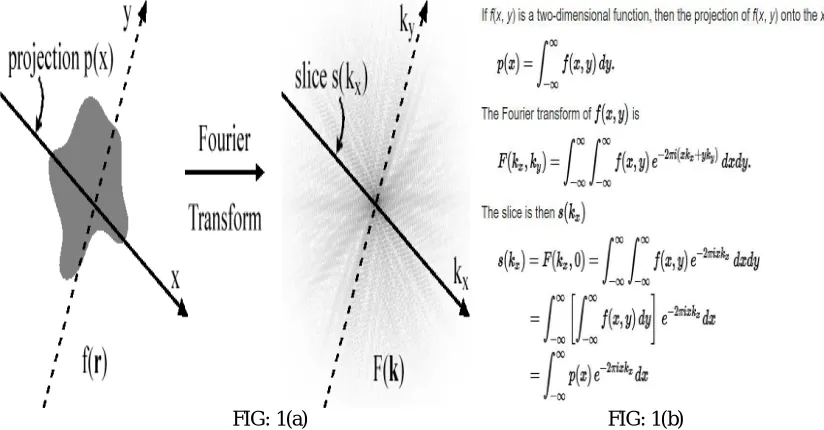
The projection slice theorem, central slice theorem or Fourier slice theorem in two dimensions states that, the 2D Fourier transform can be reconstructed from 1Dimensional projections/slices [1].
FIG: 1(a) FIG: 1(b)
FIG 1(a):Agraphical representation of the Fourier slice theorem in two dimensions .f(r) and F(k) are 2-dimensional Fourier transform pairs. The projection of f(r) onto the x-axis is the integral of f(r) along lines of sight parallel to the y-axis and is labelled p(x).The slice through F(K) is on the k,axis,which is parallel to the x axis and labelled p(x). FIG 1(b): Proof of Fourier Slice theorem
2. Back projection:
The standard method of reconstructing CT slices is Back projection. This involves “smearing back” the projection across the image at the angle it was acquired.By smearing back all of the projections, you reconstruct an image .This looks similar to the real picture but is blurry.we smeared bright pixels across the entire image instead of putting them exactly where they belong[8].
Determine the back projected image from each projection and then reconstruction by summing different number of back projection. The simplest method for reconstructing an image from projections along the angle is by Backprojection.Apply inverse Fourier Transform of the 1D Projections. Compute all the 2D points from the projection. Take that same function, but do a two dimensional Fourier transform first, and then slice it through its origin, which is parallel to the projection line.
3. Filtered Back projection:
midpoint. When we are rotating the image the low frequencies are coming close to the midpoint due to this the density of low frequencies at the midpoint increases and high frequency density is too low. For suppressing low frequencies we are using Ramp filter. Ramp filter linearly increases the low frequency components and high frequency components for reproducing the image exactly.
III.METHODOLOGY
Projection Flowchart:
FIG: 2 Projection Flowchart
Back projection Flowchart:
FIG: 3 Back Projection Flowchart
Initially we computed 1dimensional projections. We saved those projections and projection angle vector (it is the matrix that contains the no. of different angles we have in the vector)for those projections.We are applying Fourier transform and applying filter and then summing up all those we get the filtered back projection image. This process continues until the projection count is below the total projections. By this flow chart we reconstructed the 2 Dimensional image from 1Dimensional projected images.
IV.EXPERIMENTALRESULTS
FIG: 4 INPUT FIG: 5 1 PROJECTION FIG: 6 180 PROJECTIONS
FIG: 7 3DEG FIG: 8 30 DEG FIG: 9 60 DEG
FIG:13 180 DEG
V. CONCLUSION
We have implemented the 2dimensional image reconstruction from 1Dimensional projections. By using tomography technique we obtained 1dimensional slices and the back projection image. For removing noise, obtained from back projection we applied ramp filter to remove noise and to restrict the low frequency component strength to reproduce the image exactly. We have successfully implemented image reconstruction with MATLAB. We have implemented the image reconstruction for 2Dimensional image .It can be extended to 3 Dimensional images.
REFERENCES
[1] ECE 468:Digital image processing Lecture 15 prof.sinisaTodorovic [email protected]
[2] The scientist and Engineer’s Guide to Digital Signal processing by Steven W.smith,ph.Dhttp://www.dspguide.com/ch25/5.htm [3] IEEE transactions on MEDICAL IMAGING, vol.21, No-2,Feb 2002.
[4] J.A.Browne and T.J.Holmes,Developments with maximum likelihood X-ray computed tomography”, IEEE Trans.Med.Imag.,vol.11,pp.40-52,Mar.1992
[5] B.R.Whiting,L.J.montagnino,andD.G.Polite,”Modeling X-Ray computed tomography sinograms,”Med.phys.,2001
[6] J.A.Fessler,”Statistical image reconstruction methods for transmission tomography,” in Handbook of Medical Imaging, Medical processing and Analysis,M.sonka and J.M.Fiptzpatricks.
[7] http://www.clear/rice.edu/elec431/projects96/DSP/filters.html
[8] http://x-rayphysics.com/ctsim.html