Statistical Methods in Environmental
Engineering - Sonication A Practical Study
S. V. Khedkar1, Dr. N. W. Ingole 2
Assistant Professor, Department of Chemical Engineering College of Engineering and Technology, NH-6, Murtizapur
Road, Babhulgaon (Jh) Akola, Maharashtra State, India1
Professor and Dean R & D, PRMIT & R Bandera, Amravati, Maharashtra State, India2
ABSTRACT: The process of sonication is an advance oxidation process which is nowadays being used by different industries for different purposes. In chemical industries it is used for material synthesis, yield improvement and process intensification. In nano industries it’s used for nano material synthesis. Similarly in water treatment industry it’s used for the physical, chemical and biological treatment of water. The sonication process has a number of parameters these parameters may be divided into machine side parameters and material side parameters. The machine side parameters are sonication amplitude, sonication time, mode of sonication, temperature of sonication. The material side parameters may be listed as concentration of material, pH of material, volume of material or rate at which the material is flowing. This paper discusses the optimization of process parameters using the factorial design of experiments. The method generates an optimized model for the probe sonication method.
KEYWORDS: Sonication, intensification, optimization, advance oxidation.
I. INTRODUCTION
Response variable(s) in any experiment can be found to be affected by a number of factors in the overall system some of which are controlled or maintained at desired levels in the experiment. An experiment in which the treatments consist of all possible combinations of the selected levels in two or more factors is referred as a factorial experiment. For example, an experiment on rooting of cuttings involving two factors, each at two levels, such as two hormones at two doses, is referred to as a 2 x 2 or a 22 factorial experiment. Its treatments consist of the following four possible combinations of the two levels in each of the two factors.
The term complete factorial experiment is sometimes used when the treatments include all combinations of the selected levels of the factors. In contrast, the term fractional factorial experiment is used when only a fraction of all the combinations is tested. Throughout this manual, however, complete factorial experiments are referred simply as factorial experiments. Note that the term factorial describes a specific way in which the treatments are formed and does not, in any way, refer to the design used for laying out the experiment. For example, if the foregoing 22 factorial experiment is in a randomized complete block design, then the correct description of the experiment would be 22 factorial experiments in randomized complete block design.
example, a tree breeder has collected 30 new clones from a neighboring country and wants to assess their reaction to the local environment. Because the environment is expected to vary in terms of soil fertility, moisture levels, and so on, the ideal experiment would be one that tests the 30 clones in a factorial experiment involving such other variable factors as fertilizer, moisture level, and population density. Such an experiment, however, becomes extremely large as factors other than clones are added. Even if only one factor, say nitrogen or fertilizer with three levels were included, the number of treatments would increase from 30 to 90. Such a large experiment would mean difficulties in financing, in obtaining an adequate experimental area, in controlling soil heterogeneity, and so on. Thus, the more practical approach would be to test the 30 clones first in a single-factor experiment, and then use the results to select a few clones for further studies in more detail. For example, the initial single-factor experiment may show that only five clones are outstanding enough to warrant further testing. These five clones could then be put into a factorial experiment with three levels of nitrogen, resulting in an experiment with 15 treatments rather than the 90 treatments needed with a factorial experiment with 30 clones.
Advanced Oxidative Process (AOP) is an important alternative for treatment of contaminated water and wastewater containing highly-biodegradable anthropogenic substances, pharmaceuticals, pesticides, disinfectants of drinking waters etc. [1, 2, 3 , 4, 5, 6, 7, 8, 9] and used after well-established methods (flocculation, precipitation, adsorption, etc.) and before biological methods (aerobic activated sludge) to enhance the biodegradability of wastewater.
AOPs modify the pollutants structure producing less toxic and biodegradable products, which can be treated by a biological process. AOPs can be defined as methods where hydroxyl radicals (HO) are produced in sufficient quantity to act as main oxidizing agent. Hydroxyl radicals can be generated as a result of the combination of strong oxidizing agent, such as hydrogen peroxide and ozone. Ultraviolet (UV) or visible radiation and catalysts such as metal ions and semiconductors can also be used to create hydroxyl radicals [10, 11]. AOPs using the combination of ozone with other oxidant agents (UV radiation and hydrogen peroxide) allow only oxidation of dissolved organic compounds that are normally refractory to the direct attack of ozone. UV radiation and hydrogen peroxide addition lead to the ozone demolition and hydroxyl radical formation [11, 12]
The process of sonication is also one of the advance oxidation technologies.
II. TAGUCHI METHOD
Taguchi technique is a powerful tool in quality control and optimization of processes. It is a simple and efficient technique which aims at finding the optimum setting of the process control parameters in order to obtain best performance of the process. An efficient way to study simultaneous effects of parameters on the process is by planning experiments using orthogonal array. This method integrates design of experiments with parameter optimization using signal-to-noise ratio (S/N) which is the logarithmic function of desired output to generate optimum design. The ratio depends on the output to be optimized. The response variable under study dictates the selection of S/N ratio to be larger-the-better (LB), nominal-the-better (NB) or smaller-the-better (SB) [13, 14, and 15]
III. SIGNAL TO NOISE (S/N) RATIO
Larger-the-better
n= -10Log10 [mean of sum of squares of reciprocal of measured data]
Nominal-the-better
n=-10 Log10 [square of mean/variance]
Here it is important to emphasize the needs of randomizing the trials to minimize systematic error.
The steps applied for Taguchi optimization in this study are as follows. Select noise and control factors
Select Taguchi orthogonal array Conduct Experiments
Metal Removal Rate measurement Analyze results; (Signal-to-noise ratio) Predict optimum performance
Confirmation experiment
IV. EXPERIMENTAL PROCEDURE
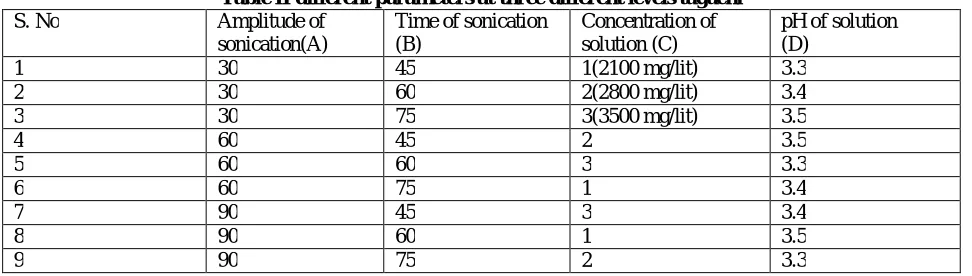
A. The experiments were planned as per L-9 array (Table I). Experiments were conducted at different levels as shown in table I below. The Table II below shows the different levels for different parameters. Five sets of trials were conducted each trial comprised of nine experiments as shown in table III. The experiments comprised of sonication of Aspirin solution and titration of sonicated solution against NaOH after sonication by altering different parameters. The titration end points recorded are depicted in Table III below.
B. Degree of Freedom (DOF) = number of levels -1 (1) For each factor, DOF equal to: For (A); DOF = 3 – 1 = 2 For (B); DOF = 3 – 1 = 2 For (C); DOF = 3 – 1 = 2 For (D); DOF =3-1=2
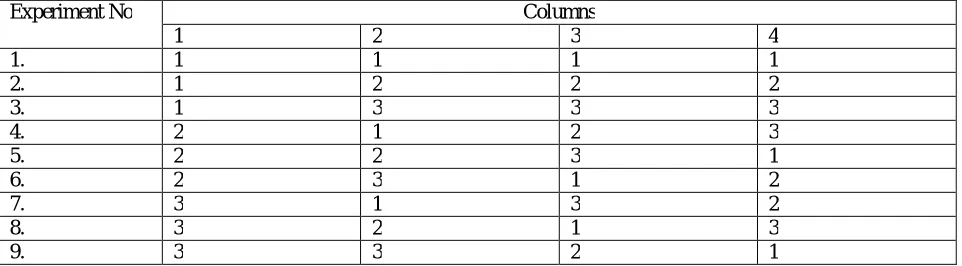
In this research nine experiments were conducted at different parameters. For this Taguchi L9 orthogonal array was used, which has nine rows corresponding to the number of tests, with three columns at three levels. L9 orthrogonal array has eight DOF, in which 6 were assigned to three factors (each one 2 DOF) and 2 DOF was assigned to the error [16].
Table I for the L-9 array
Experiment No Columns
1 2 3 4
1. 1 1 1 1
2. 1 2 2 2
3. 1 3 3 3
4. 2 1 2 3
5. 2 2 3 1
6. 2 3 1 2
7. 3 1 3 2
8. 3 2 1 3
Table II different parameters at three different levels taguchi S. No Amplitude of
sonication(A)
Time of sonication (B)
Concentration of solution (C)
pH of solution (D)
1 30 45 1(2100 mg/lit) 3.3
2 30 60 2(2800 mg/lit) 3.4
3 30 75 3(3500 mg/lit) 3.5
4 60 45 2 3.5
5 60 60 3 3.3
6 60 75 1 3.4
7 90 45 3 3.4
8 90 60 1 3.5
9 90 75 2 3.3
Table III different trials conducted for each parameter at different levels and the results obtained
S. No Trial 1 Trial 2 Trial 3 Trial 4 Trial 5 Mean Y
1 2.5 3.5 3.8 3.0 4.0 3.36
2 3.0 3.7 2.2 2.5 2.9 2.86
3 2.5 3.8 3.3 3.5 3.9 3.4
4 2.1 2.5 2.7 3.4 3.3 2.8
5 1.7 2.5 2.0 2.4 1.6 2.04
6 1.3 0.3 0.7 1.5 1.1 0.98
7 2.3 2.7 2.9 3.2 2.0 2.62
8 0.7 0.8 1.6 0.3 1.3 0.94
9 0.5 0.8 1.4 1.5 1.9 1.22
Table IV Sum of squares, S/N ratio and m
S. No Trial 1 Trial 2 Trial 3 Trial 4 Trial 5 Sum of
Squares Y
Mean sum of squares Y2
S/N ratio
1. 2.5 3.5 3.8 3.0 4.0
Ssq. 6.25 12.25 14.44 9 16 45.94 11.588 -10.63η1
2. 3.0 3.7 2.2 2.5 2.9
Ssq. 9 13.69 4.84 6.25 8.41 42.19 8.438 -9.25 η2
3. 2.5 3.8 3.3 3.5 3.9
Ssq 6.25 14.44 10.89 12.25 15.21 59.04 11.808 -10.71η3
4. 2.1 2.5 2.7 3.4 3.3
Ssq 4.41 6.25 7.29 11.56 10.89 40.4 8.08 -9.07 η4
5. 1.7 2.5 2.0 2.4 1.6
Ssq 2.89 6.25 4.0 5.76 2.56 21.46 4.292 -6.32 η5
6. 1.3 0.3 0.7 1.5 1.1
Ssq 1.69 0.09 0.49 2.25 1.21 5.73 1.146 -0.56 η6
7. 2.3 2.7 2.9 3.2 2.0
Ssq 5.29 7.29 8.41 10.24 4 35.23 7.046 -8.47η7
8. 0.7 0.8 1.6 0.3 1.3
Ssq 0.49 0.64 2.56 0.09 1.69 5.47 1.094 -0.374η8
9. 0.5 0.8 1.4 1.5 1.9
Table V calculations for average S/N ratio
S. No Parameter Level Calculation of average S/N ratio Average S/N ratio 1. Amplitude A1 η1+η2+η3/3= -10.63 - 9.25 -10.71 /3 -10.19
A2 η 4+η 5+ η 6 = - 9.07 - 6.32 - 0.56 /3 -5.31 A3 η 7+η 8+ η 9 = - 8.47- 0.374 - 2.40 /3 -3.74 2. Time B1 η 1+η 4+ η 7 = -10.63 - 9.07- 8.47 /3 -9.39 B2 η 2+η 5+ η 8 = - 9.25 - 6.32 - 0.374 /3 -5.31
B3 η 3+η 6+ η 9 = -10.71- 0.56 - 2.40 /3 -4.55
3. Concentration C1 η 1+η 5+ η 9 = -10.63 - 6.32 - 2.40 /3 -6.45 C2 η 2+η 6+ η 7 = - 9.25 - 0.56 - 8.47 /3 -6.09 C3 η 3+η 4+ η 8 = -10.71- 9.07 - 0.374 /3 -6.71
4. pH D1 η 1+η 6+ η 8 = -10.63 - 0.56 - 0.374 /3 -3.85
D2 η 2+η 4+ η 9 = - 9.25 - 9.07 - 2.40 /3 -6.90 D3 η 3+η 5+ η 7 = - 10.71- 6.32 - 8.47 /3 -8.5
Table VI combined effect of factors at different levels
S. No factor Level1 Level 2 Level 3
1. Amplitude of Sonication -10.19 -5.31 -3.74
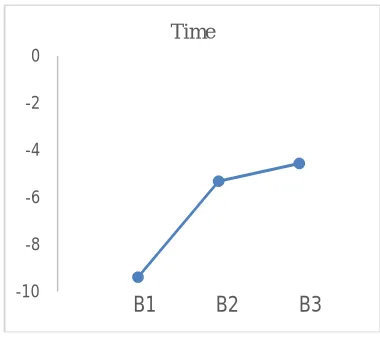
2. Time of Sonication -9.39 -5.31 -4.55
3. Concentration -6.45 -6.09 -3.85
4. pH -3.85 -6.90 -8.5
5. Combined best conditions A3B3C3D1
V. GRAPHICAL REPRESENTATION OF RESULTS OBTAINED
Fig I Depicts average S/N ratio vs amplitude Fig II Depicts average S/N ratio vs time -12
-10 -8 -6 -4 -2 0
Amplitude
A1 A2 A3 -10 -8 -6 -4 -2 0
Time
Fig III Depicts average S/N ratio vs concentration Fig IV Depicts average S/N ratio vs pH
VI. OPTIMIZED MODEL DEVELOPED
In the present example, the identified optimum condition or the optimum level of factors is A
3B3C3D1 has been obtained from table VI. The value of η under the optimum condition is predicted using the additive model as given below N optimization from taguchi = m + m A1-m + m B1- m = - 6.42 + [-3.77 - (- 6.42)] + [-4.55 – (-6.42)] = - 1.87 This S/N ratio is very close to the S/N ratio of experiment no 9.
VII. RESULTS AND DISCUSSION
From the results its clear that the process of sonication can be optimized using the Taguchi method. The optimized model is very much closer to the actual situation during experimentation. During experimentation we require higher time for higher and higher amplitude for higher concentration aspirin solution to be degraded. The preferred pH for degradation is the lower pH. The confirmation experiment was carried out at the above best conditions observed and it confirmed with the earlier results for best condition.
VIII. CONCLUSIONS
From the results obtained its very clear that Taguchi optimization technique can also be utilized for optimization problems in environmental engineering. It is useful in industry as well as research work. In the above case the process of sonication of Aspirin solution for degradation has been successfully optimized and modeled. The best conditions for optimum operating conditions have been confirmed from both trials and confirmatory experiments.
REFERENCES
1. Oguz, E., Keskinler, B., Çelik, C. and Çelik, Z. (2006) Determination of the Optimum Conditions in the Removal of Bomaplex Red CR-L Dye from the Textile Wastewater Using O3, H2O2, HCO3 − and PAC. Journal of Hazardous Materials, 131, 66-72.
2. Meriç, S., Kabdalia, I., Tunay, O. and Orhon, D. (1999) Treatability of Strong Wastewaters from Polyesters Manufacturing Industry. Water Science and Technology, 39, 1-7. http://dx.doi.org/10.1016/S0273-1223(99)00247-4
3. Parra, S.P.C. (2001) Coupling of Photocatalytic and Biological Process as a Contribution to the Detoxification of Water : Catalytic and Technological Aspects. Ph. D. Thesis, Ècole Polytechnique Fédérale de Lausanne.
4. Legrini, O., Oliveros, E. and Braun, A.M. (1993) Photochemical Process for Water-Treatment. Chemical Reviews, 93,671-698.
http://dx.doi.org/10.1021/cr00018a003
-7 -6 -5 -4 -3 -2 -1 0
Concentration
C1 C2 C3 -9 -8 -7 -6 -5 -4 -3 -2 -1 0
0 1 2 3 4
pH
7. Freire, R.S., Pelegrini, R., Kubota, L.T. and Durán, N. (2000) Novas tendências para o tratamento de resíduos industriais contendo espécies organocloradas. Química Nova, 23, 504-511. http://dx.doi.org/10.1590/S0100-40422000000400013
8. Silva, M.B., Almeida, C.R.O., Chaves, F.J.M., Izário Filho, H.J. and Mattos, J.R.A. (2003) Treatment of Strong
Wastewater Using Advanced Oxidation Process (AOP) and Biological Process (BP) to Reduction of Chemical Oxygen Demand (COD) in Samples from Polyester Manufacturing Industry. Conferencia Científica Internacional Medio Ambiente Siglo XXI (MAS III), Santa Clara.
9. Guimarães, O.L.C. and Silva, M.B. (2007) Hybrid Neural Model for Decoloration by UV/H2O2 Involving Process Variables and Structural Parameters Characteristics to Azo Dyes. Chemical Engineering and Processing, 46, 45- http://dx.doi.org/10.1016/j.cep.2006.04.005
10. Nogueira, R.F.P., Trovó, A.G., Silva, M.R.A., Villa, R.D. and Oliveira, M.C.O. (2007) Fundamentos e aplicaçõesambientais dos processos Fenton e foto-Fenton. Química Nova, 30, 400-408. http://dx.doi.org/10.1590/S0100-40422007000200030
11. Guzzella, L., Feretti, D. and Monarca, S. (2002) Advanced Oxidation and Adsorption Technologies for Organic Micropollutant Removal from Lake Water Used as Drinking-Water Supply. Water Research, 36, 4307-4318. http://dx.doi.org/10.1016/S0043-1354(02)00145-8
12. Messias Borges Silva et al., 2014, “An Application of the Taguchi Method (Robust Design) to Environmental Engineering: Evaluating Advanced Oxidative Processes in Polyester-Resin Wastewater Treatment”, American Journal of Analytical Chemistry, 5, pp 828-837, Published Online September 2014 in Sci. Res.
13. S.T. Aruna,P.V.K. Srikanth, M. Jamil Ahamad, S. Latha and K.S. Rajam, “Optimization Of The Properties Of Electrodeposited Ni-YSZ Composites Using Taguchi Method And Regression Analysis”, Portugaliae Electrochimica Acta2011, 29(1), pp 23-37.
14. S. Kamaruddin, Zahid A. Khan and S. H. Foong, “Application of Taguchi Method in the Optimization of Injection Moulding Parameters for Manufacturing Products from Plastic Blend”, IACSIT International Journal of Engineering and Technology, Vol.2, No.6, December 2010 ISSN: 1793-8236.
15. Rama Rao S, Padmanabhan G, 2012, “Application of Taguchi Methods and ANOVA in Optimization of Process Parameters for Metal Removal Rate in Electrochemical Machining Of Al/5% Sic Composites”. International Journal of Engineering Research and Applications (IJERA) ISSN: 2248-9622 Vol. 2, Issue 3, May-Jun 2012, pp 192-197.