Pavement Marking Performance Analysis
by
Dr. William J. Rasdorf, Dr. Joseph E. Hummer, Guanghua Zhang,
and Dr. William E. Sitzabee
North Carolina State University
Department of Civil, Construction, and Environmental Engineering
Campus Box 7908
Raleigh, NC 27695
North Carolina Department of Transportation
Research and Development Group
Raleigh, NC 27699-1549
Final Report
Project: 2008 – 05
Technical Report Documentation Page 1. Report No. 2. Government Accession No. 3. Recipient’s Catalog No.
4. Title and Subtitle
Pavement Marking Performance Analysis
5. Report Date June 30, 2009
6. Performing Organization Code
7. Author(s)
Dr. William J. Rasdorf, Dr. Joseph E. Hummer, Guanghua Zhang, and Dr. William Sitzabee
8. Performing Organization Report No.
10. Work Unit No. (TRAIS) 9. Performing Organization Name and Address
North Carolina State University
Department of Civil, Construction and Environmental Engineering Campus Box 7908
Raleigh, NC
11. Contract or Grant No.
13. Type of Report and Period Covered Final Report
July 2007 to June 2009 12. Sponsoring Agency Name and Address
North Carolina Department of Transportation Research and Analysis Group
104 Fayetteville Street
Raleigh, North Carolina 27601 14. Sponsoring Agency Code
2008-05 Supplementary Notes:
16. Abstract
This research evaluated pavement marking performance and developed useful degradation models for thermoplastic and paint pavement markings which could help North Carolina meet the pending FHWA minimum retroreflectivity requirements. The impacts of several important factors (such as lateral location, directionality, region, and pavement roughness) on marking retroreflectivity were evaluated. With two large datasets in hand, we could determine whether these factors had significant impacts on marking retroreflectivity. Image processing techniques were used to analyze pavement marking surface glass bead density. We were able to explain why paint marking retroreflectivity values degraded over time by evaluating the impact of bead density on paint marking retroreflectivity. The research evaluated existing marking retroreflectivity degradation models and developed useful new models for both thermoplastic and paint pavement markings in NC. The researchers also suggested a framework for a pavement marking maintenance system that NCDOT can develop and use to optimize its investment in these markings. The research outcomes will enable NCDOT have a better understanding of thermoplastic and paint pavement marking performance, which can lead to cost saving by maximizing pavement marking service lifecycle.
17. Key Words
Pavement Marking, Thermoplastics, Paint, Retroreflectivity, Asset Management
18. Distribution Statement
19. Security Classif. (of this report) Unclassified
20. Security Classif. (of this page) Unclassified
21. No. of Pages 173
22. Price
DISCLAIMER
ACKNOWLEDGEMENTS
The research team acknowledges the North Carolina Department of Transportation for supporting and funding of this project. We extend our thanks to the current and former project Steering and Implementation Committee members:
Chris B. Howard (Chair) Meredith McDiarmid, P.E. Theresa A. Canales, P.E. Brad Hibbs, P.E., FHWA Lee Jernigan
Steve Johnson
Debbie Barbour, P.E. Moy Biswas, Ph.D., P.E. Stuart Bourne, P.E. Joseph Geigle, FHWA Lacy Love , P.E. Jon Nance, P.E. Steve Varnedoe, P.E. Ernest Morrison, P.E.
The authors especially thank Mr. Chris Howard and Ms. Meredith McDiarmid for reviewing papers related to this research project. The research team appreciates Mr. Mark Manriquez, Mr. C. L. McMillian, and Mr. William Faircloth of NCDOT for their help with the field data collection. We also thank Mr. Matt Soule and Ms. Jamie Manning of Precision Scan, LLC for good communications regarding the retroreflectivity data their company collected.
Mr. Neil Mastin in the NCDOT pavement management unit helped us collect pavement roughness data on the roads where we measured the paint marking retroreflectivity. We are very grateful for Neil’s contribution to this research. Special thanks are given to students Mr. Paul Ku, Mr. Bryan Kearns, and Ms. Juhi Jain at NC State University who helped with the field data collection.
EXECUTIVE SUMMARY
Pavement markings, like traffic signs, are considered to be traffic control devices having the function of controlling traffic and encouraging safe and efficient vehicle operation according to the American Association of State Highway and Transportation Officials (AASHTO). Pavement markings generally have a shorter service life than the pavement on which the markings are applied. Markings need to be restriped when their retroreflectivity values fall below a minimum level. Understanding pavement marking performance is important to maximize the material’s service lifecycle which can eventually reduce the costs of markings. This research evaluates pavement marking performance characteristics on NC highways and presents a pavement marking asset management system scheme that will enable NCDOT to effectively implement pending new Federal standards on pavement markings.
The research found that there was a significant difference in the rate of retroreflectivity degradation between edge lines and centerlines for both yellow and white thermoplastic markings. The results indicated that edge lines degraded at a slower rate than center or skip lines for both white and yellow thermoplastics. Both un-weighted and weighted ANOVA analyses indicated that there was a consistent 85 percent or greater probability that edge lines and center lines degraded at different rates from six months through five years for both yellow and white thermoplastic markings.
Paint pavement marking centerline retroreflectivity values measured in the direction of paint striping were found to be significantly higher than the values measured in the opposite direction. The differences were normally in the range of 20-50 mcd/m2/lux but the difference could be as large as 95 mcd/m2/lux based on the field collected data. The results indicated that the lower average retroreflectivity value for a yellow centerline, measured in the opposite direction from the direction of paint striping, should be used to compare with the future FHWA minimum standard to determine whether or not the centerline meets the standard.
We developed a computer-aided counting method to analyze glass bead images to obtain glass bead density values. Then, we conducted a correlation study between pavement marking retroreflectivity and bead density. The study found that the normal range of bead density we observed was 9-24 percent of the paint marking surface. Glass bead density had a significant impact on marking retroreflectivity. Higher glass bead density led to higher marking retroreflectivity. Furthermore, white edge markings had conclusively higher retroreflectivity values than yellow center markings when the bead density values were the same.
The researchers used ANOVA and longitudinal data analysis methods to investigate the impact of region on pavement marking retroreflectivity. The results showed that in the mountain area the thermoplastic pavement marking retroreflectivity values degraded faster than in the central and coastal area. But, the differences were not statistically significant because the variations within each region were relatively large.
found that for an AADT of 10,000 vehicles per day, the expected service life for thermoplastics on asphalt ranged from 5.4 years to 8.75 years depending on the color and lateral location. The result also showed that AADT had a small but significant impact on the degradation of thermoplastic pavement markings.
We established linear mixed effects models (LMEM) for white edge and yellow center pavement markings. The LMEM results showed that the fixed intercept and fixed slope were 310 mcd/m2/lux and -75 mcd/m2/lux per year for white edge new markings, and were 143 mcd/m2/lux and -25 mcd/m2/lux per year for yellow center new markings. The random intercepts and slopes varied in a wide range among different pavement markings, which means that marking performances changed significantly from one road to another. The estimated average lifecycles for white and yellow paint markings were 2.7 and 3.1 years, respectively. The research developed a transportation asset management system framework for estimating the current and future condition of pavement markings. We described the data structure, in the form of a physical model, integrating a pavement marking relational data schema with existing information technology systems. The system included an algorithm which implements the data structure and predictive models to estimate the condition of the asset at any point in time or space on the highway system. Using either measured data or predicted data the system gives managers an opportunity to decide on the best possible condition state of the asset and perform queries or optimizations. Pavement marking managers can develop cost effective strategies for pavement marking asset management.
TABLE OF CONTENTS
DISCLAIMER ...II ACKNOWLEDGEMENTS ... III EXECUTIVE SUMMARY... IV TABLE OF CONTENTS... VI LIST OF FIGURES ... XI LIST OF TABLES ...XIII
1.0 INTRODUCTION ...1
1.1 Research Objectives ...1
1.2 Research Scope ...2
1.3 Outcomes and Benefits ...3
1.4 Report Organization...3
2.0 STATISTICAL VALIDATION OF THE EFFECT OF LATERAL LINE LOCATION ON PAVEMENT MARKING RETROREFLETIVITY DEGRADATION ...4
2.1 Background...4
2.1.1 Pavement Marking Materials ...5
2.1.2 Retroreflectivity Measurement and Standards ...6
2.1.3 Retrorefelctivity Measurement Devices ...7
2.1.4 Types of Lane Markings ...7
2.1.5 Previous Research ...8
2.2 Methodology ... 13
2.2.1 Data Collection... 13
2.2.2 Data Reduction ... 16
2.2.3 Average Value Analysis ... 17
2.2.4 Analysis of Variance... 18
2.3 Results ... 19
2.3.1 Overall Summary Statistics... 19
2.3.2 Average Value Analysis (Un-weighted)... 19
2.3.3 Average Value Analysis (Weighted) ... 21
2.3.4 Analysis of Variance (Un-weighted) ... 24
2.3.5 Analysis of Variance (Weighted) ... 25
2.3.6 Comparison to Current Literature ... 26
2.4 Conclusions ... 26
3.0 THE IMPACT OF DIRECTIONALITY ON PAINT PAVEMENT MARKING
RETROREFLECTIVITY ... 28
3.1 Research Objective ... 29
3.2 Research Scope ... 29
3.3 Background... 30
3.3.1 Paint Marking Material ... 30
3.3.2 Pavement Marking Retroreflectivity ... 31
3.3.3 Paint Application ... 31
3.3.4 Driver Line of Sight... 32
3.3.5 RL Measurement Directions ... 33
3.3.6 Retroreflectivity Directionality Explanation... 34
3.3.7 Data Collection Instrument ... 35
3.3.8 Data Collection Method... 36
3.4 Methodology ... 36
3.4.1 Unknown Striping Direction Study ... 36
3.4.2 Data Analysis ... 40
3.4.3 Known Striping Direction Study... 40
3.5 Results ... 40
3.6 Conclusions ... 42
4.0 THE IMPACT OF BEAD DENSITY ON PAINT PAVEMENT MARKING RETROREFLECTIVITY ... 44
4.1 Literature Review ... 44
4.2 Research Objectives ... 46
4.3 Painting Materials and Process... 46
4.3.1 Glass Beads ... 46
4.3.2 Paint Marking Material ... 47
4.3.3 Paint Marking Application... 47
4.4 Methodology ... 47
4.4.1 Field Data Collection ... 48
4.4.2 Bead Density Determination ... 49
4.5 Results ... 57
4.6 Conclusions ... 60
4.7 Recommendations... 61
5.0 THE IMPACT OF REGION ON PAVEMENT MARKING PERFORMANCE ... 63
5.1 Climate Regions... 63
5.2 Retroreflectivity Data Analysis ... 64
5.2.2 Data Distribution and Quantity ... 67
5.2.3 ANOVA Analysis of the Collected Retroreflectivity Data... 70
5.2.4 Longitudinal Data Analysis ... 71
5.3 Limitations... 73
5.4 Recommendations... 73
6.0 THE IMPACT OF PAVEMENT ROUGHNESS ON PAINT PAVEMENT MARKING RETROREFLECTIVITY ... 74
6.1 Research Objective ... 74
6.2 Research Scope ... 74
6.3 Methodology ... 75
6.3.1 Data Collection... 75
6.3.2 Pavement Roughness Data... 76
6.4 Preliminary Results ... 76
6.5 Ongoing Work ... 77
7.0 THERMOPLASTIC PAVEMENT MARKING DEGRADATION MODELING AND ANALYSIS ... 78
7.1 Objective and Scope ... 78
7.2 Background... 78
7.2.1 Marking Materials ... 79
7.2.2 Retroreflectivity... 79
7.2.3 Previous Studies ... 80
7.2.4 Summary of Literature... 84
7.3 Methodology ... 84
7.3.1 Data... 84
7.3.2 Minimum Standard ... 85
7.3.3 Modeling the Data ... 86
7.4 Results ... 86
7.4.1 Variables ... 87
7.4.2 Models ... 89
7.4.3 Service Life ... 95
7.5 Conclusions ... 95
7.6 Future Research ... 96
8.0 LINEAR MIXED EFFECTS MODELS FOR PAINT PAVEMENT MARKING RETROREFLECTIVITY DATA ... 98
8.1 Research Scope ... 99
8.2 Research Objective ... 99
8.3.1 Linear Regression Model... 99
8.3.2 Exponential or Logarithmic Model ... 101
8.3.3 Other Models... 102
8.4 Pavement Marking Retroreflectivity Data ... 103
8.4.1 Data Sampling Method ... 103
8.4.2 Data Collection Procedure ... 104
8.4.3 Paint Retroreflectivity Data ... 104
8.4.4 Marking Retroreflectivity Data Characteristic ... 107
8.5 Methodology ... 112
8.5.1 Linear Regression Models ... 112
8.5.2 Linear Mixed Effects Model ... 113
8.6 Model Results ... 114
8.7 Prediction Accuracy Comparison ... 115
8.8 Conclusions ... 118
8.9 Recommendations... 118
9.0 DATA INTEGRATION OF PAVEMENT MARKINGS: A CASE IN TRANSPORTATION ASSET MANAGEMENT ... 119
9.1 Background... 119
9.1.1 Transportation Asset Management (TAM)... 119
9.1.2 Definition of the Asset ... 120
9.1.3 Level of Service... 121
9.2 Pavement Marking Transportation Asset Management System ... 121
9.2.1 Pavement Marking Degradation Models (Predictive Models)... 122
9.2.2 MMS Data Structure... 123
9.2.3 Algorithm ... 128
9.2.4 Measured Data... 129
9.3 Condition Decision to Perform Queries and Develop Strategies ... 129
9.3.1 Visual Inspections ... 129
9.3.2 Pavement Management System... 131
9.4 Limitations... 132
9.4.1 Recording Key Variables ... 132
9.4.2 Location Referencing... 132
9.5 Demonstration ... 133
9.5.1 Asset Management Strategies ... 135
9.5.2 Validation of Models ... 135
9.7 Findings... 137
9.8 Recommendations... 138
10.0 CONCLUSIONS... 140
10.1 Factors Impacting Pavement Marking Retroreflectivity ... 140
10.2 Retroreflectivity Degradation Models ... 141
10.3 Pavement Marking Asset Management System ... 141
11.0 RECOMMENDATIONS... 142
11.1 Pavement Marking Retroreflectivity Data Collection... 142
11.2 Glass Bead Density ... 142
11.3 Pavement Marking Management... 143
11.4 Future Research ... 143
12.0 IMPLEMENTATION AND TECHNOLOGY TRANSFER PLAN... 144
12.1 Research Products ... 144
12.2 Research Products Users ... 144
12.3 Research Products Application... 145
13.0 CITED REFERENCES ... 146
14.0 APPENDICES ... 152
14.1 Paint Retroreflectivity Data ... 152
14.2 Trip Reports ... 159
14.2.1 Signs and Pavement Markings Asset Management Meeting Notes... 159
14.2.2 Division 6 Traffic Services Meeting Notes... 161
14.2.3 State Road Maintenance Unit Meeting Notes... 162
14.2.4 Meeting with NCDOT Work Zone Traffic Control Unit ... 164
14.2.5 Meeting with NCDOT GIS/IT unit ... 165
14.2.6 Pavement Marking Rodeo Trip Report... 166
14.2.7 Division Six Paint Truck Operation Trip Report ... 168
14.2.8 National Workshop on Highway Asset Inventory and Data Collection Notes... 170
14.2.9 2009 TRB Annual Meeting Trip Report... 171
LIST OF FIGURES
Figure 2.1. Basic Principles of Pavement Marking Retroreflectivity...6
Figure 2.2. Pavement Markings on a Divided Four-lane Road...8
Figure 2.3. Pavement Markings on an Undivided Two-lane Road ...9
Figure 2.4. Predictive Trends for Newly Placed Pavement Marking ... 10
Figure 2.5. Predictive Trends for Existing Pavement Markings ... 11
Figure 2.6. Predictive Trends for Remarking and Snowplowing ... 11
Figure 2.7. Data Collecting Laser... 15
Figure 2.8. Average RL Values Over Time of Yellow Thermoplastics (Un-weighted) ... 20
Figure 2.9. Average RL Values Over Time of White Thermoplastics (Un-weighted) ... 21
Figure 2.10. Average Value Over Time of Yellow Thermoplastics (Weighted by Length)... 22
Figure 2.11. Average Value Over Time of White Thermoplastics (Weighted by Length) ... 23
Figure 3.1. NCDOT Paint Truck ... 32
Figure 3.2. Vehicle Travel, Paint Application, and RL Measurement Directions ... 33
Figure 3.3. Vehicle Travel, Paint Application, and Driver Line of Sight Directions ... 33
Figure 3.4. Retroreflectivity Measurement Directions* ... 34
Figure 3.5. Bead Embedment Illustration ... 35
Figure 3.6. Directionality Data Collection Map (Columbus County, NC) ... 41
Figure 4.1. Field Data Collection Site Layout... 48
Figure 4.2. A Typical Glass Bead Image ... 52
Figure 4.3. A Newly Applied Paint Pavement Marking Image ... 52
Figure 4.4. Glass Bead Embedment Scenarios... 53
Figure 4.5. Histogram of the Grayscale Image of Figure 4.2... 53
Figure 4.6. Randomly Selected Histogram ... 54
Figure 4.8. Algorithm Used in the Computer Aided Counting Method ... 56
Figure 4.9. Computer Aided Counting Process... 57
Figure 4.10. Marking Images with Very Low and Very High Bead Densities ... 59
Figure 4.11. Bead Density and Retroreflectivity Relationship... 59
Figure 5.1. Annual Average Temperature [USDOA, 2008] ... 65
Figure 5.2. Annual Mean Total Precipitation [USDOA, 2008] ... 65
Figure 5.3. Annual Mean Total Snowfall [NCDC, 2008]... 66
Figure 5.4. North Carolina Climate Regions... 66
Figure 5.5. White Edge Thermoplastic RL Readings... 69
Figure 5.6. White Skip Thermoplastic RL Readings... 69
Figure 5.7. Mean Retroreflectivity Data in the Three Areas... 72
Figure 6.1 NCDOT Road Profiler ... 76
Figure 6.2. Pavement Marking RL and Pavement IRI Correlation ... 77
Figure 7.1. Thermoplastic Model Residual Plot of Predicted Values ... 91
Figure 7.2. Thermoplastic Model Q-Q Plot ... 91
Figure 7.3. Residual Plot of the Predicted Values for Paints ... 93
Figure 7.4. Q-Q Plot for Residuals of Paints... 93
Figure 8.1. Paint Pavement Marking Retroreflectivity Plots (New Markings)... 109
Figure 8.2. Paint Pavement Marking Retroreflectivity Plots (Both New and Old Markings) ... 110
Figure 8.3. Scatterplot Matrix for White Edge New Markings ... 111
Figure 8.5. Prediction Accuracy Comparison ... 117
Figure 9.1. Transportation Asset Management System ... 123
Figure 9.2. Physical Relational Database Management System Model ... 126
Figure 9.3. Pavement Marking Database Schema ... 127
Figure 9.4. Pavement Marking Retroreflectivity Algorithm... 130
Figure 9.5. I-95 Actual RL Values for Yellow Edge Pavement Markings... 134
Figure 9.6. I-95 Actual and Predicted RL Values for Yellow Edge Pavement Markings... 136
Figure 14.1. Paint Data Collection Locations ... 154
LIST OF TABLES
Table 2.1. Pavement Marking Materials ...5
Table 2.2. NCHRP Study Summary ... 12
Table 2.3. Pavement Marking Accepted Service Life Matrix... 13
Table 2.4. Summary Statistics for Thermoplastics on Asphalt ... 19
Table 2.5. Average RL Values Over Time of Yellow Thermoplastics (Un-weighted)... 20
Table 2.6. Average RL Values Over Time of White Thermoplastics (Un-weighted)... 21
Table 2.7. Average RL Values Over Time of Yellow Thermoplastics (Weighted by Length) .... 22
Table 2.8. Average RL Values Over Time of White Thermoplastics (Weighted by Length) ... 23
Table 2.9. ANOVA F-test results for white & yellow thermoplastics (Un-weighted) ... 24
Table 2.10. ANOVA F-test results for white & yellow thermoplastics (Weighted) ... 25
Table 3.1. Centerline RL Readings for 35-73 Day Old Paint Markings ... 37
Table 3.2. Centerline RL Readings for 190-273 Day Old Paint Markings... 38
Table 3.3. Centerline RL Readings for 518-696 Day Old Paint Markings... 39
Table 3.4. Centerline RL Readings for 14-22 Day Old Paint Markings ... 39
Table 4.1. Gradations of Type I and Type II Glass Beads [AASHTO 2007] ... 47
Table 4.2. Bead Density and Retroreflectivity Values at Site 11 ... 58
Table 4.3. Bead Densities and Retroreflectivity Values ... 60
Table 5.1. Summary Climate Statistics in the Three Regions... 66
Table 5.2. White Edge Thermoplastic RL Readings ... 68
Table 5.3. White Skip Thermoplastic RL Readings ... 68
Table 5.4. ANOVA p-values of F Test Results for White Edge Thermoplastics ... 70
Table 5.5. ANOVA p-values of F Test Results for White Skip Thermoplastics ... 70
Table 5.7. Covariance Parameter Estimates ... 72
Table 5.8. Tests of Fixed Effects ... 73
Table 6.1. Pavement Marking RL and Pavement IRI Measurements ... 76
Table 7.1. Recommendations for Minimum Retroreflectivity Values [Turner 1998]... 80
Table 7.2. Summary of Modeling Studies... 84
Table 7.3. LOS Increments and NC Minimum Retroreflectivity Standards ... 86
Table 7.4. Effects Test for White Edge Using the F-Statistic ... 87
Table 7.5. RL Summary Statistics for Thermoplastics on Asphalt ... 88
Table 7.6. RL Summary Statistics for Paint... 88
Table 7.7. Consolidated Model Parameter Estimates ... 90
Table 7.8. White Middle Paint Parameter Estimates ... 92
Table 7.9. Predictive Estimate Compared to Summary of Validation Data ... 94
Table 7.10. Summary of Thermoplastic Pavement Marking Service Life by Category... 95
Table 1. White Edge New Pavement Marking RL Data... 105
Table 2. Yellow Center New Pavement Marking RL Data ... 106
Table 9.1. LOS Increments and NC Minimum Retroreflectivity Standards ... 122
Table 9.2. Summary of Retroreflectivity Degradation Models ... 123
Table 9.3. Process Input and Output for Pavement Marking Algorithm ... 131
Table 9.4. Predicted RL and Cost Data for I-95 Halifax Example... 137
Table 9.5. Simulator Parameter and Coefficient Estimate Values ... 137
Table 14.1. Paint Data Collection Location Information... 153
Table 14.3. Second Round Retroreflectivity Readings (in mcd/m2/lux)... 156
Table 14.4. Third Round Retroreflectivity Readings (in mcd/m2/lux) ... 157
Table 14.5. Fourth Round Retroreflectivity Readings (in mcd/m2/lux)... 158
1.0 INTRODUCTION
Pavement markings, like traffic signs, are considered to be traffic control devices having the function of controlling traffic and encouraging safe and efficient vehicle operation according to the American Association of State Highway and Transportation Officials (AASHTO). For highways and streets three general types of markings are in use: pavement markings, object markers, and delineators [AASHTO 2004]. Pavement markings include centerline stripes, lane lines, and edge lines. These may be supplemented by other pavement markings such as approaches to obstructions, stop and crosswalk lines, and various word and symbol markings [AASHTO 2004]. The Manual on Uniform Traffic Control Devices (MUTCD) for Streets and Highwaysspecifies that pavement markings are commonly placed using paint and thermoplastic materials although other suitable marking materials can also be used [FHWAa 2003].
Pavement markings generally have a shorter service life than the pavement on which the markings are applied. Markings need to be restriped when their retroreflectivity values fall below a minimum level. The first-time installation and later restriping of pavement markings bring a high maintenance cost to the transportation agencies. For example, the North Carolina Department of Transportation (NCDOT) is charged with managing all aspects of a 78,000-mile roadways system. Pavement markings cost NC approximately $14.5 million a year in contractor-performed work which represents two percent of the $700 million NCDOT highway maintenance budget [Sitzabee 2008]. Understanding pavement marking performances is important to maximize the material’s service lifecycle which can eventually reduce the costs of markings.
At the present time, no national standard specifies the minimum retroreflectivity levels below which the markings should be replaced. However, a Congressional mandate, section 406 of the 1993 Department of Transportation and Related Agencies Appropriations Act, directed the Secretary of Transportation to revise the MUTCD to include a standard for minimum levels of retroreflectivity that must be maintained for traffic signs and pavement markings [Vereen et. al. 2004]. The minimum retroreflectivity levels and maintenance methods for traffic signs were published in revision 2 of the 2003 version of the MUTCD. The final rule has been effective since January, 2008 [FHWA 2008]. The Federal Highway Administration (FHWA) is working with other research agencies to establish a similar minimum retroreflectivity standard for pavement markings.
1.1 Research Objectives
The NCDOT has collected several years of pavement marking retroreflectivity data through a private contractor, Precision Scan LLC. The intent of the data collection was to use the data as a quality control tool for managing a large amount of contractor applied pavement markings. With a large database now in hand, the NCDOT asked whether the data can be used to better understand the pavement marking performances.
The overall objectives of this research are to provide the NCDOT with a better understanding of pavement marking material performance; to maximize the material’s lifecycle and minimize replacing markings which still have sufficient retroreflectivity; and to help NCDOT meet the pending FHWA minimum requirements and reduce the liability of possible lawsuits.
This research focuses on four major problems. First, the impacts of several important factors (such as lateral location, directionality, region, and pavement roughness) on marking retroreflectivity are unclear. With two large datasets, we can determine if these factors have significant impacts on marking retroreflectivity. Second, we provide insights into the reasons why pavement markings lose retroreflectivity over time by determining the impact of bead density on paint marking retroreflectivity. Third, we evaluate existing degradation modeling techniques and establish useful retroreflectivity degradation models for both thermoplastic and paint pavement markings. Fourth, the study presents an integrated transportation asset management system framework for estimating the current and future condition of pavement markings
1.2 Research Scope
The scope of this research is the thermoplastic and paint longitudinal pavement markings on all roads open to public travel. The majority of marking materials in use are thermoplastics and paints. They are estimated to make up 89% of all marking materials in the US according to a survey by Migletz and Graham [2002]. In North Carolina, the NCDOT primarily uses four types of materials which are paint, thermoplastics, epoxy, and polyurea. More than 90% of its total marking mileages are thermoplastics and paint [NCDOT 2008]. The epoxy and polyurea are mainly applied on concrete pavement surfaces in the mountain region of the state.
Two main sources of retroreflectivity data have been pursued in this research. The first source of data was from the NCDOT Work Zone Traffic Control Unit (WZTCU). The NCDOT has been collecting pavement marking retroreflectivity data via mobile device (Laserlux) by a contractor, Precision Scan LLC. Nearly 30,000 lane miles of marking data were collected thought NC from May 2001 to July 2007. The collected data were mostly on thermoplastic markings. The paint markings were contractor-applied and the sample size of those was small in NCDOT database. The second source of retroreflectivity data were measurements of paint markings by the NCSU research team. The research team collected paint data on secondary roads in NC because they comprise the majority of roadways. Four rounds of paint data were collected by a handheld retroreflectometer LTL 2000 from November 2007 to May 2009.
Most studies during this research were therefore based on those two sources of data. Thermoplastic studies generally used the NCDOT data, while paint studies used NCSU data. Other sources of data, such as pavement roughness data collected by NCDOT pavement management unit, were also utilized in the analysis and were noted when they were used.
Though the NCDOT follows a typical pavement marking management procedure, readers should note that the direct results of this research (such as the retroreflectivity degradation models) may not be directly applicable to other geographic regions of US and other countries. The readers in other geographic regions could use the methodologies and procedures presented here. But, they need to use their own data and draw conclusions based on the data collected in their region. Though this research concentrates on the paint and thermoplastic material, the methodologies are also applicable to other types of marking materials (e.g. epoxy and polyurea).
1.3 Outcomes and Benefits
The results of this research are that the lateral location of pavement markings has a significant effect on marking retroreflectivity readings. The impact of directionality on paint pavement marking retroreflectivity is also found to be significant. Glass bead density is found to have a significant impact on marking retroreflectivity. Higher glass bead density leads to higher marking retroreflectivity. There is an impact of region (coast, central, and mountain) on thermoplastic pavement marking retroreflectivity but it is not statistically significant. Other important outcomes of this research are valid retroreflectivity degradation models for both thermoplastics and paints and a proposed integrated transportation asset management system for estimating the current and future condition of pavement markings.
The research outcomes will help the NCDOT better understand thermoplastic and paint pavement marking performance, which can lead to cost saving by maximizing the marking service lifecycle. The NCDOT can better allocate its limited equipment and personnel resources by using performance-based pavement marking management. The results of this research will provide a consistent measurement method and analysis procedure for marking retroreflectivity data, which can help transportation agencies to meet future FHWA minimum retroreflectivity standards and reduce their liabilities.
This research is also beneficial to future researchers. The collected retroreflectivity datasets can be used by others. The modeling method and procedure can be used to create models for other types of marking material or for markings in other geographic regions.
1.4 Report Organization
2.0 STATISTICAL VALIDATION OF THE EFFECT OF LATERAL LINE LOCATION ON PAVEMENT MARKING RETROREFLETIVITY DEGRADATION
This chapter focuses on the impact of lateral line location on pavement marking degradation over time. Previous studies have validated that color, material type, and surface type all impact pavement marking degradation. Current literature indicates that color, pavement surface, and material type, are all valid independent variables, which do affect the rate of change in pavement marking performance. However, the affect of lateral line location remains a question.
It is a common assumption that the lateral location has an effect on the rate of retroreflectivity degradation, and that the center line or center skip lines will degrade faster than edge lines due to traffic. However there is no evidentiary validation of this statement available in current literature. Specifically, this research used statistical analysis to determine whether lateral line location was a significant factor to be considered in degradation of pavement marking retroreflectivity.
This study will quantify the statistical significance of lateral line location on pavement marking degradation and presents the management implications. As will be discussed, the data used for the analysis was from a study conducted over a five-year period in NC and the analysis focused solely on yellow and white thermoplastic markings on an asphalt base course.
This study is one component of a larger study to determine long-term performance characteristics of pavement markings in NC and provide an asset management strategy. NCDOT has determined that it needs to develop an optimized pavement marking strategy that is performance based in order to maximize cost savings and prepare to comply with the impending Federal Highway standards. Data driven analysis, as advocated by Wilson-Orndoff, lays the foundation for using quantifiable measures to formulate pavement marking asset management strategies [2003]. The objective at the NCDOT is to formulate a pavement marking performance model that can accurately predict the life cycle of pavement markings and then use this in an asset management framework to accurately determine when each segment of road needs to be remarked. As previously determined, improvements in pavement marking quality is directly correlated with reduced probability of an accidents [Al-Masaeid and Sinha 1994].
2.1 Background
2.1.1 Pavement Marking Materials
According to the American Association of State Highway and Transportation Officials (AASHTO, 2004), pavement markings are defined as center stripes, lane lines, no-passing barriers, and edge striping. In all cases pavement markings refer to long-lines and should not be confused with object markings or delineators. The term lateral line location deals with the transverse location of the line along the pavement.
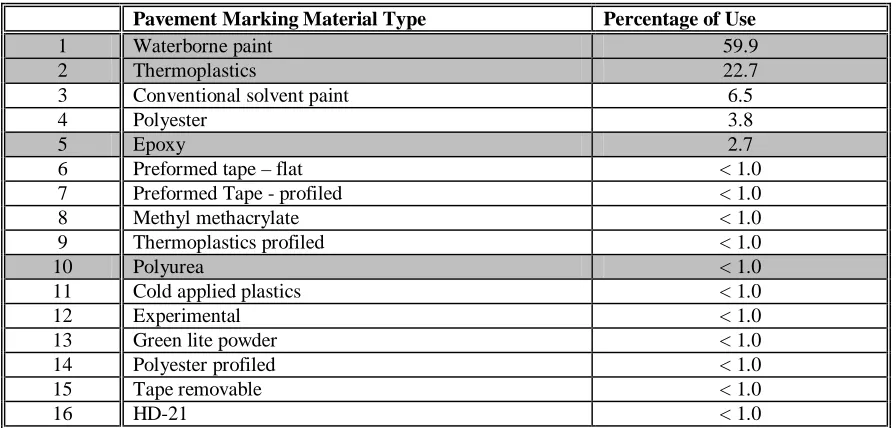
Pavement markings are first classified as durable and non-durable. Non-durable materials are expected to have a service life of one year or less, while durable materials should have a service life greater than one year. Non-durables are typically considered to be paint-based markers while most other materials fall under the durable classification. Table 2.1 lists the most common materials used in pavement markings across the US [Migletz and Graham 2002]. The most common pavement marking material is paint, which is typically replaced annually, based on need and transportation department budget cycles. The second most common material is a raised thermoplastic coating that is laid on top of the base material. Other common materials are polyesters and epoxy. The four materials currently in use by the NCDOT are paint, thermoplastics, epoxy, and polyurea. These are shaded in Table 2.1.
Table 2.1. Pavement Marking Materials
Pavement Marking Material Type Percentage of Use
1 Waterborne paint 59.9
2 Thermoplastics 22.7
3 Conventional solvent paint 6.5
4 Polyester 3.8
5 Epoxy 2.7
6 Preformed tape – flat < 1.0
7 Preformed Tape - profiled < 1.0
8 Methyl methacrylate < 1.0
9 Thermoplastics profiled < 1.0
10 Polyurea < 1.0
11 Cold applied plastics < 1.0
12 Experimental < 1.0
13 Green lite powder < 1.0
14 Polyester profiled < 1.0
15 Tape removable < 1.0
16 HD-21 < 1.0
[Adapted from Migletz and Graham, 2002] [Highlighted materials are currently in use in NC]
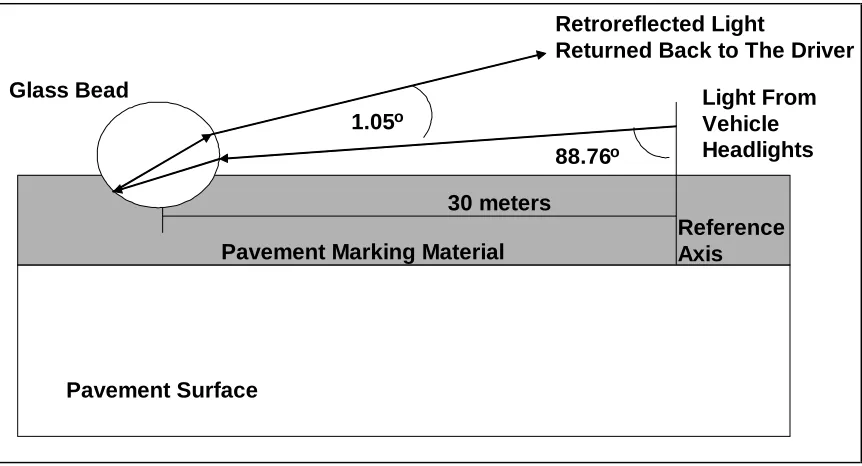
Pavement marking materials themselves provide a base line of retroreflectivity. However, the bulk of the retroreflectivity is achieved through the addition of glass beads embedded into the pavement marking material. Figure 2.1 illustrates the basic concept of retroreflectivity and shows how the light from a vehicle’s headlights is retroreflected off of a glass bead in the pavement marking back to the driver’s eye [ASTMa, 2005].
2.1.2 Retroreflectivity Measurement and Standards
The American Society for Testing Materials (ASTM) standard number E1710-05 describes the testing standards using portable retroreflective measurement devices to measure pavement-marking retroreflectivity, which is quantified by the coefficient of retroreflected luminance (RL) in units of millicandles/m2/Lux (mcd/m2/lx) [ASTMa 2005]. Current ASTM standards require a specific geometry commonly called the 30-meter geometry, which is designed to measure the retroreflectivity at a point 30 meters ahead of a vehicle. This is believed to be the point at which most drivers observe the roadway at night. Figure 2.1 was adapted from ASTM E 808 and shows the basic geometry required to evaluate retroreflectivity at 30-meter geometry [ASTMb 2005].
Pavement Surface
Light From Vehicle Headlights Retroreflected Light
Returned Back to The Driver
1.05o Glass Bead
30 meters
88.76o
Reference Axis
Pavement Marking Material
Figure 2.1. Basic Principles of Pavement Marking Retroreflectivity
Additionally, ASTM E 808 requires that all new pavement-marking materials have a minimum retroreflectivity value of RL equal to 250 mcd/m2/lux for white markings and an RL equal to 175 mcd/m2/lux for yellow markings [ASTMb 2005].
2.1.3 Retrorefelctivity Measurement Devices
Six retroreflectometers were evaluated by the Highway Innovative Technology Center (HITEC) and represent the six leading units used by transportation agencies [Texas Transportation Institute 2001]. Four of the six units were handheld devices and two were mobile units. All the units that were evaluated used 30-meter geometry to measure retroreflectivity. The Mirolux 12 was also evaluated but was left out of this summary because it uses 15-meter geometry, which is no longer acceptable under ASTM standards. The four handheld units evaluated were LTL 2000, MX30, MP-30, and FRT01. The two mobile units evaluated were the ECODYN and the Laserlux.
According to the HITEC summary, field tests verified that all six devices produce reliable results for measuring pavement marking retroreflectivity [Texas Transportation Institute, 2001]. The HITEC evaluation indicated that each unit comes with different capabilities and transportation agencies should evaluate the cost verses capability before deciding on which unit would be best to purchase for that agency. Ultimately, any of the six retroreflectometers mentioned would produce viable results [Texas Transportation Institute 2001].
Handheld verses mobile collection methods each have advantages and disadvantages as well. The handheld units are inexpensive but require a large crew for safety reasons in order to collect a small number of samples. Mobile devices are significantly more expensive but provide for a safer collection method and can collect continuous data throughout the system at highway speeds.
South Carolina conducted statisitcal tests on handheld and mobile collectin devices [Sarasua et. al. 2003]. The study evaluated handheld and mobile collection devices from a repeatability and reproducability standpoint. The analysis found good correlation between handheld units. Additionally, the study concluded that although the fit was not as good between handheld units and the mobile devices that trends were still apparent. Specifically, the study concluded that both the handheld units and mobile device were capable of grouping retrorefelctivity readings into low, medium, and high ranges. This was presented as a significant finding from a human factors stand point since slight variabtions in retrorefelctivity is not noticeable to the driver [Sarasua et. al., 2003].
2.1.4 Types of Lane Markings
2.1.5 Previous Research
There are two previous studies that are closely related to this one. The first study was sponsored by the South Carolina Department of Transportation (SCDOT) and published in 2003. It dealt with pavement marking degradation and examined the effects of surface type, marking material, marking color, and maintenance activities on markings. The second study was conducted by the National Cooperative Highway Research Program (NCHRP) from 1994 to 1998. It examined long-term pavement marking practices from across the nation. Both of these studies are examined in detail.
2.1.5.1 South Carolina Study
SCDOT supported a research project at Clemson University and The Citadel to evaluate the effective life cycle of pavement marking retroreflectivity over time [Sarasua, et. al., 2003]. This study was a response to the need of SCDOT for a pavement marking management strategy based on material performance. Additionally, SCDOT felt that a better understanding of pavement marking management was needed in order to comply with the expected implementation of new FHWA pavement marking minimum retroreflectivity standards. Their primary research objective was to develop predictive models that could estimate the rate of pavement marking degradation. These models could then be applied to an overall pavement markings management strategy.
Figure 2.3. Pavement Markings on an Undivided Two-lane Road
The project focused on SC interstate highways and evaluated pavement marking retroreflectivity performance during a 28-month period. Data were collected 6 times during this period at over 150 sites throughout SC’s interstate system. An average value was established for each time at each site from a series of 11 measurements taken with a handheld LTL-2000 retroreflectometer. Other retroreflectivity measurement devices were used during the research but only the data from the LTL-2000 were used in the analysis. Furthermore, researchers collected the data using a 30-meter geometry, as required in ASTM E 1710-97 [ASTMa, 2005].
During the data analysis portion of the research, retroreflectivity performance was determined using four major independent variables: surface type, marking material, marking color, and maintenance activities. Each variable was analyzed using regression analysis and was compared to the dependent variables. The dependent variables were the difference in RL values between two successive time periods, and the percent difference between the two successive time periods. Using these as dependent variables helped to account for the large variation across the data set. Several other independent variables were considered but only these four were determined statistically significant in their effect on the performance of the pavement markings over time. Traffic volume was one variable that was initially thought to impact performance but was later determined not to.
analysis resulted in the development of three predictive patterns that demonstrate how SC interstate highway marking materials perform over time. All three patterns are shown in Figures 2.5, 2.6, and 2.7 below. Note that units are not specified in these figures. They are only intended to show the general nature of the curve.
The first pattern, shown in Figure 2.4, demonstrates that the retroreflectivity of new pavement markings increased non-linearly during some initial time period after installation [Sarasua et. al., 2003]. This was due to a greater number of reflective beads being exposed as the marking began to initially wear. After this preliminary time period, retroreflectivity was found to decrease linearly over time with a slight asymptotic curve at the end [Sarasua et. al., 2003].
The second pattern, shown in Figure 2.5, illustrates retroreflectivity degradation for existing pavement markings [Sarasua et. al., 2003]. The initial value of the retroreflectivity for existing pavement marking systems was typically lower than for new markings and there was a noticeable absence of the initial upward increase in retroreflectivity values.
Finally, the last pattern, shown in Figure 2.6, followed the same trends as the first two models but with a noticeable shift in retroreflectivity values that was caused by maintenance activity [Sarasua et. al., 2003]. The shift was observed in two different ways based on the type of maintenance activity performed. First, a re-striping maintenance activity would reset the retroreflectivity value back to the retroreflectivity value of a new marking and then the curve would follow the same trend as the first model. Second, snowplowing caused a noticeable shift downward in the curve at the time the snowplowing occurred but the curve maintained the same linear downward trend after the activity was finished.
Figure 2.4. Predictive Trends for Newly Placed Pavement Marking
Figure 2.5. Predictive Trends for Existing Pavement Markings
Figure 2.6. Predictive Trends for Remarking and Snowplowing
2.1.5.2 NCHRP Synthesis
The NCHRP synthesis study took place from 1994 to 1998 [Migletz, et al., 2001] and its purpose was to evaluate the life of durable pavement markings. Limited evaluations of some waterborne paints were included in the study as a benchmark. The study collected data on 362 longitudinal (edge, center, & lane) pavement-marking lines from 85 sites across 19 states. The study collected data on 13 thermoplastic sites and the lengths ranged from 1 to 50 miles.
The NCHRP study used regression analysis to evaluate various materials and establish a predictive degradation curve of the material performance over time. Marking material type, road surface type, and marking material color were the independent variables evaluated. These were the same variables addressed in the SC study. Only maintenance activities were omitted from the FHWA study.
Results from the regression analysis indicate there was a great deal of variation in identical materials at different sites. The variation was attributed to differences in roadway type, region of
Time RL
Time RL
Time RL
Re-striping
the country, marking specifications, quality control, and winter maintenance. However, no comments were provided regarding the current age of the pavement markings when the study was performed. Thus, no statistically valid conclusions could be drawn. Still, the analysis did indicate that yellow lines performed better than white. Migletz attributed this to the use of a lower threshold of material expectations rather than to superior performance. Table 2.2 shows as summary of the results of the Migletz study.
In a follow up study, [Migletz et. al. 2001] established a service life matrix that provides degradation rates sorted by cumulative traffic passages (CTP) and elapsed months. Table 2.3, is an adaptation of this matrix and shows the average service life for each material type in months. The matrix is sorted by line color and type of marking material and provides an average service life and standard deviation in months. Additionally, the matrix gives a service life range in months. There is a large amount of deviation in the average service lives of the materials listed. Since this data collection spanned 19 different states, this variation was a product of regional diversity in traffic and weather conditions.
Nationally, the two most commonly utilized pavement-marking materials are waterborne paints and thermoplastics. Paints make up approximately 60 percent and thermoplastics make up approximately 23 percent (total 83 %) [Migletz and Graham, 2002]. From Table 2.3 we see that the average service life for these is as follows:
• 10.4 months for waterborne paint
• 26.2 months for white thermoplastics
• 27.5 months for yellow thermoplastics.
Table 2.2 summarizes all of the key parameters and findings of the NCHRP study. In particular, the variability in service life was drastic, as one can see from table 2.3. The remaining findings have been discussed.
Table 2.2. NCHRP Study Summary
Objective Develop retroreflectivity degradation rates for roadway pavement markings
Important Parameters
• Study was from 1994-1998
• Data were collected from 85 sites across 19 states
• Used a mobile collection device (Laserlux with 30-m geometry)
• Study focused on various durable pavement markings
Key Findings • Large variations in the shape of the degradation curves
• Regional changes influenced the shape of the curve for identical materials, and line type
• Matrix of service life degradation rates established based on unpublished data
• Average Life of waterborne paint is 10.4 months
• Average Life of thermoplastics is 26.2 months
• Average Life of polyurea is 24.7 months
• Average life of epoxy is 23.0 months
Table 2.3. Pavement Marking Accepted Service Life Matrix
Service Life In Elapsed Months Material No of Pavement
Marking Lines
Average Standard Dev Range
White Lines
Waterborne Paint 3 10.4 7.3 4.1 –18.4
Epoxy 18 23 17.1 1 - 56
Methyl methacrylate 7 14.4 7.6 6.8 – 29.3
Methyl methacrylate Profiled
9 21 13.4 7.8 – 43.2
Polyester 5 24.7 7.9 14.7 – 34.1
Polyester - Profiled 1 45.9 - 45.9 – 45.9
Thermoplastics 19 26.2 14.1 7.4 – 49.7
Thermoplastics - Profiled
14 23.8 12.8 4.7 – 55.7
Preformed Tape 11 27.4 13.6 11.7 – 60.0
Yellow Lines
Epoxy 15 34.3 14.6 12.6 – 57.8
Methyl methacrylate 4 16.8 4.2 12.6 – 20.5
Methyl methacrylate Profiled
5 25.0 6.0 18.1 – 32.8
Polyester 2 43.8 5.8 39.7 – 47.9
Polyester - Profiled 1 39.6 - 39.6 – 39.6
Thermoplastics 10 27.5 12.1 11.0 – 41.6
Thermoplastics - Profiled
8 26.7 10.3 17.8 – 50.7
Preformed Tape 7 30.6 11.9 19.6 – 53.4
[Adapted from Migletz et. al. (unpublished 2000), test without roadway lighting and raised retroreflective pavement markers]
2.2 Methodology
This section presents the methodology used for data collection and analysis in this study. An independent contractor hired by the NCDOT to measure retroreflectivity for specified NC roads collected the data for this study. The available data set was reduced to only those roads that used thermoplastic pavement markings. Furthermore, for the initial analysis, only those roads that had been under observation for a full five years were used.
First, an average value analysis was used to establish the initial findings using both weighted and un-weighted averages. Second, an analysis of variance (ANOVA) was used to confirm these findings with a more sophisticated statistical test. The ANOVA test method allowed use of the data from roads that had not yet been observed for the full five-year period, thus giving us a larger sample set to analyze.
2.2.1 Data Collection
collection effort took place from June 1999 through June 2006 and resulted in the collection of nearly 30,000 lane miles of data throughout N.C. Using the mobile device ensured that the data was taken over a broad portion of the road surface instead of just a single spot. NCDOT felt that eliminating the need for a technician to choose a specific spot, as is required with a handheld device, ensured that the collection remained objective.
The data collection device used in this study was a modified Laserlux mobile retroreflectometer mounted on a Chevy Suburban. Currently, ASTM standards are not published for measuring retroreflectivity using a mobile collection device but proposed methods are currently under review. In order to provide accurate readings that consider the current published ASTM standards, the contractor used an LTL-2000 handheld retroreflectometer and current ASTM procedures for handheld units in order to calibrate the Laserlux mobile retroreflectometer prior to each collection run. Each collection run consisted of a single road segment with segments being of varying lengths. Each segment was homogenous with respect to pavement marking material, material color, and road surface.
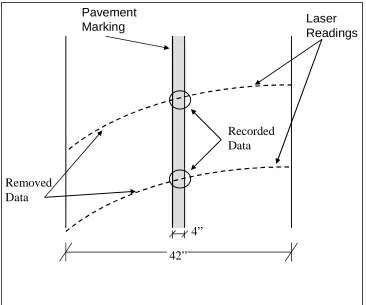
The retroreflectometer collected data using the standard 30-meter geometry by applying a 1/3 scale that measures approximately 10-m ahead of the vehicle. Figure 2.7 shows how a scanning laser measured a 42” wide swath that collected retroreflectivity values at a rate of 100 readings per second at a speed of 60 miles per hour. This equates to approximately 600 data points for a tenth mile road segment, which in turn translates to approximately 1 data reading for every 11 inches. The computer was set to collect values only within a given RL range. This enabled the computer to recognize very large or very small values and remove them from the recorded data used to calculate the average retroreflectivity value for the road segment. An example of a low value would be from a section of unmarked pavement. The computer would recognize that this value is outside the preset range and discard it. Reflective raised pavement markers would be an example of something that would return an especially high RL value and again the computer would discard this value as well.
42” 4”
Laser Readings Pavement
Marking
Recorded Data
Removed Data
Figure 2.7. Data Collecting Laser
The RL readings are averaged for every tenth of a mile and recorded into the onboard computer. Additionally, a continuous average was recorded throughout the entire roadway segment using all the valid data points that were determined to lie on the pavement marking. The RL value has units of mcd/m2/lx and is an average of all the valid scans recorded for a tenth-mile road segment. For a tenth-mile road segment there were approximately 600 data points evaluated but nearly 83 percent of the data are rejected because these values fell outside the preset range. This ensured only RL values for pavement markings were recorded and not the background RL for the road surface or for raised reflective pavement markers.
markings with known retroreflectivity values that were calculated using the LTL-2000. Having a known test bed enabled the maintenance crews to calibrate each unit to a known standard as well as to each other. The calibration process accounted for errors due to changes in vehicle load, tire pressure, and ambient light.
The LTL-2000 was also used in the field during collection operations. During field collection, the technicians measured the retroreflectivity of the test section at random points using an LTL-2000 and then calibrated the mobile unit using that same test section with the known retroreflectivity. Daily calibration accounted for local climate changes and minimized errors that may result from temperature and humidity.
2.2.2 Data Reduction
For purposes of this study, a road segment is defined as a portion of a road of varying length on which the base material, pavement marking system, and marking color are uniform and continuous. Segments measured in this study varied in length from 4 to 50 miles. The retroreflectometer took continuous readings while the vehicle was in motion and filtered out any invalid readings. All valid readings were averaged for every tenth mile and the average value recorded in the database. An overall average was then computed for each road segment. Segments were measured initially within 30 days of application of the pavement marking, then again after six months, and finally one year after application. Further readings were taken annually for five years, so that there were seven data points between the initial observation and the five-year mark.
Due to the ongoing nature of the data collection, only some of the road segments had a full compliment of data and most roads had been under observation for some period less than five years. As will be discussed further below, this fact limited the options for statistical analysis. Data received from the NCDOT consisted of retroreflectivity measurement for over 800 road segments in NC.
Analysis was only conducted on those roads that used molten thermoplastic pavement markings. Molten thermoplastics is a long-life pavement marking material that is a blend of solid materials that become liquid when heated and then return to a solid state when cooled. While paints are the most common marking material in NC and elsewhere, they are considered to be non-durable. NCDOT uses an annual cycle for remarking with paint. This means most of these segments were repainted multiple times during the study. Since this study took measurements annually, the recorded data for painted markings was not used to model the degradation process. Painted markings need to be observed on a monthly basis for 12 months for valid data. Thus roads with painted markings were removed from the analysis and only thermoplastic markings were analyzed.
initial retroreflectivity values that are typically different and because they both degrade at different rates [Sarasua, et al], analysis was conducted separately on each color.
Lateral line locations were categorized as either center or edge lines. Centerlines include both center solid lines and center skip lines. To ensure valid conclusions, comparisons were only made between center and edge lines of identical color. Thus white edge lines were compared to white skip lines and yellow edge lines were compared to yellow centerlines.
2.2.3 Average Value Analysis
To conduct an initial analysis, the data set on thermoplastics was reduced to only those points that had a full five years of data available. This dramatically reduced the size of the data set, but still left enough road segments to conduct the analysis. The number of segments for which data was usable was as follows:
• Yellow center lines versus yellow edge lines (28 versus 8 road segments)
• White skip lines versus white edge lines (14 versus 6 road segments)
Even with the reduced data set, this still represented 419 miles of roadway with white markings and 210 miles of roadway with yellow marking. For each measurement time period (time = 0 to 5 years), the average RL value was computed as:
RLave =[ ∑ ( RLi) ] / [ Nt ] where
RLave = average retroreflectivity for each time period in mcd/m2/lx RLi = measured retroreflectivity of road segment i in mcd/m2/lx
Nt = number of road segments measured for each category & time period.
A weighted average analysis was also conducted where the data was weighted based on the length of the road segment measured. Because the road segments did not have a uniform length, it is possible that the variation in segment length could skew the average value analysis. Road segments varied in length from 4 to 32 miles, with an average value of approximately 11 miles. The weighted analysis was conducted to determine if segment length affected the outcome of the analysis in any way. For each measurement time period (time = 0 to 5 years) the average weighted RL value was computed using an weighted average value method such that:
RLave =[ ∑ ( RLi * Li ) ] / [ ∑Li ] where
RLave = average retroreflectivity for each time period in mcd/m2/lx RLi = measured retroreflectivity of road segment i in mcd/m2/lx Li = length of road segment i in miles
2.2.4 Analysis of Variance
The average value analysis described above determined only that there may be a difference in the rates of retroreflectivity degradation based on lateral line location. But an ANOVA can accurately establish whether or not that difference is statistically significant. Analysis of variance (ANOVA) is a statistical procedure for determining whether the difference between two sample means is statistically significant. The procedure looks at the variance within the two populations to see if the difference between their respective means is due to normal variance within the groups or if it is due to a true difference between the two populations.
The null hypothesis (H0) stated that the difference between the centerline mean and the edge line mean was statistically insignificant. The alternative hypothesis (Ha) stated that the difference in the means between centerline and edge line was statistically significant. A probability of F-value less than α = 0.05 indicates that the null hypothesis should be rejected in favor of the alternative hypothesis and that the difference between the two means is statistically significant.
This approach was important because it allowed the use of all available data sets, not just those that had been under observation for five years. Due to the ongoing nature of the data collection activity, many of the road segments had been under observation for less than a full five years. Average value analysis as described above was only valid for comparing sets that had all been under observation for the entire time. ANOVA compares the data at a certain time interval to all the other data at the same time interval, allowing the use of road segments that had been under observation for less than a full five years to be studied. This meant that the sample size was different at each time interval and decreased as time went on.
Using all the available data on thermoplastic markings an ANOVA analysis was conducted at each time period for all data available at that time period. All the initial measurements (that is, time = 0) of yellow centerlines were compared to all the initial measurements of all yellow edge lines. Then the comparison was run at each successive time period using all available data in each time period. Because of the nature of the available data, the number of points analyzed was smaller in each successive time period. For both yellow and white markings, only about 25 percent of the total road segments had a full five years of data available. However, there were still enough road segments measured for a full five years that the results are considered to be sufficiently representative.
The ANOVA analysis used data from approximately 2,414 miles of NC roads out of a total of approximately 78,000 miles of primary and secondary roads. Thermoplastics markings are used on 22.7 percent of these roads, meaning that there are approximately 19,500 miles of road in NC marked with thermoplastics. Thus our sample size of 2,414 miles of road comprised approximately 12 percent of roads marked with thermoplastics. We consider this to be a sufficiently large enough sample size from which to draw our conclusions.
2.3 Results
This section presents the results of the data analysis. Table 2.4 shows an overall summary of the statistics for all of the data points used in the analysis. Next, the average value results are shown and then followed by the ANOVA results. Finally, these results are compared to those reported in previous literature.
2.3.1 Overall Summary Statistics
Table 2.4 shows the overall summary statistics for the data collected, which are thermoplastics on asphalt. The first column is time given in months. Columns two, three, and four are the average retroreflectivity value, standard deviation, and range of values all given in mcd/m2/lx.
Table 2.4. Summary Statistics for Thermoplastics on Asphalt
Time (months) Mean RL
(mcd/m2/lx)
Standard Deviation (mcd/m2/lx)
Range of Values (mcd/m2/lx)
0 365 103 168 - 563
6 324 82 201 - 473
12 319 85 163 - 488
24 235 75 110 – 443
36 212 67 93 - 383
48 223 62 88 - 364
60 222 75 98 - 389
2.3.2 Average Value Analysis (Un-weighted)
0
50
100
150
200
250
300
350
0
1
2
3
4
5
6
Time (years)
RL
(
m
c
d
/m
2 /l
x)
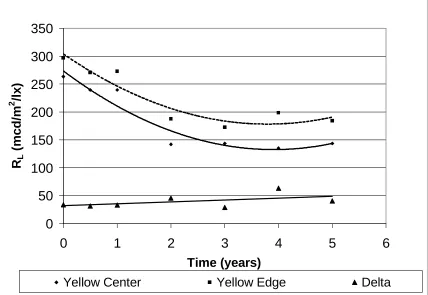
Yellow Center Yellow Edge Delta
Figure 2.8. Average RL Values Over Time of Yellow Thermoplastics (Un-weighted)
Table 2.5. Average RL Values Over Time of Yellow Thermoplastics (Un-weighted)
TIME (years) 0 0.5 1 2 3 4 5
Yellow Edge 297 271 273 188 173 199 184
Yellow Center 263 240 240 142 144 135 144
Delta 34 31 33 46 29 63 41
** Values given in mcd/m2/lux
-100.0 0.0 100.0 200.0 300.0 400.0 500.0
0 1 2 3 4 5 6
Time (years)
RL
(
m
c
d
/m
2 /l
x)
White Edge White Skip Delta
Figure 2.9. Average RL Values Over Time of White Thermoplastics (Un-weighted)
Table 2.6. Average RL Values Over Time of White Thermoplastics (Un-weighted)
TIME (years) 0 0.5 1 2 3 4 5
Yellow Edge 406 364 362 286 258 261 265
Yellow Center 467 382 352 242 204 231 229
Delta -61 -18 10 44 54 30 36
** Values given in mcd/m2/lux
2.3.3 Average Value Analysis (Weighted)
0 50 100 150 200 250 300 350
0 1 2 3 4 5 6
Time (years)
R
L
(
m
c
d
/m
2 /l
x)
YELLOW CENTER YELLOW EDGE DELTA
Figure 2.10. Average Value Over Time of Yellow Thermoplastics (Weighted by Length) Table 2.7. Average RL Values Over Time of Yellow Thermoplastics (Weighted by Length)
TIME (years) 0 0.5 1 2 3 4 5
Yellow Edge 282 272 287 205 181 201 206
Yellow Center 251 233 230 135 135 128 138
Delta 31 39 57 69 46 73 68
** Values given in mcd/m2/lux