Integration and Modularity of Quantitative Trait Locus Effects on
Geometric Shape in the Mouse Mandible
Christian Peter Klingenberg,*
,1Larry J. Leamy
†and James M. Cheverud
‡*School of Biological Sciences, University of Manchester, Manchester M13 9PT, United Kingdom,†Department of Biology, University of North Carolina, Charlotte, North Carolina 28223 and‡Department of Anatomy and Neurobiology,
Washington University School of Medicine, Saint Louis, Missouri 63110
Manuscript received September 9, 2003 Accepted for publication December 23, 2003
ABSTRACT
The mouse mandible has long served as a model system for complex morphological structures. Here we use new methodology based on geometric morphometrics to test the hypothesis that the mandible consists of two main modules, the alveolar region and the ascending ramus, and that this modularity is reflected in the effects of quantitative trait loci (QTL). The shape of each mandible was analyzed by the positions of 16 morphological landmarks and these data were analyzed using Procrustes analysis. Interval mapping in the F2generation from intercrosses of the LG/J and SM/J strains revealed 33 QTL affecting mandible shape. The QTL effects corresponded to a variety of shape changes, but ordination or a parametric bootstrap test of clustering did not reveal any distinct groups of QTL that would affect primarily one module or the other. The correlations of landmark positions between the two modules tended to be lower than the correlations between arbitrary subsets of landmarks, indicating that the modules were relatively independent of each other and confirming the hypothesized location of the boundary between them. While these results are in agreement with the hypothesis of modularity, they also underscore that modularity is a question of the relative degrees to which QTL contribute to different traits, rather than a question of discrete sets of QTL contributing to discrete sets of traits.
O
RGANISMAL form is a composite of many constit- and developmental determinants of morphological vari-ation in general (AtchleyandHall1991;Cheverud uent parts, and even single morphologicalstruc-tures may be assembled from multiple parts that have et al.1991;Hall1999, Chap. 20). The mandible origi-nates from neural crest cells in a sequence of interactive different embryonic origins or fulfill different functions.
processes that produce its elaborate spatial pattern To understand such complex morphological structures,
(TrainorandTam1995;Miyake et al.1997;Tomoet it is important to know to which degree they are
inte-al.1997;Chaiet al.2000;Fergusonet al.2000;Depew grated as a whole or subdivided into partially
autono-et al. 2002a,b; CobourneandSharpe 2003;Ramaesh mous modules that may correspond to functional or
de-andBard2003). Various signaling mechanisms take part velopmental subunits (Cheverud1996;Wagner 1996).
in this process and may contribute to the overall integra-Modules are units that are internally coherent due to
tion of the final structure (Francis-West et al. 1998; strong interconnection among their parts and relatively
Depewet al.2002b;CobourneandSharpe2003). While independent of other such units within a larger system.
the genes known to be involved in these signaling cas-For the genetic architecture of a modular structure, this
cades are possible candidates for loci that affect mor-implies that pleiotropic effects should be concentrated
phological integration, a host of other mechanisms may within modules but relatively weak among modules
also contribute to it, and any locus with pleiotropic
(Cheverud1996;Wagner1996;Wagnerand
Alten-effects on multiple parts of the mandible has the poten-berg1996;von DassowandMunro1999). The
devel-tial to affect the integration among them (Cheverud opmental processes that produce the structure are
1996;Wagner1996;Klingenberg2004). Therefore, it is prime factors mediating modularity and its effects on
advantageous to investigate the genetic basis of integration genetic architecture (Riska 1986; Cheverud 1996;
and modularity with an approach that uses the observed Hall1999;Davidson2001;Klingenberg2004).
phenotypic effects as a point of departure. The mouse mandible has long served as a model
A range of new possibilities for investigating the ge-system for complex structures and has contributed
sig-netic basis of integration and modularity of complex nificantly to an improved understanding of the genetic
morphological structures has become available through the methods for locating quantitative trait loci (QTL; e.g., Lynch and Walsh 1998; Mackay 2001; Weller 1Corresponding author:School of Biological Sciences, University of
2001). Several studies have examined the spatial
distri-Manchester, 3.614 Stopford Bldg., Oxford Rd., Manchester M13 9PT,
United Kingdom. E-mail: [email protected] bution of pleiotropic effects of QTL on measurements
taken in different parts of the mouse mandible (Bailey 1985, 1986; Cheverud et al. 1997; Mezey et al. 2000; Ehrichet al.2003). A different strategy is to examine the integration among traits by analyzing the covariation among traits, as has been done for phenotypic and genetic components of variation in populations (Cheverud1982; LeamyandAtchley1984;Leamy1993;Cheverud1995; KlingenbergandLeamy2001;Klingenberget al.2003). This approach can also be applied to analyze the pat-terns of effects of individual QTL on multiple traits. Multivariate methods for estimating patterns of QTL effects have been used to analyze covariation of differ-ent sets of distance measuremdiffer-ents (Leamy et al.1999; Ehrich et al. 2003) and inherently multidimensional phenotypes such as geometric shape (Klingenberget
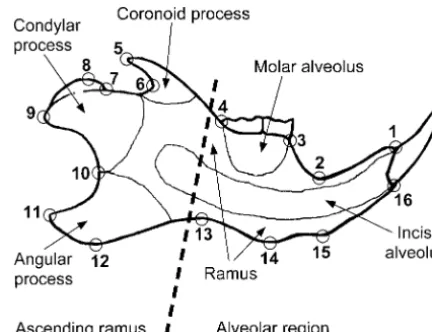
Figure 1.—Anatomical parts of the mandible and
land-al.2001;Workman et al.2002). marks used in this study. The dashed line indicates the
bound-Here we use an explicitly geometric approach to reas- ary between the alveolar region and the ascending ramus, sess the hypothesis that QTL effects on the mandible which are hypothesized to be the primary developmental mod-ules in the mandible (Cheverudet al.1997;Mezeyet al.2000; are modular, that is, that separate sets of QTL tend to
Klingenberget al.2003). affect either the alveolar region or the ascending ramus
(Figure 1; Cheverud et al. 1997; Mezey et al. 2000; Ehrichet al.2003). We analyze the shape changes
corre-the right hemimandible (Figure 1). In corre-the data set for corre-the F2 sponding to the QTL effects and interpret them in di- generation from both intercrosses combined, complete data rect relation to the anatomy of the mandible to assess were available for the mandibles of 954 mice.
the degree to which they are localized to these two Statistical analysis of shape:This study uses the methods of geometric morphometrics, which are based on an explicitly regions. We also examine how the QTL effects are
dis-geometric definition of shape as all those features of a land-tributed in the multidimensional shape space to test
mark configuration that are invariant to size, position, and whether there are distinct clusters of QTL according to orientation (
Bookstein 1991; Dryden and Mardia 1998). their effects on the different parts of the mandible. The size measure most widely used in geometric morphomet-Finally, as an explicit test of the hypothesized location rics is centroid size, which is the square root of the sum of squared distances of the landmarks of a configuration from of the boundary between modules, we compare the
co-their center of gravity (e.g.,DrydenandMardia1998, p. 24). variation between the alveolar region and ascending
To extract the shape information, the landmark configura-ramus with other possible partitions of the mandible
tions were superimposed by generalized least-squares Pro-into two sets of landmarks. These analyses add to and crustes superimposition and projected onto the shape tangent refine the methodology introduced in previous QTL space at the mean shape (DrydenandMardia1998;Rohlf 1999). The Procrustes method scales all the landmark config-analyses of shape (Klingenberget al.2001;Workman
urations to unit centroid size, translates them so that they have
et al.2002). The results shed new light on the hypothesis
a common center of gravity, and rotates them to an optimal fit of modularity of QTL effects in the mandible, which
according to a least-squares criterion (e.g., Klingenbergand we discuss in relation to the developmental mechanisms McIntyre1998). The variation remaining in the coordinates involved and the implications for genetic variation of of superimposed landmark configurations contains the
com-complex morphological structures. plete information about shape variation. The projection to
the tangent space (e.g.,Rohlf1999) is analogous to the projec-tion of the curved surface of the earth onto a flat map, because it renders linear the constraints imposed by the Procrustes fit. MATERIALS AND METHODS
Given the small amounts of shape variation in this analysis of intraspecific variation, the changes by this projection are
Experimental design and data acquisition: This study is
extremely small and their effects on the results are negligible. based on the analysis of the F2generation from a cross between
The coordinates resulting from the Procrustes superimposi-the Jackson Laboratory Large (LG/J) and Small (SM/J)
in-tion of configurain-tions and projecin-tion to tangent space can be bred strains (Cheverudet al.1996;Vaughnet al.1999). The
analyzed with the methods of multivariate statistics. For some analysis combines the data from two intercross experiments
procedures, such as canonical correlation (see below), adjust-that were carried out separately, each consisting of⬎500 F2
ments need to be made because the covariance matrices of the individuals (for details, see Vaughn et al. 1999). The two
Procrustes-aligned coordinates are not of full rank. Although intercross experiments used slightly different sets of
micro-there are 32 coordinates for the set of 16 landmarks in 2 satellite markers that covered all 19 autosomes. For intercross
dimensions, the resulting shape tangent space has only 28 1, there were 75 polymorphic markers in 55 intervals, whereas
dimensions because 4 d.f. are lost in the Procrustes superimpo-for intercross 2 there were 96 markers in 72 intervals (superimpo-for
sition: one for size, two for position, and one for orientation further details and a genetic map, see Vaughnet al. 1999,
(i.e., 4 dimensions are redundant). A simple solution to obtain Figure 1).
the appropriate dimensionality is to omit 4 coordinates The mandibles were exposed to dermestid beetles, cleaned,
which we did for the canonical correlation analysis for locating vary in both direction and magnitude, depending on the loca-tions of genotypic means in shape space. We emphasize that QTL (for further details, seeKlingenberget al.2001;
Work-manet al.2002). For analyses such as canonical correlation, this procedure does not make an a priori choice of shape variable before the interval mapping analyses.
where the effects of interest are scaled relative to within-sample
variation, this method has the same effect as other methods for In QTL analyses of shape, theaanddvectors are vectors in shape tangent space (Rohlf1999) and therefore are ame-adjusting dimensionality, such as using generalized inverses
(Dryden and Mardia 1998, p. 152). The complete set of nable to the techniques for analysis and graphical presentation that are used in geometric morphometrics. The length of the landmark coordinates was used for estimating the QTL effects
by multivariate regression and all subsequent analyses. vectors [e.g., ||a||⫽(a⬘a)0.5, where the prime denotes vector transposition] indicates the magnitude of the additive or dom-Before the QTL mapping, the data were corrected for the
effects of sex, dam, block, and litter size (Cheverudet al. inance effect, measured in units of Procrustes chord distance (e.g.,DrydenandMardia1998). The direction of eachaand 1996) as well as the effect of the intercross. The data used in
the subsequent analyses therefore correspond to the residuals dvector corresponds to the specific pattern of relative changes of landmark positions for the corresponding QTL effect. The from a linear model including all these effects.
Interval mapping and estimation of QTL effects:Interval aanddvectors were visualized by deformations of the outline
of a mandible using the thin-plate spline interpolation mapping was carried out for the complete data set, combining
the two intercrosses. Because each intercross used a slightly (Bookstein1989, 1991) and subjected to further multivariate analyses focusing on specific aspects of integration and modu-different set of microsatellite loci, genotypes at missing marker
loci were inferred from flanking markers using the Mapmaker larity of QTL effects. We decided to include the a and d vectors of all QTL with significant overall effects in the further 3.0b software (Landeret al.1987;Lincolnet al.1992).
Because shape is an inherently multidimensional pheno- multivariate analyses, even if tests for individual effects were not statistically significant. The reason for this was the limited type, we used a fully multivariate approach for interval
map-ping of QTL affecting shape. We applied the method proposed statistical power of these tests, particularly for thedvectors (for all but one QTL, the tests for dominance were only significant byLeamyet al.(1999) for interval mapping of multivariate
phenotypes, which is a generalization of the univariate method where ||d||⬎||a||), but we need to point out that the multivari-ate analyses of thedvectors need to be interpreted with some ofHaleyandKnott(1992) and is similar to the multivariate
least-squares method described byKnottandHaley(2000). caution.
Analyses of integration and modularity of QTL effects: At the location of the markers, additive genotypic scores were
set to⫺1, 0, and 1 and dominance genotypic scores were Hypotheses about morphological integration and modularity of QTL effects concern the patterns of coordinated shifts of set to 0, 1, and 0, respectively, for the SM/J homozygotes,
heterozygotes, and LG/J homozygotes. For locations between landmark positions for each QTL or the sets of QTL that have effects on landmarks belonging to the modules (Cheverud markers, at intervals of 2 cM, these scores were computed
from genotype probabilities inferred with the Mapmaker 3.0b 1996; Wagner1996; WagnerandAltenberg1996; Kling-enberget al.2003). These patterns can be examined by multi-program (Lander et al.1987;Lincolnet al.1992). At each
location, the additive and dominance genotype scores were variate analyses of variation among thea anddvectors. We used a combination of analyses to test different aspects of the related to the shape variables by canonial correlation (e.g.,
Mardiaet al.1979), and an approximate LOD statistic was hypothesis that the alveolar region and the ascending ramus are the two primary modules of the mandible (Figure 1;e.g., computed (Leamyet al.1999, 2000). Statistical significance of
the approximate LOD scores was assessed with a permutation Cheverudet al.1997;Mezeyet al.2000;Ehrichet al.2003). Some of these analyses explored the distribution of QTL in approach (ChurchillandDoerge1994), which was used to
determine empirical significance thresholds for each chromo- the multidimensional space defined by the a or d vectors, whereas others focused directly on the geometry of mandible some separately as well as for joint genome-wide tests (for
details, seeKlingenberget al.2001;Workmanet al.2002). shape changes induced by the QTL. Both approaches are complementary in that they provide information on different Confidence intervals for QTL locations were established using
the one-LOD rule (LynchandWalsh1998). aspects of integration and modularity of QTL effects.
Distribution of QTL effects in shape space:Cheverudet
In these analyses, the effects of QTL on other chromosomes
were taken into account by conditioning on marker loci (Jan- al.(1997; see alsoEhrichet al.2003) investigated how the statistically significant effects of QTL on interlandmark dis-sen 1993; Zeng 1994). For each chromosome for which a
QTL was found, we tested for the presence of a second QTL tances were distributed across the mandible. They found that many QTL had effects that were concentrated in either the (Leamyet al.1999;Klingenberget al.2001;Workmanet al.
2002). We tested for sex-specific QTL effects by scanning for ascending ramus or the alveolar region, but that only relatively few QTL had significant effects on both regions simultane-interaction of sex with additive and dominance effects
(parcel-ing out the main effects due to genotypic values, sex, and the ously. This conclusion was confirmed by a more formal statisti-cal analysis (Mezeyet al.2000).
appropriate conditioning variables). For chromosomes with
significant sex interactions, QTL were mapped in separate This finding that QTL tend to fall into groups according to their effects on different parts of the mandible may reflect analyses for males and females.
For each QTL with statistically significant overall effect, the differences in the distributions of the QTL effects in shape space. One possibility is that theaordvectors form distinct additive and dominance effects of the QTL were estimated
by means of multivariate regressions of the complete set of clusters of QTL corresponding to those groups. Such cluster-ing of QTL effects may arise as a consequence of develop-landmark coordinates on the additive and on the dominance
genotypic scores (for details, see Klingenberg et al. 2001; mental interactions of the pathways in which the respective genes take part, that is, epigenetic interactions that impart Workmanet al.2002). The results of these analyses are two
sets of regression coefficients for each QTL, the vectors of similar patterns of phenotypic effects on multiple QTL (Riska 1986; Klingenberg 2004). The alternative is that there is additive effects (a) and dominance effects (d), which are the
multivariate equivalents to theaanddcoefficients in univari- no clustering, but that the QTL effects are dispersed over orthogonal subspaces of shape tangent space that correspond ate QTL analyses (e.g.,FalconerandMackay1996). Because
variation, because clustered QTL effects would lead to greater Mardiaet al.1979, pp. 170–171). This statistic can take values between the extremes of zero for sets of variables that are stability of patterns of overall integration when allele
frequen-cies at the QTL change (Klingenberg2004). It is not entirely completely independent and one for sets of variables that are totally redundant. The squared trace correlation can be viewed clear whether the two-module hypothesis implies two clusters,
corresponding to the QTL with effects on the ascending ramus as a multivariate analog to the coefficient of determination familiar from univariate statistics, as it indicates the proportion and on the alveolar region, respectively, or whether there
might be an additional third cluster consisting of those QTL of total variance in one set of variables for which the other set can account (Hooper1959).
that have simultaneous effects on the entire mandible (
Chev-erudet al.1997; Ehrich et al.2003). Accordingly, we con- We assessed the statistical significance of covariation between modules with a randomization test (Good1994; Edgington ducted tests for the presence of either two or three clusters
among the additive and dominance effects of the QTL. 1995), which simulated the null hypothesis of independence between modules by randomly exchanging the two subsets of As a general exploratory analysis of the distribution of QTL
effects, we first performed separate multivariate ordinations landmarks among QTL for each of 10,000 permutation steps (KlingenbergandZaklan2000;Klingenberget al.2003). of theaanddvectors by principal component analysis (PCA;
e.g.,Jolliffe2002). These PCAs were based on the covariance Because the Procrustes fit superimposes all the landmark con-figurations, localized variation can be spread to other parts matrices of theaanddvectors, using the QTL as observations
and the landmark coordinates as the variables, and therefore of the configuration (e.g., critiques ofWalker2000;Leleand Richtsmeier 2001) and potentially inflate the covariation maintained the geometry and distances of shape tangent space
(Rohlf1999). Because the QTL effects are defined as vectors between modules. These possible effects of the Procrustes superimposition were taken into account by including a new of genotypic differences, we used the uncentered a and d
vectors to compute covariance matrices and principal compo- Procrustes fit in each permutation step (Klingenberget al.
2003). For this purpose, the mean shape vector was added to nent (PC) scores (the difference to the standard centered
covariance matrices was small, because the means ofaandd the vectors of QTL effects before the permutation test, because the mean shape is important for the Procrustes fit, but does vectors were very close to zero). The resulting plots of PC
scores are therefore simply a projection of the QTL effects on not affect the computation of the trace correlation. For each step, the two sets of landmarks were exchanged among QTL those axes that account for the maximal amount of variation
among QTL and provide an optimal summary of the total randomly, the resulting combined shapes were subjected to a Procrustes fit, and the squared trace correlation between variation in few dimensions. Because the PCs are directions
in shape space, specific shape changes are associated with modules was computed from the superimposed data and com-pared to the original value (Klingenberget al. 2003). This them, which can be displayed graphically and represent those
features of shape that vary the most among the QTL. analysis was carried out separately for the additive and domi-nance effects.
The degree of clustering of QTL effects in shape tangent
space was quantified by thek-means clustering method and Comparisons of alternative partitions:A further approach to test modularity in the QTL effects and the hypothesized tested statistically with a parametric bootstrap approach
(Klingenberget al.2001). Thek-means clustering algorithm location of the boundary between modules was based on the relative strength of covariation of landmark positions between searches for the partition of a sample of multivariate
observa-tions into a number of groups (g) that minimizes the total different subsets of landmarks (Klingenberg et al. 2003). Within each module, developmental interactions are expected sum of squares within groups (or equivalently, the ratio of
the total within-group sum of squares to the overall total sum to produce strong covariation among its component parts, whereas the relative independence of modules will result in of squares;e.g.,KrzanowskiandMarriott1995, p. 80). We
rank-means clustering analyses forg⫽2 andg⫽3, and we weaker covariation between parts that belong to different mod-ules (Cheverud1996; Klingenberg 2004). Therefore, if a used the ratio of the within-cluster sum of squares to the
overall total sum of squares as the measure for the degree structure consists of two separate modules and the total set of landmarks is divided into subsets accordingly, covariation of of clustering (these sums of squares were the totals over all
coordinates;cf.KlingenbergandMcIntyre1998). The re- landmark positions between these subsets should be relatively weak. In contrast, if the structure is partitioned in a manner sults of these analyses were tested against the null hypothesis
of a completely homogeneous distribution of theaordvec- that does not correspond to the boundary between its mod-ules, the strong covariation within modules will contribute to tors. The parametric bootstrap test (Efronand Tibshirani
1993) simulated this null hypothesis with a multivariate normal the covariation between these subsets, which therefore will be greater than that for the partition that corresponds to the distribution with a covariance matrix that had the same
eigen-values as the covariance matrix for the respective QTL effects true subdivision into modules. Therefore, it is possible to test the hypothetical boundary between modules by a comparison (Klingenberget al. 2001). These simulated data were then
entered into thek-means cluster analysis forg⫽2 andg⫽ of alternative partitions of a structure into subsets of landmarks (Klingenberget al.2003). Of all possible partitions, the divi-3, and the ratio of the within-cluster total sum of squares to
the overall total sum of squares was compared to the original sion corresponding to the true boundary between modules should yield the minimum covariation between subsets. data for 1000 simulation rounds.
Covariation between parts of the mandible:A different way We computed the trace correlation for all 6435 possible
partitions of the mandible into two subsets of eight landmarks to address the question of modularity is the covariation
be-tween landmarks in different parts of the mandible. To the and computed the trace correlation between subsets for each of them. These partitions included many that divided the extent that modules are distinct from each other, there should
be only relatively little covariation between them or, in the landmarks into subsets that were not spatially contiguous and therefore may not be a biologically realistic base of comparison extreme, they would be completely independent of one
an-other. In contrast, a morphological structure that consists for assessing modularity. Developmental modules have often been related to the concept of embryonic fields (e.g., David-of a single integrated module would show high covariation
between all its parts (KlingenbergandZaklan2000). son1993;Gilbertet al.1996;Wilkins2002, pp. 255–258), which are spatially delimited units of patterning involving signal-To quantify the covariation between subsets of landmarks,
tially contiguous subsets of landmarks. Because all the land- 28-dimensional variation in just 2 dimensions. The marks used in this study are arranged around the outline of shape features associated with the first two PCs con-the mandible (Figure 1), we compared all partitions of con-the
cerned primarily the ascending ramus, with various mandible in two subsets of eight landmarks each that were
changes in the relative sizes and arrangement of the contiguous along the outline.
mandibular processes, in particular the condyle and coronoid process (Figure 3, insets). Plots of PC scores showed a considerable amount of variation among QTL, RESULTS
but they provided no evidence for structured variation
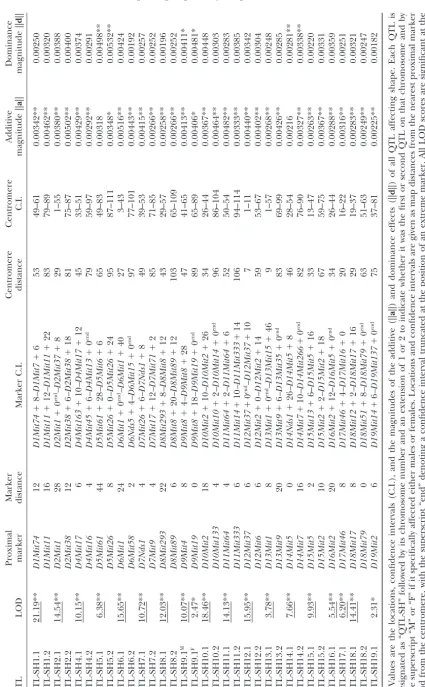
QTL for shape: The analyses located 33 QTL that
that would suggest distinct groups of QTL affecting dif-affected mandible shape, most of which were statistically ferent parts of the mandible (Figure 3).
significant at the genome-wide level (Table 1). These The statistical tests of clustering into two or three were distributed over all the autosomes, except for chro- groups did not provide evidence for structured variation
mosome 3. among theaanddvectors of the QTL. For the additive
The QTL effects displayed a variety of shape changes effects, the ratios of within-groups sums of squares to (Figure 2). Most of these shape changes consisted of a the overall total sums of squares were 0.835 forg⫽ 2 combination of relative shifts of neighboring landmarks (P ⫽ 0.95) and 0.717 for g ⫽ 3 (P ⫽ 0.92). For the relative to one another, often in opposite directions, dominance effects, the ratios were 0.831 forg⫽2 (P⫽ and therefore tend to be combinations of shape changes 0.88) and 0.743 for g ⫽ 3 (P ⫽ 0.97). These results at a small spatial scale, rather than global deformations indicate that the largest portion of the total variation of the whole mandible. Comparisons of the diagrams was within the groups of QTL and not among groups, of QTL effects (Figure 2) suggest that most QTL appear and the parametric bootstrap tests consistently sug-to be distinct in terms of their effects on overall man- gested that the tendency of QTL to fall into two or dible shape, and there are no groups of QTL with similar three groups was no stronger than would be expected for effects on shape. Moreover, comparison of the additive completely homogeneous data. Overall, therefore, there and dominance effects of the QTL indicates that there is no evidence for clustering among the QTL with respect is also no clear association between them; that is, the to their effects on distinct parts of the mandible. additive and dominance effects of a given QTL appear Covariation between modules: The covariation be-to be as different from each other as they are from the tween the alveolar region and the ascending ramus was
corresponding effects of different QTL. quantified by their squared trace correlation, which was
Comparison of landmark shifts in different regions 0.584 for the additive QTL effects and 0.571 for the domi-of the mandible indicated that QTL effects tended to nance effects. The permutation test, which included the be strongest for the landmarks of the ascending ramus step of Procrustes refitting in the permutation routine, and particularly for those in the condylar and coronoid produced a nonsignificant result both for the additive processes (Figure 2). In the condyle, both the arrange- QTL effects (P ⫽0.29) and for the dominance effects ment of the three landmarks in the condylar head and (P⫽ 0.52).
the overall length of the condyle varied. For the coro- The association between the alveolar region and as-noid process, variation concerned both its length and cending ramus for the QTL effects substantially exceeded arrangement in relation to neighboring parts of the that for phenotypic variation, which had a squared trace mandible. There was also variation in the direction and correlation of 0.294 (P ⬍ 0.0001 in the permutation robustness of the angular process, in the shape of the test with Procrustes refitting). This weaker correlation lower contour of the mandible, and in the arrangement indicates that the separation of modules is more marked
of the incisor and molar alveoli. at the phenotypic level and suggests that factors other
For all but a few QTL, there were simultaneous than these QTL contribute to uncorrelated variation in changes in most parts of the mandible, and a clear the two parts of the mandible. Moreover, this pheno-division into anterior and posterior modules was not typic correlation can serve as an upper bound for the immediately apparent from the shape changes corre- possible bias resulting from the Procrustes superimposi-sponding to these QTL effects (Figure 2). Artifacts from tion, because the trace correlations for the QTL effects the Procrustes fit can be ruled out as a possible origin of and the phenotypic trace correlation were computed these simultaneous effects, because the effects are mostly on the basis of the same Procrustes fit.
combinations of various small-scale shape changes and Comparison of alternative partitions of the mandible:
not shifts of single landmarks or small sets of landmarks To localize the boundary between modules in the
man-against the rest of the configuration. dible, we compared the covariation between the alveolar
Ordinations and tests for clustering of QTL effects: region and the ascending ramus to the covariation for
The first two PCs accounted for 40.9 and 38.6% of the other possible partitions of the mandible in two subsets total variation in the analyses of the additive and domi- of eight landmarks each. The expectation was that the nance effects, respectively. They are therefore a fairly covariation between the true modules should be lower
Of all 6435 possible partitions of the mandible into ods used in this study are particularly suited to visualize the QTL effects directly by graphical displays of the two groups of eight landmarks, the trace correlation
was equal to or less than the observed value 167 times corresponding shape changes (Figure 2; see also Kling-enberget al.2001; Workman et al. 2002). These dia-for the additive effects (2.60%) and 7 times dia-for the
dominance effects (0.11%). For the phenotypic shape grams show a diversity of patterns of landmark shifts, which vary in the degree to which they are localized to variation, which results from the aggregate effects of all
QTL and of environmental variation, the division into specific parts or spread over the entire mandible, in the directions of landmark changes, and in the combina-the alveolar region and combina-the ascending ramus yielded a
lower squared trace correlation than did any of the tions of the changes in different parts of the mandible. In comparison to our previous analysis (Klingenberg other partitions. These results clearly indicate that the
observed trait correlations are in the lower tail of the et al.2001), this greater diversity appears to be the result of the greatly improved spatial coverage of landmarks distribution of this statistic for all possible partitions and
therefore provide support for the hypothesized location (16 landmarks instead of 5). The recurrent patterns observed for many of the QTL in the earlier study, of the boundary between modules. It should be noted,
however, that the percentages indicated above should an opposite relative shift of the coronoid and angular processes in the anterior-posterior direction and a dorso-not be interpreted formally asP values for a statistical
test, because the many partitions in which the landmarks ventral compression or extension of the same two pro-cesses, can still be seen as part of many QTL effects are broken up into subsets that are not spatially
contigu-ous may not represent a null hypothesis that is biologi- and in the shape changes associated with the principal components of QTL effects (Figure 3), but they occur cally realistic (e.g., if modules are associated with
embry-onic fields). in combination with other changes that often are
con-siderably stronger (e.g., variation in the condylar pro-We separately compared the squared trace
correla-tions among just those alternative particorrela-tions that divided cess). Moreover, these large-scale deformations of the whole mandible are overlaid with localized movements the mandible into two subsets that were contiguous
along the outline of the mandible (Figure 4). For the of neighboring landmarks against each other, which correspond to anatomically localized expansions or con-additive QTL effects, there was one partition with a
squared trace correlation of 0.583 that was minimally tractions of mandibular parts. These combinations of effects appear to give each QTL a fairly distinctive pat-lower than the value of 0.584 for the partition into
alveolar region and ascending ramus. For the domi- tern.
There may be a different set of recurrent patterns in nance effect, thea prioripartition into alveolar region
and ascending ramus yielded the weakest covariation. the QTL effects, but these seem to concern smaller units of the mandible, such as the three processes of the For both the additive and dominance QTL effects, the
range of values of the squared trace correlation was ascending ramus or portions of the alveolar region each on its own, rather than the mandible as a whole. This fairly small, indicating that modularity of QTL effects
is a matter of degrees, rather than a contrast of complete level of the organization of the mandible, correspond-ing to distinct embryological origins and with different integration within modules and independence between
them. schedules of differentiation, has been emphasized in
earlier studies of morphological variation in the man-dible (AtchleyandHall1991;Ko¨ ntgesandLumsden DISCUSSION
1996;Miyake et al.1997; Tomo et al.1997; Ramaesh andBard2003). Because our data set contains only two The results of our analyses confirm and refine the
findings of previous studies that have reported a modu- or three landmarks for each of these units, however, the spatial resolution is again a factor limiting our ability lar structure of pleiotropic QTL effects on the
morphol-ogy of the mouse mandible. Most previous studies on to distinguish whether these are indeed recurring ele-ments of shape change in the mandible or whether each this subject have investigated the spatial distribution of
statistically significant QTL effects on distance measure- individual QTL produces characteristic effects in all these units. The answer to this question is of interest ments in the mandible (Bailey1985, 1986;Cheverud
et al.1997;Mezeyet al.2000;Ehrichet al.2003). This because it would indicate whether these morphological units behave as autonomous and coherent modules in study uses a complementary approach, employing
geo-metric morphogeo-metrics to quantify QTL effects on the terms of their contributions to the overall QTL effects. The possibility exists that some of the QTL effects shape of the mandible in direct relation to its anatomical
structure (Klingenberget al.2001). Here we have ex- found in this analysis are not the effects of a single locus, but the aggregate effect of two or more QTL in close tended this methodology to investigate modularity and
integration through multivariate analyses of QTL effects linkage. This problem is not unique to multivariate QTL studies, as it has been known from univariate studies and their joint variation within and between the
mod-ules of the mandible. (e.g.,FlintandMott2001;Mackay2001), but it is of
particular concern for studies of integration because it
meth-brings with it the potential to confound the analysis of matches that of our earlier study with fewer landmarks (Klingenberget al. 2001), suggesting that the failure the patterns of QTL effects. In particular, the apparent
individuality of QTL effects might in part be due to of that analysis to find distinct groups of QTL with different effects on mandible shape was not merely a various combinations of simpler QTL effects, and
ge-netic linkage between loci with effects on different mod- consequence of insufficient spatial resolution. Likewise, analyses of the localization and strength of QTL effects ules might lead to a systematic underestimate of the
separation of the modules. A possibility to address this on distances between landmarks in the mandible indi-cate a multitude of different patterns (Bailey 1985, problem in future studies is to use experimental designs
that have greater genetic resolution, such as advanced 1986;Cheverudet al.1997;Ehrichet al.2003). These results underscore that the QTL affecting shape varia-intercross lines (DarvasiandSoller1995) or
hetero-geneous stocks (Talbotet al.1999;Mottet al.2000). tion in the alveolar region and the ascending ramus of the mandible are not homogeneous in their effects, but Application of these more powerful methods will also
increase the number of QTL detected and thereby im- they are assemblages of loci whose effects are individu-ally distinct but more or less concentrated in different prove the power of statistical tests. We are optimistic
that these new approaches will overcome current meth- regions of the mandible.
Covariation between the two modules of the mandible, odological problems and will allow sensitive tests of the
question of whether there is individuality of QTL effects as measured by the squared trace correlation among the positions of landmarks in the two sets, was difficult or whether there are classes of QTL, perhaps
correspond-ing to sets of genes with related function in mandible to assess. The values of 0.584 and 0.571 computed for the additive and dominance effects of the QTL were development (e.g., Depew et al. 2002a; Cobourne and
Sharpe2003). fairly high, indicating that more than half of the total
variance was shared between modules. These
correla-Modularity of pleiotropic QTL effects:We used
multi-variate methods to test the hypothesis that QTL effects tions were not statistically significant in the permutation test that included an adjustment for the effects of the on shape reflect the modular structure of the mandible.
First, we examined whether distinct sets of QTL affect- Procrustes fit. It is likely, however, that this is a conse-quence of the low statistical power of this test with the ing the traits in the alveolar region and ascending ramus
are recognizable as distinct clusters according to their relatively small sample size of 33 QTL, which only slightly exceeds the 28 dimensions of the shape tangent effects on shape. Second, we quantified covariation
among landmark positions between the hypothesized space. In contrast, the phenotypic covariation between modules, computed over the 954 mice included in the modules, because true modules should correspond to a
partition of the mandible into subsets that have minimal study, was highly significant in the same statistical test, even though the value of the squared trace correlation covariation between each other. These are two distinct
but complementary aspects of modularity in QTL ef- was only 0.294. Altogether, these results point toward a moderate degree of covariation of QTL effects between fects, the first one focusing on the arrangement of QTL
in the multidimensional shape space and the second the two modules. It follows that the QTL are not divided neatly into groups of loci whose effects are limited to one emphasizing the expectation of relative
indepen-dence between modules. either the alveolar region or the ascending ramus, but
there is a tendency for the effects of QTL to be stronger No evidence for clustering of the QTL effects was
found in the multivariate ordination by principal com- in one or the other of the two modules.
As a test of the hypothesized location of the modular ponent analysis (Figure 3). Because it was not entirely
clear from previous studies whether the hypothesis of boundary between the alveolar region and the as-cending ramus, we compared the covariation among modularity predicts two clusters of QTL affecting the
two modules separately or whether there may be an alternative partitions of the mandible. This test provided evidence in favor of the hypothesis. The trace correla-additional third cluster of QTL with effects on both
modules simultaneously, we included both these possi- tions computed for QTL effects were clearly in the left tail of the distribution of the same statistic for all possible bilities in the formal test for clustering. However, the
parametric bootstrap tests did not provide any support partitions of the mandible. The comparisons that in-cluded only the partitions of the mandible into contigu-for either version of this hypothesis, as the degree of
clustering was just as strong in purely homogeneous ous subsets gave a somewhat ambiguous result for the additive effects because two different partitions yielded random data as among the QTL effects. This result
䉴
Figure3.—Multivariate ordination of QTL effects by PC analysis. The first two PCs for the additive (top) and
domi-nance effects (bottom) are shown, and the insets illustrate Figure4.—Comparison of covariation among alternative the shape changes associated with the PCs along each one of partitions of the mandible into two subsets of eight landmarks the axes in positive and negative directions. each. The diagrams show all such partitions that divide the landmarks into subsets that are contiguous along the outline of the mandible. The values are the squared trace correlations between subsets of landmarks for the additive (r2
A) and domi-nearly the same low trace correlation (Figure 4), but for nance (r2
D) effects of the QTL. The boxed diagram indicates the dominance effects the hypothesized division yielded thea prioripartition of the mandible into alveolar region and the lowest amount of covariation. Some of the uncer- ascending ramus (cf. Figure 1).
tainty in these analyses of covariance patterns may be due to the small sample size and high-dimensional varia-tion (33 QTL for a 28-dimensional shape tangent space)
one. QTL have manifold localized effects on smaller as well as sampling error in the estimates of QTL effects.
units within the two main modules, because positions It may therefore be no accident that the result for the
of neighboring landmarks shift relative to each other, phenotypic level of variation was much more clear-cut
and most QTL show a certain degree of overall integra-in this data set (sample size 954) and integra-in a similar study
tion in that they affect most parts of the mandible at of phenotypic variation (sample size 90;Klingenberg
least to some degree (Figure 2). In other words, for et al.2003). Overall, these results confirm the hypothesis
geometric shape in the mouse mandible, our results that the covariation of QTL effects between the alveolar
show that modularity is not complete, either in terms region and the ascending ramus is weaker than the
of integration within modules or in terms of parcellation covariation between arbitrary subsets of landmarks.
between modules (Wagner1996;Wagnerand Alten-In all these comparisons, the range of values for the
berg1996;Mezeyet al.2000). squared trace correlation was fairly narrow, suggesting
Overall, these results indicate that modularity of QTL that alternative partitions of the mandible differ in the
effects is a question of degrees rather than a black-amount of covariation between subsets, but not just in
or-white issue. These findings suggest a shift of perspec-the presence or absence of such covariation. The
alveo-tive from the dichotomy of QTL “with effects” or “with-lar region and ascending ramus are fairly coherent
inter-out effects” on sets of traits to an approach in which nally and relatively autonomous from each other, but
the effects of all QTL on the complete set of traits are that does not mean that each module would be
clearly have great advantages as heuristic models (e.g., experience very similar environmental conditions. Be-cause these asymmetries originate from random pertur-Gromko1995), they are unlikely to yield adequate
char-acterizations of real biological systems. Considering QTL bations arising within the developmental system, corre-lations of asymmetries must be based exclusively on direct effects in a quantitative manner is an inherently more
complex task, but in return such an approach will pro- interactions between developmental pathways and not on parallel variation (Klingenberg2003).
vide a richer and more subtle picture of the genetic
systems controlling morphological variation in real or- A study of correlations in the asymmetries of distance measurements in the mouse mandible found that asym-ganisms.
Developmental origin of pleiotropic effects: These metries were more strongly correlated within the
alveo-lar region and the ascending ramus than between them results concerning the modularity of QTL effects are
comparable to those obtained in a study that used analy- (Leamy1993), indicating that direct developmental in-teractions take place primarily within the two modules. sis of correlated asymmetry to infer the developmental
origin of covariation among landmarks in the mouse An analysis of shape asymmetry that used the same meth-ods and a similar set of landmarks as in the present mandible (Klingenberget al.2003). Although this
in-ference is based explicitly on variation from a nonge- study obtained results that are directly comparable to those of this analysis of QTL effects (Klingenberg et netic source, the resulting information on the
develop-mental basis of this variation can also be used to al.2003). Covariation between the alveolar region and ascending ramus was moderate for both asymmetry and understand the origin of pleiotropic effects of genes
involved in the system. variation among individuals (squared trace correlations
near 0.4). The comparison of alternative partitions Two broad classes of mechanisms that give rise to
covariation of morphological traits can be distinguished yielded the lowest squared trace correlations for the hypothesized modular boundary and showed that the (Klingenberg2003, 2004). On the one hand,
covaria-tion can originate from direct interaccovaria-tions between the values of the squared trace correlation between subsets varied over a limited range for the alternative partitions. developmental pathways that produce the traits of
inter-est. Examples of this class include the partitioning of a Overall, the patterns of covariation for asymmetry broadly agree with those found in the present analysis for QTL precursor tissue into two or more structures or inductive
signaling from one tissue to another (e.g.,Riska1986; effects in that they show an intermediate degree of mod-ularity and indicate the same location of the boundary Wilkins 2002). These interactions are often spatially
localized in morphogenetic fields (Davidson 1993, between modules. This correspondence of patterns raises the possibility that the interactions among devel-2001;Carroll et al.2001), which can be interpreted
as the embryonic precursors of morphological modules. opmental pathways, which produce the covariation of asymmetry, also may be the mechanisms that shape the An important characteristic of covariation from direct
developmental interaction is that variation is directly modular patterns of QTL effects.
Determining the precise mechanisms that generate transmitted from one pathway to another, and the
ef-fects of perturbations from within the pathway can be pleiotropic effects of individual QTL will require the identification of the genes responsible (FlintandMott passed along to be expressed in multiple “downstream”
traits simultaneously. A fundamentally different origin 2001;Mackay2001) as well as an understanding of the epigenetic processes that translate allelic variation of those of morphological covariation is the parallel variation of
separate pathways in response to variation in environ- genes into the observed phenotypic effects (Atchleyand Hall1991;Hall1999;Depewet al.2002b;Cobourne mental conditions or to allelic variation in a gene
in-volved in multiple pathways (Klingenberg2003, 2004). andSharpe2003;RamaeshandBard2003). While it is not possible to make inferences on the mechanism For instance, many genes play critical roles in multiple
developmental processes (Davidson2001;Wilkins2002) involved in the case of any single QTL without such de-tailed information, the similarity of the patterns of QTL and therefore have the potential to cause simultaneous
effects on these pathways that produce parallel variation variation found in this study to those for covariation of asymmetry (Klingenberget al.2003) suggests that, in in them. It is important to note that the mechanism of
parallel variation cannot transmit variation from within the aggregate, direct developmental interactions are re-sponsible for a considerable proportion of the patterns one of the pathways to the other (Klingenberg2003,
2004). of genic variation. Information on those developmental
interactions will therefore be of crucial importance for To distinguish these two origins of covariation,
exter-nal sources of variation should be eliminated by con- understanding QTL effects and the evolution of genetic architecture.
trolling rigorously against environmental and genetic variation, which eliminates parallel variation of separate pathways and leaves only covariation resulting from
di-rect interaction (Klingenberg2003). Perhaps the easi- LITERATURE CITED
est way to achieve this is to focus on fluctuating
asymme-Atchley, W. R., andB. K. Hall, 1991 A model for development
try, small random differences between the left and right and evolution of complex morphological structures. Biol. Rev. 66:101–157.
Bailey, D. W., 1985 Genes that affect the shape of the murine Good, P., 1994 Permutation Tests: A Practical Guide to Resampling
Meth-mandible: congenic strain analysis. J. Hered.76:107–114. ods for Testing Hypotheses. Springer-Verlag, New York.
Bailey, D. W., 1986 Genes that affect morphogenesis of the murine Gromko, M. H., 1995 Unpredictability of correlated response to mandible: recombinant-inbred strain analysis. J. Hered. 77: selection: pleiotropy and sampling interact. Evolution49:685–
17–25. 693.
Bookstein, F. L., 1989 Principal warps: thin-plate splines and the Haley, C. S., andS. A. Knott, 1992 A simple regression method decomposition of deformations. IEEE Trans. Patt. Anal. Mach. for mapping quantitative trait loci in line crosses using flanking Intell.11:567–585. markers. Heredity69:315–324.
Bookstein, F. L., 1991 Morphometric Tools for Landmark Data: Geometry Hall, B. K., 1999 Evolutionary Developmental Biology. Kluwer,
Dor-and Biology. Cambridge University Press, Cambridge, UK. drecht, The Netherlands.
Bookstein, F. L., 1996 Combining the tools of geometric morpho- Hooper, J. W., 1959 Simultaneous equations and canonical correla-metrics, pp. 131–151 inAdvances in Morphometrics, edited by L. F. tion theory. Econometrica27:245–256.
Marcus, M.Corti, A.Loy, G. J. P.Naylor and D. E.Slice. Jansen, R. C., 1993 Interval mapping of multiple quantitative trait Plenum Press, New York. loci. Genetics135:205–211.
Carroll, S. B., J. K. GrenierandS. D. Weatherbee, 2001 From Jolliffe, I. T., 2002 Principal Component Analysis. Springer-Verlag,
DNA to Diversity: Molecular Genetics and the Evolution of Animal New York.
Design. Blackwell Science, Malden, MA. Klingenberg, C. P., 2003 Developmental instability as a research
Chai, Y., X. Jiang, Y. Ito, P. Bringas, Jr., J. Hanet al., 2000 Fate of tool: using patterns of fluctuating asymmetry to infer the develop-the mammalian cranial neural crest during tooth and mandibular mental origins of morphological integration, pp. 427–442 in Devel-morphogenesis. Development127:1671–1679. opmental Instability: Causes and Consequences, edited by M.Polak.
Cheverud, J. M., 1982 Phenotypic, genetic, and environmental mor- Oxford University Press, New York.
phological integration in the cranium. Evolution36:499–516. Klingenberg, C. P., 2004 Integration, modules and development:
Cheverud, J. M., 1995 Morphological integration in the saddle-back molecules to morphology to evolution, pp. 213–230 inPhenotypic tamarin (Saguinus fuscicollis) cranium. Am. Nat.145:63–89. Integration: Studying the Ecology and Evolution of Complex Phenotypes,
Cheverud, J. M., 1996 Developmental integration and the evolution edited by M.Pigliucciand K.Preston. Oxford University Press, of pleiotropy. Am. Zool.36:44–50. New York.
Cheverud, J. M., S. E. Hartman, J. T. Richtsmeier and W. R. Klingenberg, C. P., andL. J. Leamy, 2001 Quantitative genetics of Atchley, 1991 A quantitative genetic analysis of localized mor- geometric shape in the mouse mandible. Evolution55:2342– phology in mandibles of inbred mice using finite element scaling. 2352.
J. Craniofac. Genet. Dev. Biol.11:122–137. Klingenberg, C. P., andG. S. McIntyre, 1998 Geometric
morpho-Cheverud, J. M., E. J. Routman, F. A. M. Duarte, B. van Swinderen, metrics of developmental instability: analyzing patterns of fluctu-K. Cothran et al., 1996 Quantitative trait loci for murine ating asymmetry with Procrustes methods. Evolution52:1363– growth. Genetics142:1305–1319. 1375.
Cheverud, J. M., E. J. RoutmanandD. J. Irschick, 1997 Pleiotropic Klingenberg, C. P., andS. D. Zaklan, 2000 Morphological integra-effects of individual gene loci on mandibular morphology. Evolu- tion between developmental compartments in the Drosophila tion51:2006–2016. wing. Evolution54:1273–1285.
Churchill, G. A., andR. W. Doerge, 1994 Empirical threshold Klingenberg, C. P., L. J. Leamy, E. J. RoutmanandJ. M. Cheverud, values for quantitative trait mapping. Genetics138:963–971. 2001 Genetic architecture of mandible shape in mice: effects
Cobourne, M. T., andP. T. Sharpe, 2003 Tooth and jaw: molecular of quantitative trait loci analyzed by geometric morphometrics. mechanisms of patterning in the first branchial arch. Arch. Oral Genetics157:785–802.
Biol.48:1–14. Klingenberg, C. P., K. MebusandJ.-C. Auffray, 2003
Develop-Darvasi, A., and M. Soller, 1995 Advanced intercross lines, an mental integration in a complex morphological structure: How experimental population for fine genetic mapping. Genetics141: distinct are the modules in the mouse mandible? Evol. Dev.5:
1199–1207.
522–531.
Davidson, E. H., 1993 Later embryogenesis: regulatory circuitry in Knott, S. A., and C. S. Haley, 2000 Multitrait least squares for morphogenetic fields. Development118:665–690.
quantitative trait loci detection. Genetics156:899–911.
Davidson, E. H., 2001 Genomic Regulatory Systems: Development and
Ko¨ ntges, G., andA. Lumsden, 1996 Rhombencephalic neural crest
Evolution. Academic Press, San Diego.
segmentation is preserved throughout craniofacial ontogeny.
De-Depew, M. J., T. LufkinandJ. L. R. Rubenstein, 2002a Specification
velopment122:3229–3242. of jaw subdivisions byDlxgenes. Science298:381–385.
Krzanowski, W. J., andF. H. C. Marriott, 1995 Multivariate
Analy-Depew, M. J., A. S. TuckerandP. T. Sharpe, 2002b Craniofacial
sis. Part 2. Classification, Covariance Structures and Repeated
Measure-development, pp. 421–498 inMouse Development: Patterning,
Mor-ments. Arnold, London.
phogenesis, and Organogenesis, edited by J.Rossantand P. P. L.
Lander, E. S., P. Green, J. Abrahamson, A. Barlow, M. Daley Tam. Academic Press, San Diego.
et al., 1987 MAPMAKER: an interactive computer package for
Dryden, I. L., andK. V. Mardia, 1998 Statistical Analysis of Shape.
constructing primary genetic linkage maps of experimental and Wiley, Chichester, UK.
natural populations. Genomics1:174–181.
Edgington, E. S., 1995 Randomization Tests. Marcel Dekker, New
Leamy, L., 1993 Morphological integration of fluctuating asymmetry York.
in the mouse mandible. Genetica89:139–153.
Efron, B., andR. J. Tibshirani, 1993 An Introduction to the Bootstrap.
Leamy, L., andW. R. Atchley, 1984 Morphometric integration in Chapman & Hall, New York.
the rat (Rattussp.) scapula. J. Zool.202:43–56.
Ehrich, T. H., T. T.Vaughn, S. F. Koreishi, R. B.Linsey, L. S.
Leamy, L. J., E. J. RoutmanandJ. M. Cheverud, 1999 Quantitative
Pletscheret al., 2003 Pleiotropic effects on mandibular
mor-trait loci for early- and late-developing skull characters in mice: phology I. Developmental morphological integration and
differ-a test of the genetic independence model of morphologicdiffer-al inte-ential dominance. J. Exp. Zool. Mol. Dev. Evol.296B:58–79.
gration. Am. Nat.153:201–214.
Falconer, D. S., andT. F. C. Mackay, 1996 Introduction to
Quantita-Leamy, L. J., D. Pomp, E. J. EisenandJ. M. Cheverud, 2000
Quanti-tive Genetics. Longman, Essex, UK.
tative trait loci for directional but not fluctuating asymmetry of
Ferguson, C. A., A. S. TuckerandP. T. Sharpe, 2000
Temporo-mandible characters in mice. Genet. Res.76:27–40. spatial cell interactions regulating mandibular and maxillary arch
Lele, S. R., andJ. T. Richtsmeier, 2001 An Invariant Approach to
patterning. Development127:403–412.
Statistical Analysis of Shapes. Chapman & Hall/CRC, New York/
Flint, J., andR. Mott, 2001 Finding the molecular basis of
quantita-Boca Raton, FL. tive traits: successes and pitfalls. Nat. Rev. Genet.2:437–445.
Lincoln, S., M. DalyandE. Lander, 1992 Constructing Genetic Maps
Francis-West, P., R. Ladher, A. BarlowandA. Graveson, 1998
With MAPMAKER/EXP 3.0. Whitehead Institute Technical Re-Signalling interactions during facial development. Mech. Dev.
port, Whitehead Institute, Cambridge, MA.
75:3–28.
Lynch, M., andB. Walsh, 1998 Genetics and Analysis of Quantitative
Gilbert, S. F., J. M. OpitzandR. A. Raff, 1996 Resynthesizing
Mackay, T. F. C., 2001 The genetic architecture of quantitative and neural crest cells of the mouse embryo: co-distribution in the craniofacial mesenchyme but distinct segregation in the traits. Annu. Rev. Genet.35:303–339.
Mardia, K. V., J. T. KentandJ. M. Bibby, 1979 Multivariate Analysis. branchial arches. Development121:2569–2582.
Vaughn, T. T., L. S. Pletscher, A. Peripato, K. King-Ellison, E.
Academic Press, London.
Mezey, J. G., J. M. CheverudandG. P. Wagner, 2000 Is the geno- Adamset al., 1999 Mapping quantitative trait loci for murine growth: a closer look at genetic architecture. Genet. Res. 74:
type-phenotype map modular?: A statistical approach using
mouse quantitative trait loci data. Genetics156:305–311. 313–322.
Von Dassow, G., and E.Munro, 1999 Modularity in animal
develop-Miyake, T., A. M. CameronandB. K. Hall, 1997 Stage-specific
expression patterns of alkaline phosphatase during development ment and evolution: elements of a conceptual framework for EvoDevo. J. Exp. Zool. Mol. Dev. Evol.285:307–325.
of the first arch skeleton in inbred C57BL/6 mouse embryos. J.
Anat.190:239–260. Wagner, G. P., 1996 Homologues, natural kinds and the evolution of modularity. Am. Zool.36:36–43.
Mott, R., C. J. Talbot, M. G. Turri, A. C. CollinsandJ. Flint,
2000 A method for fine mapping quantitative trait loci in out- Wagner, G. P., andL. Altenberg, 1996 Complex adaptations and the evolution of evolvability. Evolution50:967–976.
bred animal stocks. Proc. Natl. Acad. Sci. USA97:12649–12654.
Ramaesh, T., andJ. B. L. Bard, 2003 The growth and morphogene- Walker, J. A., 2000 Ability of geometric morphometric methods to estimate a known covariance matrix. Syst. Biol.49:686–696. sis of the early mouse mandible: a quantitative analysis. J. Anat.
203:213–222. Weller, J. I., 2001 Quantitative Trait Loci Analysis in Animals. CABI
Riska, B., 1986 Some models for development, growth, and morpho- Publishing, Wallingford, UK.
metric correlation. Evolution40:1303–1311. Wilkins, A. S., 2002 The Evolution of Developmental Pathways. Sinauer
Rohlf, F. J., 1999 Shape statistics: Procrustes superimpositions and Associates, Sunderland, MA.
tangent spaces. J. Classif.16:197–223. Workman, M. S., L. J. Leamy, E. J. RoutmanandJ. M. Cheverud,
Talbot, C. J., A. Nicod, S. S. Cherny, D. W. Fulker, A. C. Collins 2002 Analysis of quantitative trait locus effects on the size and
et al., 1999 High-resolution mapping of quantitative trait loci shape of mandibular molars in mice. Genetics160:1573–1586. in outbred mice. Nat. Genet.21:305–308. Zeng, Z-B., 1994 Precision mapping of quantitative trait loci.
Genet-Tomo, S., M. OgitaandI. Tomo, 1997 Development of mandibular ics136:1457–1465. cartilages in the rat. Anat. Rec.249:233–239.