Comparison of Theoretical and Measured
Acceleration Due to Gravity
Mujahid Hassan Sani1, Jamilu Tijjani Baraya2, Sunusi Mohammed Mu’awuya3, Auwal Abdulkarim4
P.G. Student, Department of Physics, Jodhpur National University, Jodhpur, Rajasthan, India1 P.G. Student, Department of Physics, Jodhpur National University, Jodhpur, Rajasthan, India2 P.G. Student, Department of Physics, Jodhpur National University, Jodhpur, Rajasthan, India3 P.G. Student, Department of Physics, Jodhpur National University, Jodhpur, Rajasthan, India4
ABSTRACT: The earth gravity pulls everything on or near the planet towards its centre. The force responsible for this pull is called the gravitational force and it varies from place to place. This paper work presents the experimental value of theoretical acceleration due to gravity g which was obtained in five (5) different locations and their average was also obtained as 9.655678 m/s2, also the value of theoretical acceleration due to gravity g was obtained in that five (5) different locations where their average was obtained as 9.7897034 m/s2. By comparing the two it was found that the theoretical value leads the experimental value by 0.1340254 m/s2 which were due to experimental errors.
KEYWORDS: Acceleration, pendulum bob, latitude, Altitude
.
I. INTRODUCTION
The acceleration due to gravity is the most fundamental parameter in Physics. The motion of object on the earth’s surface, atmosphere, etc. is governed by the earth’s gravity. Earth’s gravity is the force with which the earth attracts the object towards its centre. If the object is free to move under the effect of this force, it continues to move with certain value of acceleration, called the acceleration due to gravity and symbolized by the letter ‘g’. In recent years, people developed very precise instruments like gravimeters with resolution of 1 in 106 for accurate determination of local gravity. The underlying principle on all these sophisticated instruments is either the principle of pendulum or time of fall of an object. But all parameters are measured precisely. The main objective is to minimize all the errors that are usually encounter in all scientific experiment. Another way of minimizing errors, is to repeat the number of observations to suitable till a pattern of stability of data distribution and then draw conclusion from these data by using standard laws of statistics [1]. Gravitational acceleration is the acceleration of an object caused by gravity. Neglecting friction such as air resistance, all small bodies accelerate in a gravitational field at the same rate relative to the centre of mass. This equality is true regardless of the masses or compositions of the bodies. At different points on earth, objects fall with the acceleration between 9.78 and 9.8 m/s2 depending on latitude, with a conventional standard value of exactly 9.80665 m/s2.There are also three laws of gravitation which include Newton’s law of gravitation, Kepler’s law of gravitation, and Gauss’s law for gravity. The law of universal gravitation was originally formulated by Sir Isaac Newton when he was studying the motion of the planets around the sun [2].
It is well known that if the effects of air resistance are ignored, any object dropped in the vicinity of Earth’s surface will move with constant acceleration g. The direction of g is down, towards Earth’s center and its magnitude is approximately 9.8 m/s2. The motion of freely falling objects is one dimensional motion with constant acceleration. In general, an object moving with an initial velocity and a constant acceleration a, obeys the following kinematic equation (1):
∆ = +1
2 (1)
where ∆ is the displacement of the object in time t. For an object initially at rest falling in a gravitational field, equation (1)reduces to:
ℎ=1
where h is the vertical displacement or height [3]. Therefore if we have means of measuring height and time of the free fall for any object, then the acceleration due to gravity can be easily determine by using equation (2).
II. MATERIALS AND METHOD
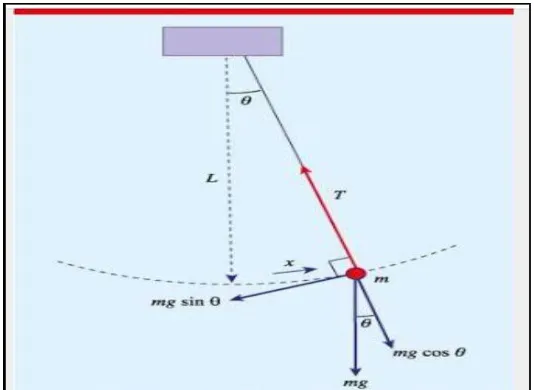
The materials used during the experiment are pendulum bob, wooden stand, thread, digital stop watch, global positioning system device as well as the meter rule. The set-up for the experiment was such that a pendulum bob was suspended from a point at the top of a wooden stand with the aid of a thread. The height of the pendulum bob above the floor was measured using meter rule. The pendulum bob when given an initial push, it will swing back and forth at constant amplitude through a small angle θ as shown in Fig. 1 and the time for 20 complete oscillations of the pendulum bob was recorded. Without altering the set-up, the experiment was repeated and the mean (average) was calculated. 10cm of the thread was cut out in each case and the experiment was repeated for six more heights of the pendulum bob above the floor. The period of oscillation T and the height h of the bob at each location were measured and noted.
Figure 1 is a schematic diagram of a simple pendulum showing forces acting on the bob: the tension T in the rod and the gravitational force .
III. THEORY
A. Acceleration due to Gravity
It is true that a mass falls to the ground with increasing velocity, and the rate of the increase is called acceleration due to gravity (g), or gravitational acceleration. When an object falls to the ground under the action of gravity, experience shows that the object has a constant acceleration. The great philosopher Aristotle taught that the speed with the body falls to the ground depends on its mass. This was the assertion until about 400 years ago when an Italian scientist called Galileo tested the truth of the matter by a simple experience. He performed this historical experiment by dropping a heavy object and a length from a top of a tower called the learning tower of pisa. Both object landed at the time, the reason is that the rates which body accelerates depend on two things the mass acted upon and the force acting upon it. The greater the mass, the less effect on any given mass as bodies at the same distance from the centre of the earth may have different masses, but they will have corresponding different force of gravity acting upon them so that all will accelerate at the same rate provided only the force of gravity acts upon them.
equality is true regardless of the masses or compositions of the bodies. At different points on earth, objects fall with the acceleration between 9.78 and 9.8m/s2 depending on latitude, with a conventional standard value of exactly 9.80665m/s2. Acceleration due to gravity is also known as the acceleration imparted to a body due to its own weight, similarly referred to an acceleration of free falling bodies. It has been found that the acceleration due to gravity is not a constant but varies with distance from the centre of the earth and the latitude.
The first internationally accepted IGF was in 1930 given as: 9.78049 (1 + 0.0052884 sin2θ – 0.0000059 sin22θ) m/s2
Where is the theoretical or normal gravitational acceleration and is the geographical latitude.
Despite the fact the exact density layers in the earth’s interior are still unknowns, the theoretical gravity ‘g’ of its level surface can be computed by a relative simple formula, which is called the International Gravity Formula (IGF). The actual formula is:
= (9.780327 + 0.0516323 sin2θ + 0.0002269 sin4θ) m/s2
While German geodesist Helmert (1906) was brought the IGF as: = (9.8061999 – 0.0259296 cos2θ + 0.0000567cos22θ) m/s2
The geodetic reference system 1967 provided the 1967 IGF as: = 9.7803184 (1 + 0.0053024 sin2θ – 0.0000058 sin22θ) m/s2
The most recently International Accepted Gravity (IAG) developed by Geodetic reference system 1980, leading to World Geodetic System 1984 (WGS 84), in closed form it is:
= 9.7803267714 (1 + 0.0019318
√ – 0.0066944 sin
2
θ) m/s2
From clairaut’s theorem also, the clairaut’s formula for acceleration due to gravity g on the surface of a spheroid at
latitude θ, was:
= [1 + 5
2× − ]
Where G is the value of acceleration of gravity at the equator m is the ratio of the centrifugal force to gravity at the equator f is the flattering of a meridian section of the earth, defined as:
=( − )
Where a is the semi major axis b is the semi minor axis
From clairaut’s theorem we also have the formula for acceleration due to gravity as: = [
√ ]
Where for the earth, G = 9.7803267714 m/s2 K = 0.00193185138639 e2 = 0.00669437999013
is the geographical latitude
B. Variation of Acceleration due to Gravity
The acceleration due to gravity ‘g’ depends on the distance of the plane considered from the centre of the earth which is highly greater at the poles because it is closer to the centre of the earth than at the equator which is far away from the centre of the earth. Since the earth is not perfectly spherical. For points outside the earth, the gravitational force obeys an inverse-square law. So the acceleration of free-fall, g is inversely proportional to the square of the distance to the centre of the earth that is . Where, r is the radius of the earth. The minimum value of g is obtained at the earth’s surface, where =
directly towards the sphere’s centre. However, the Earth deviates slightly from this ideal, and there are consequently slight deviations in both the magnitude and direction of gravity across its surface. Furthermore, the net force exerted on an object due to the earth, called ‘effective gravity’, varies due to the presence of other factors, such as inertia response to the earth’s rotation. A scale or plumb bob measures only this effective gravity.
Parameters affecting the apparent or actual strength of earth’s gravity include latitude, altitude, and the local topography and geology. Other factors are:
In air, objects experience a supporting buoyancy force which reduces the apparent strength of gravity (as measured by an objects’ weight). The magnitude of the effect depends on air density (and hence air pressure). The gravitational effects of the moon and the sun (also the cause of the tides) have a very small effect on the apparent strength of earth’s gravity, depending on the relative positions; typical variations are 2µm/s2 (0.2 mGal) over the course of a day.
In this case we are only going to discuss the variation of acceleration due to gravity with altitude, depth and latitude.
i. Variation of Acceleration due to Gravity with Altitude
Gravity decreases with altitude, since greater altitude means greater distance from the earth’s centre. All other things being equal, and increase in altitude from sea level to the top of Mountain Everest (8,848m) cause a weight decrease of about 0.28%. An additional factor of affecting apparent weight is the decrease in air density at altitude, which lessens an object’s buoyancy. It is a common misconception that astronauts in orbit are weightless because they have flown high enough to ‘escape’ the earth’s gravity. In fact at an altitude of 400km (250 miles), equivalent to a typical orbit of the space shuttle, gravity is still nearly 90% as strong as at the earth’s surface, and weightlessness actually occurs because orbiting objects are in free-fall.
The following formula approximates the earth’s gravity variation with altitude:
= [
( +ℎ)]
Where is the gravitational acceleration at height above sea level is the earth’s mean radius
is the standard gravitational acceleration
The above formula treats the earth as perfect sphere with a radially symmetric distribution of mass. Let a body of mass m be placed on the surface of the earth, whose mass is M and radius is R. The gravitational acceleration is given by:
= (1)
Let the body be now placed at the height h above the earth’s surface. Let the acceleration due to gravity at a position be
| and it is given as:
|=
( +ℎ) (2)
By binomial theorem,
|= 1−2ℎ (3)
Therefore, |<
This shows that acceleration due to gravity decreases with increase in altitude.
Loss in weight = × (4)
ii. Variation of Acceleration due to Gravity with Depth
If the earth was a sphere of uniform density then the gravity would decrease linearly to zero as one travelled in a straight line from the earth’s surface to its centre. This is consequence of Gauss law for gravity. Because of the spherical symmetry, gravity is radially downward and equal in magnitude at all points at a given radius r. Consider a body of mass m, lying on the surface of the earth of radius R and mass M. Let g be the acceleration due to gravity at that place.
= (5)
Where, G is the gravitational constant.
=
( − ) (6)
Let the earth be of uniform density ρ and its shape be a perfect sphere then the mass of the earth M is given by: M = × , where Ve is the volume of the earth
|= 1− (7)
Therefore, |<
This implies that the acceleration due to gravity decreases with increase in depth. If d = R, then | = 0
Therefore the weight of a body at the centre of the earth is zero.
iii. Variation of Acceleration due to Gravity with Latitude
At latitudes nearer the equator, the inertia produced by earth’s rotation is stronger than at the polar latitude. This counteracts the earth’s gravity to a small degree which is up to a maximum of 0.3% at the equator and reducing the downward acceleration of falling objects. The second major cause for the difference in gravity at different latitudes is that the earth’s equatorial bulge (itself also caused by inertia) causes objects at the equator to be farther from the planet’s centre than objects at the poles because the force due to gravitational attraction between two bodies (the earth and the object being weighed) varies inversely with the square of the distance between them, an object at equator experiences a weaker gravitational pull than an object at the poles.
In combination, the equatorial bulge and the effects of the earth’s inertia mean that sea level gravitational acceleration increases from about 9.780 m/s2 at the equator to about 9.83 m/s2 at the poles, so an object will weigh about 0.5% more at the poles than at the equator. The value of g changes from place to place due to the elliptical shape of the earth and the rotation of the earth. Due to the shape of the earth, g is given as:
= (8)
Therefore, (9)
Hence, g is inversely proportional to the square of the radius.
Therefore it is least at the equator and maximum at the poles, since the equatorial radius (6378.2 km) is more than the
polar radius (6356.8 km). Since all the forces acting on the body at the latitude θ result in uniform circular motion, the
net of all forces should be equal to centripetal force. That is, − |= cos
At the equator, = 0°, cos = 1
Therefore, |= − (10)
This implies that, |<
At the pole, = ±90°, cos = 0
Therefore, |= (11)
Hence, the acceleration due to gravity is maximum at the poles and minimum at the equator.
IV. RESULTS AND DISCUSSIONS
The materials used during the experiment was set-up as mentioned earlier where the height of bob above ground h (cm) was measured as shown in the tables below in each location. The time for 20 oscillations was also obtained twice in which their average (mean) was obtained. The period (T) of the oscillations was also obtained by dividing the average of time for 20 oscillations by the number of oscillations i.e. 20 as shown in the Tables 1.1, 1.2, 1.3, 1.4 and 1.5 below. And the procedure was repeated at 5 different locations of Kano state.
a) Data obtained and results
1. B.U.K. OLD CAMPUS
S/N HEIGHT OF BOB ABOVE GROUND h(cm)
TIME FOR 20 OSCILLATIONS t(s) PERIOD T(s) =
t/20
T²(s²)
I II MEAN
1 50 47.20 47.20 47.20 2.36 5.57
2 60 45.30 45.20 45.25 2.26 5.11
3 70 43.40 43.20 43.20 2.17 4.71
4 80 42.00 41.80 41.90 2.10 4.41
5 90 39.80 39.60 39.70 1.99 3.96
6 100 37.60 37.70 37.65 1.88 3.53
7 110 35.21 35.20 35.21 1.76 3.10
Table 1.1: Data for B.U.K. Old Campus
From the graph of B.U.K. Old Campus, we get the slope m as, m = - 0.0404 s2/cm g = - 4π2/m = - 4 x (3.142)2/(- 0.404) = 39.4887/0.0404 = 977.4420 cm/s2 g ≈ 9.7744 m/s2
The theoretical value of gravitational acceleration was obtained as follows: From the first International gravity formula (IGF) in 1930, we get
g = 9.78049 (1 + 0.0052884sin2 - 0.0000059sin22θ) m/s2
= 9.78049 [1 + 0.0052884sin2(8.6625º) - 0.00059sin2(17.325º)] m/s2 g ≈ 9.781152 m/s2
From the formula of gravitational acceleration at height above sea level, we get g = 9.80665 [rₑ/(rₑ+h)]2 m/s2
= 9.80665 [6.4 x 10⁶/(6.4 x 106 + 472.6)]2 = 9.80665 x 0.99985 g ≈ 9.805179 m/s2
From the clairaut’s theorem, we get g = 9.78033 [1 + ksin2θ/√1 – e2sin2θ] m/s2
Where k = 0.00193, e2= 0.00669, θ = 8.6625º g ≈ 9.781501 m/s2
Therefore the average value of the gravitational acceleration is g = 9.789277 m/s2
2. B.U.K. NEW CAMPUS
LONGITUDE: N = 12.1025º, LATITUDE: E = 8.3333º HEIGHT ABOVE SEA LEVEL: 478.7m
S/N HEIGHT OF
BOB ABOVE GROUND h(cm)
TIME FOR OSCILLATIONS t(s) PERIOD T(s) =
t/20
T² (s²)
I II MEAN
1 50 46.00 46.20 46.10 2.31 5.34
2 60 43.30 44.10 43.70 2.19 4.80
3 70 42.00 41.30 41.65 2.08 4.33
4 80 39.70 40.00 39.85 1.99 3.96
5 90 38.00 38.20 38.10 1.91 3.65
6 100 36.00 35.50 35.75 1.79 3.23
7 110 35.10 34.00 34.55 1.73 2.99
From the graph of B.U.K. New Campus, we get the slope m as, m = - 0.0409 s2/cm g = - 4π2/m = - 4 x (3.142)2/(- 0.404) = 39.4887/0.0409 = 965.4939 cm/s2 g ≈ 9.6549 m/s2
The theoretical value of gravitational acceleration was obtained as follows: From the first International gravity formula (IGF) in 1930, we get
g = 9.78049 (1 + 0.0052884sin2 - 0.0000059sin22θ) m/s2
= 9.78049 [1 + 0.0052884sin2 (8.3333º) - 0.00059sin2(16.6666º)] m/s2 g ≈ 9.781572 m/s2
From the formula of gravitational acceleration at height above sea level, we get g = 9.80665 [rₑ/(rₑ+h)]2 m/s2
= 9.80665 [6.4 x 10⁶/(6.4 x 106 + 478.7)]2 = 9.80665 x 0.99985 g ≈ 9.805179 m/s2
From the clairaut’s theorem, we get g = 9.78033 [1 +ksin2θ/√1 – e2sin2θ] m/s2
Where k = 0.00193, e2= 0.00669, θ = 8.3333º g ≈ 9.780039 m/s2
Therefore the average value of the gravitational acceleration is g = 9.78893 m/s2
3. F.C.E. KANO
LONGITUDE: N = 11.8585º, LATITUDE: E = 8.3622º HEIGHT ABOVE SEA LEVEL: 476.7m
S/N HEIGHT OF
BOB ABOVE GROUND h(cm)
TIME FOR 20 OSCILLATIONS t(s) PERIOD T(s) =
t/20
T²(s²)
I II MEAN
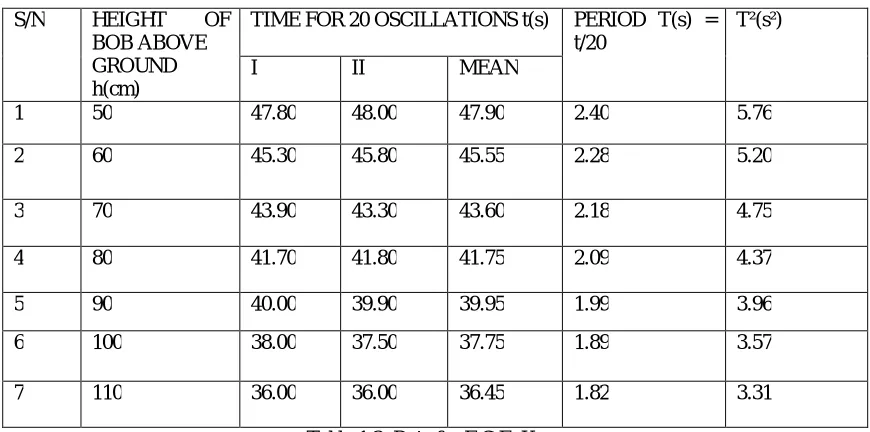
1 50 47.80 48.00 47.90 2.40 5.76
2 60 45.30 45.80 45.55 2.28 5.20
3 70 43.90 43.30 43.60 2.18 4.75
4 80 41.70 41.80 41.75 2.09 4.37
5 90 40.00 39.90 39.95 1.99 3.96
6 100 38.00 37.50 37.75 1.89 3.57
7 110 36.00 36.00 36.45 1.82 3.31
Table 1.3: Data for F.C.E. Kano
From the graph of F.C.E. Kano, we get the slope m as, m = - 0.0407 s2/cm g = - 4π2/m = - 4 x (3.142)2/(- 0.404) = 39.4887/0.0407 = 970.2383 cm/s2 g ≈ 9.7024 m/s2
The theoretical value of gravitational acceleration was obtained as follows: From the first International gravity formula (IGF) in 1930, we get
g = 9.78049 (1 + 0.0052884sin2θ - 0.0000059sin22θ) m/s2
= 9.78049 [1 + 0.0052884sin2 (8.3622º) - 0.00059sin2 (16.7244º)] m/s2
g ≈ 9.781579 m/s2
= 9.80665 [6.4 x 10⁶/(6.4 x 106 + 476.7)]2 = 9.80665 x 0.99985
g ≈ 9.805179 m/s2
From the clairaut’s theorem, we get g = 9.78033 [1 + ksin2θ/√1 – e2sin2θ] m/s2
Where k = 0.00193, e2= 0.00669, θ = 8.6625º g ≈ 9.780038 m/s2
Therefore the average value of the gravitational acceleration is g = 9.78893 m/s2
4. FEDERAL COLLEGE OF EDUCATION BICHI
LONGITUDE: N = 12.1025º, LATITUDE: E = 8.3232º HEIGHT ABOVE SEA LEVEL: 479.6m
S/N HEIGHT OF BOB
ABOVE
GROUND h(cm)
TIME FOR 20 OSCILLATION t(s) PERIOD
T(s)
T²(S²)
1 50 47.51 47.51 47.51 2.38 5.66
2 60 45.61 45.51 45.56 2.28 5.20
3 70 43.73 43.52 43.63 2.18 4.75
4 80 42.32 42.11 42.22 2.11 4.45
5 90 40.11 39.93 40.02 2.00 4.00
6 100 37.91 37.93 37.92 1.90 3.61
7 110 35.22 35.21 35.22 1.76 3.10
Table 1.4: Data for F.C.E. Bichi
From the graph of F.C.E. Bichi, we get the slope m as, m = - 0.0415 s2/cm g = - 4π2 m = - 4 x (3.142)2/(- 0.404) = 39.4887/0.0415 = 977.4420 cm/s² g ≈ 9.5153 m/s2
The theoretical value of gravitational acceleration was obtained as follows: From the first International gravity formula (IGF) in 1930, we get
g = 9.78049 (1 + 0.0052884sin2θ - 0.0000059sin22θ) m/s2
= 9.78049 [1 + 0.0052884sin2(8.3232º) - 0.00059sin2(16.6464º)] m/s2
g ≈ 9.7816 m/s2
From the formula of gravitational acceleration at height above sea level, we get g = 9.80665 [rₑ/(rₑ+h)]2 m/s2
= 9.80665 [6.4 x 10⁶/(6.4 x 106 + 479.6)]2 = 9.80665 x 0.99985
g ≈ 9.805179 m/s2
From the clairaut’s theorem, we get g = 9.78033 [1 + ksin2θ/√1 – e2sin2θ] m/s2
Where k = 0.00193, e2= 0.00669, θ = 8.3232º g ≈ 9.7814 m/s2
Therefore the average value of the gravitational acceleration is g = 9.7894 m/s2
5. KANO UNIVERSITY OF SCIENCE AND TECHNOLOLGY (K.U.S.T.) WUDIL
S/N HEIGHT OF
BOB ABOVE
GROUND h(cm)
TIME FOR 20 OSCILLATIONS t(s) PERIOD T(s) =
t/20
T²(s²)
I II MEAN
1 50 47.30 47.30 47.30 2.37 5.62
2 60 45.40 45.30 45.35 2.27 5.15
3 70 43.50 43.30 43.40 2.17 4.71
4 80 42.10 41.90 42.00 2.10 4.41
5 90 39.90 39.70 39.80 1.99 3.96
6 100 37.70 37.80 37.75 1.89 3.57
7 110 35.11 35.10 35.11 1.76 3.10
Table 1.5: Data for K.U.S.T. WUDIL
From the graph of K.U.S.T. Wudil, we get the slope m as, m = - 0.0410 s2/cm g = - 4π2/m = - 4 x (3.142)2/(- 0.410) = 39.4887/0.041 = 963.1390 cm/s² g ≈ 9.63139 m/s2
The theoretical value of gravitational acceleration was obtained as follows: From the first International gravity formula (IGF) in 1930, we get
g = 9.78049 (1 + 0.0052884sin2θ - 0.0000059sin22θ) m/s2
= 9.78049 [1 + 0.0052884sin2(8.6649º) - 0.00059sin2(17.3298º)] m/s2
g ≈ 9.781659 m/s2
From the formula of gravitational acceleration at height above sea level, we get g = 9.80665 [rₑ/(rₑ+h)]2 m/s2
= 9.80665 [6.4 x 10⁶/(6.4 x 106 + 463.4)]2 = 9.80665 x 0.99985
g ≈ 9.805277 m/s2
From the clairaut’s theorem, we get g = 9.78033 [1 + ksin2θ/√1 – e2 sin2θ] m/s2
Where k = 0.00193, e2= 0.00669, θ = 8.6649º g ≈ 9.7890 m/s2
Therefore the average value of the gravitational acceleration is g = 9.79198 m/s2
Table 1.6 shows the comparisons between experimental g and theoretical g taken in the five (5) different locations of Kano state.
S/N Locations Experimental g (m/s2) Theoretical g (m/s2) Difference (m/s2)
1 BUK Old Campus 9.7744 9.789277 0.014877
2 BUK New Campus 9.6549 9.78893 0.13403
3 FCE Kano 9.7024 9.78893 0.08653
4 FCE Bichi 9.5153 9.7894 0.2741
5 Kano University of
Science and
Technology Wudil
9.63139 9.79198 0.16059
Table 1.6: This table shows the comparisons between experimental g and theoretical g
b) Graphs
Figure 2.2 is the graph of T2 (s2) against h (cm) for B.U.K. New Campus, it shows that T2 (square of the period of oscillation) decreases as the height h of the bob above ground increase. The slope of the graph is found to be -0.0409 s2/cm which has been used to calculate the experimental g for that location.
Figure 2.3 is the graph of T2 (s2) against h (cm) for F.C.E. Kano, it shows that T2 (square of the period of oscillation) decreases as the height h of the bob above ground increase. The slope of the graph is found to be -0.0407s2/cm which has been used to calculate the experimental g for that location.
T2= -0.0404h + 7.5757
0 1 2 3 4 5 6
0 50 100 150
T
2(s 2)
h (cm)
Fig 2.1: Graph of BUK Old Campus
T2= -0.0409h + 7.78
0 1 2 3 4 5 6 7
0 50 100 150
T
2(s 2)
h (cm)
Fig 2.2: Graph of BUK New Campus
T2= -0.0407h + 7.6743
0 2 4 6 8
0 50 100 150
T
2(s 2)
h (cm)
Figure 2.4 is the graph of T2 (s2) against h (cm) for F.C.E. Bichi, it shows that T2 (square of the period of oscillation) decreases as the height h of the bob above ground increase. The slope of the graph is found to be -0.0415s2/cm which has been used to calculate the experimental g for that location.
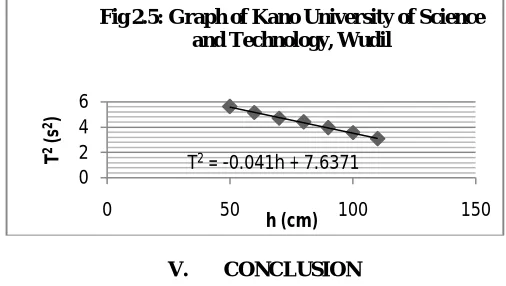
Figure 2.5 is the graph of T2 (s2) against h (cm) for Kano University of science and technology, Wudil, it shows that T2 (square of the period of oscillation) decreases as the height h of the bob above ground increase. The slope of the graph is found to be -0.041s2/cm which has been used to calculate the experimental g for that location.
V. CONCLUSION
It was concluded that within the limit of experimental errors in this research work the average value of experimental acceleration due to gravity was found to be 9.655678m/s2, while the average value of the theoretical acceleration due to gravity was found to be 9.7897034m/s2. When comparing the experimental value of acceleration due to gravity with that of theoretical value, it was found that the theoretical value leads the experimental value by 0.1340254m/s2 which were due to experimental errors.
REFERENCES
[1] Khongiang L, Dkhar A, and Lato S, “Accurate determination of acceleration due to gravity, g in shillong using electronic timer”, International
Journal of Geology, Earth & Environmental Sciences, Vol. 5 (2), pp 105-111 2015.
[2] Rovert Resnick, Halliday David, and Kenneth S. Krane, “Physics”, John Wiley and sons, Vol.1(fifth edition), 2001. [3] G. Khelashvili and C.U. Segre. “Acceleration due to gravity”, Unpublished article, pp 1-3 2003.
[4] Michel Nelkon and Philip Parker, “Advanced Level Physics”, Heinemann International Literature and Text Books, 7th Revised Edition, 1995.
T2= -0.0415h + 7.7129
0 2 4 6
0 50 100 150
T
2(s 2)
h (cm)
Fig 2.4: Graph of FCE Bichi
T2= -0.041h + 7.6371
0 2 4 6
0 50 100 150
T
2(s 2)
h (cm)