TITLE PAGE
1Title: H
ypertriglyceridemic-waist is
more predictive of abnormal liver and renal
2function in an Australian population than a Chinese population
34
Running Title: HTGW impact on liver and renal function
56
Dahai Yu 1,2, Wei Yang 1,3, Tao Chen 1,4, Yamei Cai 1, Zhanzheng Zhao 1,‡, David Simmons 5, ‡ 7
8
1. Department of Nephrology, the First Affiliated Hospital, Zhengzhou University,
9
Zhengzhou 450052, China
10 11
2. Arthritis Research UK Primary Care Centre, Research Institute for Primary Care & Health
12
Sciences, Keele University, Keele ST5 5BG, UK
13 14
3. School of Medicine, Washington University in St Louis, 660 S Euclid Ave, St. Louis, MO
15
63110, United States
16 17
4. Tropical Clinical Trials Unit, Department of Clinical Sciences, Liverpool School of
18
Tropical Medicine, Pembroke Place, Liverpool L3 5QA, UK
19 20
5. Western Sydney University, Campbelltown, Sydney NSW 2751, Australia
21 22
23
‡
Correspondence 1 (China):
24Professor Zhanzheng Zhao, Department of Nephrology, the First Affiliated
25
Hospital
26
Zhengzhou University, Zhengzhou 450052, CHINA
27
Email: [email protected]
28
TEL:+86 139 3852 5666
29
FAX:+86 371 6698 8753
30 31
‡
Correspondence 2 (Australia):
32Professor David Simmons, Macarthur Clinical School, School of Medicine, Western
33
Sydney University, Locked Bag 1797, Campbelltown NSW 2751, AUSTRALIA
ABSTRACT
45Objective
46We aimed to compare the association of
hypertriglyceridemic-waist (
HTGW), with
47glycaemia, liver and renal function between a Chinese and an Australian
48population using 3 HTGW definitions.
49Methods
501,454 Australian and 5,824 Chinese adults, from randomly selected households
51provided clinical history, glucose, lipids, anthropometric, and blood pressure
52measurements. Liver and renal functions were assessed using Alanine
53Aminotransferase and estimated Glomerular Filtration Rate respectively. The
54impact of interaction between HTGW and glucose on the liver and renal functions
55were measured by General Linear Model. Logistic regression was used to estimate
56the association between this interaction and abnormal liver and renal function.
57Results
58HTGW was associated with abnormal liver and renal function in both Chinese and
59Australian populations using all 3 HTGW definitions. The highest sensitivity (93
60(95% confidence interval: 87, 97) %) and specificity (81 (80, 84) %) were observed
61for abnormal renal function in the Australian population. The probability of having
62abnormal liver or renal function increased with glucose in the presence of HTGW
63phenotype only in the Australian population. Similar findings were revealed in
64people without type 2 diabetes.
65Conclusions
66In both Chinese and Australian populations, HTGW is associated with abnormal
67liver and renal function using any of the 3 definitions. HTGW is a potential tool to
68identify high-risk individuals with impaired renal function especially in the
69Australian population. HTGW interacted with the fasting glucose in its association
70with impaired liver and renal function only in the Australian population,
71suggesting different underlying interactions between environmental and genetic
72backgrounds.
7374
INTRODUCTION
81It has been estimated that 3.4 million deaths, 3.9% of years of life lost and 3.8% of 82
disability-adjusted life-years were caused by overweight and obesity globally in 2010 1. In
83
spite of the well-recognized increased morbidity and mortality associated with an 84
elevated body weight, there is clear evidence that visceral adiposity conveys the highest 85
risk of metabolic complications, especially type 2 diabetes. Visceral adiposity 86
accumulation (visceral obesity) rather than subcutaneous (non-visceral) obesity is 87
associated with increased risk of chronic kidney disease 2, 3 and metabolic liver disease 4.
88
Although BMI is easy to calculate, it is a poor estimate of fat mass and its distribution, as 89
muscular individuals or those with more subcutaneous fat may have a BMI as high as 90
individuals with larger visceral adiposity. From a risk standpoint, there is now evidence 91
that the simultaneous presence of an elevated waist circumference and fasting 92
triglyceride (known as the hypertriglyceridemic waist, HTGW) may represent a phenotype 93
for visceral obesity. So far, there are three definitions developed in diverse populations 94
and utilised to identify individuals at higher risk of metabolic disorders 5, 6, 7. Although the 95
concept of the HTGW was proposed in 2000 8, its association with other features of
96
visceral obesity including abnormal liver and renal function, and the extent of any 97
interaction with fasting hyperglycaemia remain undefined. Moreover, since different 98
definitions of HTGW were derived from different ethnic groups, it is unclear whether 99
these different definitions were due to the study specific analyses or genuine ethnic 100
variations. Our study now aims to address these uncertainties by comparing the 101
relationships between HTGW phenotypes and abnormal liver and renal function, and any 102
associated interactions with fasting glucose between two populations: one Chinese and 103
one predominantly Australian of European descent. 104
Data setting
107108
The Australian population data were derived from the Crossroads study (>98% European
109
descent) 9 carried out between June 2001 and March 2003 among residents of the seven 110
main towns in the Goulburn Valley, Victoria, Australia (populations 2094–35,828), as
111
previously described 8,9,10. A two-step approach was used: interviews were conducted 112
with all residents in randomly selected households (a ‘census’) and then invitations were
113
given for all usual residents (resident in the area for at least 6 months) aged ≥ 25 years to
114
attend for a ‘clinic’. An initial census of 2376 randomly selected households (half in the
115
regional centre, a twelfth in each of the six smaller towns) was undertaken (response
116
rate 70%). Houses were revisited until a response was received.
117
118
The Chinese population data were derived from the Nanjing Community Cardiovascular
119
Risk Survey, using random cluster sampling11, between July 2011 and April 2013 among the 120
residents of 6 communities in Nanjing, Jiangsu Province, China (population 0.7 million-1.3
121
million). In each community, one street district or township was randomly selected. All
122
households (n=6,445) in the selected street or town were included with only one
123
participant aged ≥ 20 years selected from each household, without replacement. Overall,
124
5,824 residents completed the survey and examination (response rate of 90%).
125
126
In both studies, questionnaires were completed, wherever possible, through face-to-face
127
interviews by trained research staff. Questions included age, sex, ethnicity, education,
128
and known diabetes.
129
130
In both studies, blood pressure and body measurements including height, weight, and
131
waist circumference were taken three times using a standardized methodology on the
132
same day in the local clinical center and the mean of the two closest recordings was used.
Height, weight, and waist circumference were measured by use of a metric scale and a
134
vertical weight scale. Weight was measured in light indoor clothing without shoes to the
135
nearest 10th of a kilogram. Height was measured without shoes to the nearest 10th of a
136
centimetre. Waist circumference was measured at 1 cm above the navel at minimal
137
respiration. In both studies all observers participated in a training session on the use of a
138
standardized protocol for anthropometric measurement techniques.
139
140
Fasting blood specimens were collected using a vacuum tube containing sodium fluoride.
141
The fasting time was verified prior to collecting the blood specimen. Participants who had
142
not fasted for at least 10 h did not have their blood drawn and processed at the
143
examination center (Nanjing) or a centralized Laboratory (Crossroads), where the
144
specimens were stored at −70°C until laboratory assays could be carried out. Plasma
145
glucose, alanine aminotransferase (ALT), creatinine, and lipid levels were measured by
146
automated analyser (Australian: Hitachi 917R autoanalyser (Hitachi, Tokyo, Japan);
147
Nanjing: Olympus AU600 autoanalyser (Olympus Optical, Tokyo, Japan)). Type 2 diabetes
148
was defined using WHO criteria 10 or by self-report if previously diagnosed (confirmed by 149
doctor prescription (Nanjing) or medical records (Crossroads)), and metabolic syndrome
150
(MS) using International Diabetes Federation (IDF) criteria 11. Hypertension was 151
considered present if reported as having previously been diagnosed by a doctor or nurse
152
12. The estimated Glomerular Filtration Rate (eGFR) was calculated from serum creatinine 153
using the Chronic Kidney Disease Epidemiology Collaboration (CKD-EPI) equation 13. Due 154
to non-standardised creatinine measurement, (Isotope Dilution Mass Spectrometry
155
(IDMS) standardized creatinine assay) adjusted creatinine was applied in the eGFR
156
estimation in the Crossroads study 14. Abnormal liver function was defined as ALT ≥ 40U/L 157
15 and abnormal renal function was defined as eGFR < 60 ml/min/1.73m216. 158
The exposure ‘HTGW’ were defined in three ways: (“Definition-1”) both men and women:
160
WC ≥ 85 cm andtriglyceride (TG) ≥ 1.5 mmol/L (133 mg/dl) 5; (“Definition-2”) for men, WC 161
≥90 cm and TG ≥2.0 mmol/L(177mg/dl) ; for women, WC ≥85 cm and TG≥1.5 mmol/L(133
162
mg/dl) 6; (“Definition-3”) for men: WC ≥ 90cm and TG ≥ 2.0 mmol/L (177mg/dl); for 163
women, WC≥85cm and TG≥ 2.0 mmol/L (177mg/dl) 7. 164
165
Statistical analysis
166
Continuous variables were characterized by their mean and standard deviation, and
167
differences across groups were tested using Student’s t test. Binary factors were
168
characterized by percentages, and difference across groups were tested using Fisher’s
169
exact test.
170
171
Associations between the three HTGW definitions and abnormal liver and renal function
172
were assessed by logistic regression after adjusting for age, gender and BMI. Since the
173
number of HTGW cases and normal samples were severely unbalanced in most cases,
174
weighted logistic regression was performed with higher weight on samples from the
175
smaller group to achieve similar prediction rates in both the case and normal groups.
176
Odds ratio (OR), as the measurement between exposures (HTGW and glucose) and
177
outcomes (abnormal liver and renal function), and the confidence interval, were
178
calculated from the regression coefficient for HTGW and its standard deviation.
179
Predictions from the regression model were compared with the observed values to
180
obtain the prediction sensitivities and specificities. The estimated sensitivity/specificity
181
and their confidence intervals were calculated. The sensitivity is defined as the proportion
182
of patients with abnormal liver and renal function having the HTGW phenotype. The
183
specificity is defined as the proportion of patients without abnormal liver and renal
184
function who did not have the HTGW phenotype.
186
The relationships between fasting glucose and the outcomes (continuous outcomes: ALT
187
and eGFR; binary outcomes: abnormal liver function and abnormal renal function) were
188
modelled for the dose-response effect using fractional polynomials. Sensitivity analyses
189
were performed to refit the models within the data rich range (5th percentile to 95th 190
percentile). In another sensitivity analysis, all analyses were performed among
191
participants without diabetes. We have a 95% chance of detecting 10% increased risk of
192
abnormal renal/liver function in HTGW subjects at an alpha level of 0.05. All analyses were
193
conducted using R, CRAN version 3.2.2 with P < 0.05 considered statistically significant.
194
195
The Goulburn Valley Health Ethics Committee approved the Crossroads study (approval
196
number GVH – 3/99). The Institutional Review Board of Jiangsu Province Hospital on
197
Integration of Chinese and Western Medicine approved the Nanjing study (approval
198
number 11-006). Signed, informed consent was obtained from all participants.
199
200
RESULTS
201202
The characteristics of the study participants by the three HTGW phenotype definitions in
203
both the Chinese and Australian populations are presented in Table-1. Irrespective of
204
definitions of HTGW phenotypes, participants with HTGW were more likely to have higher
205
age, WC, body mass index, fasting glucose, triglycerides, and low-density lipoprotein, and
206
lower levels of high-density lipoprotein both in the Chinese and Australian populations.
207
The prevalence of metabolic disorders (metabolic syndrome or type 2 diabetes) was
208
higher among participants with the HTGW phenotype both in the Chinese and Australian
209
populations. Chinese participants with HTGW defined by Definition-1, and Australian
210
participants with HTGW defined by Definition-1 and Definition-3, respectively were more
211
likely to be men.
213
Higher concentrations of ALT and a reduced eGFR were more common among
214
participants with HTGW phenotypes irrespective of definitions of HTGW in both Chinese
215
and Australian populations (Figure S1).
216
217
The associations between presence of HTGW phenotypes and abnormal liver and renal
218
function are presented in Table-2. Having HTGW phenotype was significantly associated
219
with a higher odds ratio of abnormal liver function by each definition of HTGW in the
220
Chinese population, and by Definition-1 and Defition-3 in the Australian population.
221
Having HTGW phenotype was only significantly associated with a higher odds ratio of
222
abnormal renal function by Definition-2 and only in the Chinese population (Table-2). In
223
the stratified analysis, having HTGW phenotype was more likely to be significantly
224
associated with a higher odds ratio of abnormal renal function and liver function among
225
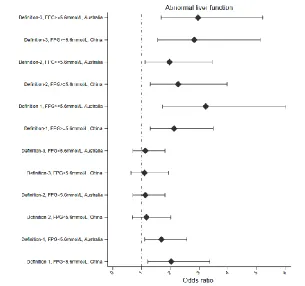
those with high fasting plasma glucose (FPG≥5.6 mmol/L) (Figure-1).
226
227
Utilization of the HTGW phenotype to screen for abnormal liver function was tested by
228
the three definitions. The highest sensitivity was found using Definition-2 both in Chinese
229
and Australian populations, and the highest specificity using Definition-1 in the Chinese
230
population and using Definition-3 in the Australian population. Screening for abnormal
231
renal function using HTGW phenotypes was also tested using the three definitions, with
232
similar sensitivity and specificity in both the Chinese and Australian populations (Table-2).
233
234
The dose-response relationships between ALT and fasting glucose were observed among
235
participants with and without the HTGW phenotype by the three definitions both in the
236
Chinese and Australian populations (Figure-S2). Among Australian participants with the
237
HTGW phenotype, ALT tended to be stable using the fasting glucose with glucose
concentrations below 5.5 mmol/L, and increased with glucose concentrations above 5.5
239
mmol/L. Among Australian participants without phenotype, ALT increased with the
240
glucose at glucose concentrations below 5.5 mmol/L and tended to be stable with
241
glucose concentrations above 5.5 mmol/L. Among Chinese participants with or without
242
HTGW phenotype, ALT tended to be stable at glucose concentrations below 6.0 mmol/L
243
and increased as glucose increasedat concentrations above 6.0 mmol/L (Figure S3).
244
245
The dose-response relationships between eGFR and glucose were observed among
246
participants with and without HTGW phenotype using the three definitions in both the
247
Chinese and Australian populations (Figure-S4). Among Australian participants with the
248
HTGW phenotype, eGFR decreased as glucose increased at glucose concentrations below
249
6.7 mmol/L and tended to be stable at glucose concentrations above 6.7 mmol/L. Among
250
Australian participants without the HTGW phenotype, eGFR decreased asglucose
251
increased below 5.5 mmol/L and then tended to be stable at glucose concentrations
252
above 5.5 mmol/L. Among Chinese participants with or without HTGW phenotype, the
253
eGFR decreased as glucose increased below 5.5 mmol/L and tended to be stable at
254
glucose concentrations above 5.5 mmol/L.
255
256
The dose-response relationship between the glucose level and log odds ratio of having
257
abnormal liver function is presented in Figure-2. Among Australian participants with the
258
HTGW phenotype, the log odds ratio of having abnormal liver function decreased as
259
glucose increased up to 5.5 mmol/L and then increased as glucose increased. Among
260
Australian participants without the HTGW phenotype, the log odds ratio of having
261
abnormal liver function decreased as glucose increased up to 5.5 mmol/L and then tended
262
to be stable. Among Chinese participants with or without the HTGW phenotype, the log
263
odds ratio decreased as the glucose increased up to 5.5 mmol/L and then increased
265
The dose-response relationships between the log odds ratio of abnormal renal function
266
and fasting glucose were observed among participants with and without the HTGW
267
phenotype by the three definitions in both the Chinese and Australian populations
268
(Figure-3). Among Australian participants with the HTGW phenotype, the log odds ratio
269
of abnormal renal function decreased with increasing fasting glucose up to 6.0 mmol/L
270
and increased thereafter. Among Australian participants without the HTGW phenotype,
271
the log odds ratio of abnormal renal function increased as the fasting glucose increased
272
up to 5.0 mmol/L and then tended to be stable. Among Chinese participants with and
273
without the HTGW phenotype, the log odds ratio of abnormal renal function decreased
274
asthe fasting glucose increased up to 5.0 mmol/L and then increased.
275
276
All dose-response relationships were analysed in the data rich range with similar findings
277
as shown as Figures S5-S7.
278
279
All dose-response relationships were analysed among participants without diabetes, and
280
the same shapes of dose-response curves and thresholds were identified Figure S8-S11.
281
282
DISCUSSION
283284
Using two independent populations, we found that the HTGW phenotype,
285defined by each of three definitions, was associated with abnormal liver and renal
286function in both the Chinese and the Australian populations. However, the
287patterns of these relationships differed. Among the Australians, but not the
288Chinese, the HTGW phenotype could be used to screen for abnormal renal
289increased and eGFR decreased (ie the probability of having abnormal liver or renal
291function increased) with increasing fasting glucose, especially in the presence of
292the HTGW defined by each definition. No such relationships were found in the
293Chinese cohort with or without HTGW and using any HTGW definition.
294295
Visceral obesity is thought to play a key role in the pathway to developing
296metabolic disorders (metabolic syndrome or type 2 diabetes)
17. The HTGW
297
concept was developed as a proxy for visceral obesity, and has previously been
298shown to be associated with hypertension, metabolic syndrome, type 2 diabetes,
299atherosclerosis and several other disorders
18. In an Iranian cross-sectional study,
300
the HTGW, defined by Definition-3, was found to be associated with chronic
301kidney disease
19. In the Insulin Resistance Atherosclerosis Study, the HTGW was
302
associated with an elevated ALT
20. However, it has been unclear whether these
303
associations were independent of fasting glycaemia, another correlate of
304abnormal liver and renal function. In our study, the HTGW phenotype was
305associated with abnormal liver and renal function both in the Chinese and
306Australian populations. We have now shown heterogeneity in in the interaction
307between the HTGW phenotype and the fasting glucose, as it was only present in
308the Australian, not the Chinese population. This suggests that HTGW and fasting
309glucose have independent impacts on the development of abnormal liver and
310renal function.
311312
Definition-2 (
for men, WC ≥90 c
m
and TG ≥2.0 mmol/L(177mg/dl) ;
for women, WC
313≥85 c
m
and TG≥1.5 mmol/L(133 mg/dl)
) appeared to be the optimal definition and
therefore could be an effective screening tool to identify individuals who are
315potentially at high risk of developing abnormal liver and/or renal function.
316Definition 2 had both high sensitivity and specificity, particularly for abnormal
317renal function, in the Australian population. The relatively low sensitivity and
318specificity of HTGW in the Chinese population might be due to the relatively low
319waist circumference and triglyceride concentrations, which also hints at the
320potential for future exploration for appropriate definitions of HTGW in Chinese
321population
21.
322
323
Several mechanisms may contribute to the findings of this study. Impaired liver
324and renal function might result from an altered systemic balance between
325inflammatory factors and adipokines, as both the acute-phase inflammatory
326reactant, C-reaction protein, and the proinflammatory cytokines, such as TNF-
α
327and IL-6 were previously found to be associated with HTGW phenotype
22. On the
328
other hand, a decreased adiponectin level was found to be associated with HTGW
329phenotype
22. Adiponectin, the only adipokine inversely associated with
330
metabolic disorders including insulin resistance, is a signalling protein that is
331predominantly synthesized and secreted by adipose tissue and is one of the most
332abundant plasma proteins in humans
23.
333
334
The principal limitation of the present study is the use of cross-sectional data in
335both China and Australia, whereby HTGW phenotypes and abnormal liver and
336renal function were assessed at the same time. It is difficult to make causal
337HTGW in screening for abnormalities were emphasized in the current analysis
339particularly among Australians. Analysis of longitudinal data would be the next
340step in examining these relationships further. Another limitation of this joint study
341is that the data were not collected within the same survey, although the data do
342appear to be comparable. Although the clinical measurements were managed
343using a standard approach in both China and Australia, the two research teams
344worked independently, processing the measurements and blood samples using
345different equipment including automated analysers. The laboratories were both
346involved in their respective national laboratory quality assurance programmes and
347would have therefore had external quality controls on the precision and accuracy
348of their analyses. The temporal difference in data collection from the two
349countries might also have some impact on the research population.
350Finally, the conventional methods (stratification analyses and multivariable
351modelling strategy) to adjust more confounders were restricted by the current
352sample size (especially low outcome counts per variable). Therefore, the
353adjustment of more covariables or potential confounders in the current models
354was not optional and future external validation studies with further adjustment of
355more confounders, alongside a meta-analysis are needed to better determine
356whether HTGW does have the potential to be used as a simple screening tool in
357clinical practice.
358359
In conclusion, both in the Chinese and Australian population, HTGW was found to
360be associated with abnormal liver and renal functions using three previously
361individuals at high risk of impaired renal function particularly in the Australian
363population. Only in the Australian population, did the HTGW interact with fasting
364glucose in its associations with impaired liver and renal function.
365366
Conflicts of interest
367This work was supported by The National Natural Science Foundation of China (Grant No. 372
81570690) and Science and Technology Innovation Team of Henan (Grant No. 373
17IRTSTHN020).The original Crossroads survey was supported by the International 374
Diabetes Institute and the University of Melbourne. The Department of Rural Health was 375
funded by the Department of Health and Ageing Rural Health programme at the time of 376
1. Ng, M, Fleming, T, Robinson, M, Thomson, B, Graetz, N, Margono, C et al.
384
Global, regional, and national prevalence of overweight and obesity in children
385
and adults during 1980-2013: a systematic analysis for the Global Burden of
386
Disease Study 2013. Lancet, 2014;9945:766-781.
387
2. Kolomenskii, VN, Shchepunov, VS. Comparative aspects of functional
388
disturbances of the liver in children with nephritis. Pediatriia, 1966;2:13-16.
389
3. Kovesdy, CP, Furth, SL, Zoccali, C, World Kidney Day Steering Committee.
390
Obesity and Kidney Disease: Hidden Consequences of the Epidemic. Can. J. Kidney
391
Health. Dis., 2017:2054358117698669.
392
4. van der Poorten, D, Milner, KL, Hui, J, Hodge, A, Trenell, MI, Kench, JG et al.
393
Visceral fat: a key mediator of steatohepatitis in metabolic liver disease.
394
Hepatology, 2008;2:449-457.
395
5. Blackburn, P, Lemieux, I, Lamarche, B, Bergeron, J, Perron, P, Tremblay, G et al.
396
Type 2 diabetes without the atherogenic metabolic triad does not predict
397
angiographically assessed coronary artery disease in women. Diabetes Care,
398
2008;1:170-172.
6. Arsenault, BJ, Lemieux, I, Despres, JP, Wareham, NJ, Kastelein, JJ, Khaw, KT et
400
al. The hypertriglyceridemic-waist phenotype and the risk of coronary artery
401
disease: results from the EPIC-Norfolk prospective population study. CMAJ,
402
2010;13:1427-1432.
403
7. Sam, S, Haffner, S, Davidson, MH, D'Agostino RB, S, Feinstein, S, Kondos, G et
404
al. Hypertriglyceridemic waist phenotype predicts increased visceral fat in
405
subjects with type 2 diabetes. Diabetes Care, 2009;10:1916-1920.
406
8. Lemieux, I, Pascot, A, Couillard, C, Lamarche, B, Tchernof, A, Almeras, N et al.
407
Hypertriglyceridemic waist: A marker of the atherogenic metabolic triad
408
(hyperinsulinemia; hyperapolipoprotein B; small, dense LDL) in men?. Circulation,
409
2000;2:179-184.
410
9. Simmons, D, Culliney, K, Joshy, G, McKenzie, A, Morgan, SM. Dental health in
411
rural Victoria: the Crossroads Household Survey. Aust. Dent. J., 2006;2:140-145.
412
10. Devers, MC, Campbell, S, Shaw, J, Zimmet, P, Simmons, D. Should liver function
413
tests be included in definitions of metabolic syndrome? Evidence from the
414
association between liver function tests, components of metabolic syndrome and
415
prevalent cardiovascular disease. Diabet. Med., 2008;5:523-529.
416
11. Alberti, KG, Zimmet, P, Shaw, J, IDF Epidemiology Task Force Consensus Group.
417
The metabolic syndrome--a new worldwide definition. Lancet,
2005;9491:1059-418
1062.
419
12. Simmons, D, Shaw, J, McKenzie, A, Eaton, S, Cameron, AJ, Zimmet, P. Is grand
420
multiparity associated with an increased risk of dysglycaemia?. Diabetologia,
421
2006;7:1522-1527.
422
13. Levey, AS, Stevens, LA, Schmid, CH, Zhang, YL, Castro, AF,3rd, Feldman, HI et
423
al. A new equation to estimate glomerular filtration rate. Ann. Intern. Med.,
424
2009;9:604-612.
425
14. Skali, H, Uno, H, Levey, AS, Inker, LA, Pfeffer, MA, Solomon, SD. Prognostic
426
assessment of estimated glomerular filtration rate by the new Chronic Kidney
427
Disease Epidemiology Collaboration equation in comparison with the Modification
428
of Diet in Renal Disease Study equation. Am. Heart J., 2011;3:548-554.
429
15. Chen, S, Guo, X, Zhang, X, Yu, S, Yang, H, Jiang, M et al. Association between
430
elevated serum alanine aminotransferase and cardiometabolic risk factors in rural
431
Chinese population: a cross-sectional study. BMC Cardiovasc. Disord.,
2015:65-015-432
0060-y.
433
16. Navaneethan, SD, Mandayam, S, Arrigain, S, Rahman, M, Winkelmayer, WC,
434
Schold, JD. Obstructive and Restrictive Lung Function Measures and CKD:
435
National Health and Nutrition Examination Survey (NHANES) 2007-2012. Am. J.
17. Tchernof, A, Despres, JP. Pathophysiology of human visceral obesity: an
438
update. Physiol. Rev., 2013;1:359-404.
439
18. Strasser, B, Arvandi, M, Siebert, U. Resistance training, visceral obesity and
440
inflammatory response: a review of the evidence. Obes. Rev., 2012;7:578-591.
441
19. Ramezankhani, A, Azizi, F, Ghanbarian, A, Parizadeh, D, Hadaegh, F. The
442
hypertriglyceridemic waist and waist-to-height ratio phenotypes and chronic
443
kidney disease: Cross-sectional and prospective investigations. Obes. Res. Clin.
444
Pract., 2016.
445
20. Hanley, AJ, Wagenknecht, LE, Festa, A, D'Agostino, RB,Jr, Haffner, SM. Alanine
446
aminotransferase and directly measured insulin sensitivity in a multiethnic cohort:
447
the Insulin Resistance Atherosclerosis Study. Diabetes Care, 2007;7:1819-1827.
448
21. Yu D, Huang J, Hu D, Chen J, Cao J, Li J. Is an appropriate cutoff of
449
hypertriglyceridemic waist designated for type 2 diabetes among Chinese adults?
450
Clin Nutr., 2010;29:192-198.
451
22. Yu, Z, Sun, L, Qi, Q, Wu, H, Lu, L, Liu, C et al. Hypertriglyceridemic waist,
452
cytokines and hyperglycaemia in Chinese. Eur. J. Clin. Invest., 2012;10:1100-1111.
453
23. Matsuzawa, Y. The metabolic syndrome and adipocytokines. FEBS Lett.,
454
2006;12:2917-2921.
FIGURE LEGENDS
Figure-1. Adjusted associations between hyperglyceridaemic waist phenotype definitions and abnormal liver and renal function by fasting
plasma glucose level
Age and body mass index were adjusted. Point estimation (95% confidence interval) was presented for each measurement.
HTGW definition 1 :both men and women: WC ≥ 85 cM & a triglyceride (TG) ≥ 1.5 mmol/L (133 mg/dl)); HTGW definition 2: for men, WC ≥90 cM and TG ≥2.0 mmol/L(177mg/dl) ; for women, WC
Figure-2. Dose-response curves between abnormal liver function and glucose by hypertriglyceridaemic waist phenotype definitions
The area indicates the distribution of fasting glucose (cyan area for Australian population; red area for Chinese population). The adjusted log odds ratio of having abnormal liver function (solid line) and the 95% confidence interval (dot line) from Logistic Regression Model with adjustment of age and body mass index (cyan line for Australian population and red line for Chinese population). The upper panel indicates association between glucose and abnormal liver function among those with HTGW phenotypes; the below panel indicates association between glucose and abnormal liver function among those without HTGW phenotypes. The three columns represent three definitions: left column indicates the HTGW definition 1 (both men and women: WC ≥ 85 cM & a triglyceride (TG) ≥ 1.5 mmol/L (133 mg/dl)); middle column indicates the HTGW definition 2 (for men, WC ≥90 cM and TG ≥2.0 mmol/L(177mg/dl) ;for women, WC ≥85 cM and TG≥1.5
Figure-3. Dose-response curves between abnormal renal function and glucose by hypertriglyceridaemic waist phenotype definitions
The area indicates the distribution of fasting glucose (cyan area for Australian population; red area for Chinese population). The adjusted log odds ratio of having abnormal renal function (solid line) and the 95% confidence interval (dot line) from Logistic Regression Model with adjustment of age and body mass index (cyan line for Australian population and red line for Chinese population). The upper panel indicates association between glucose and abnormal renal function among those with HTGW phenotypes; the below panel indicates association between glucose and abnormal renal function among those without HTGW phenotypes. The three columns represent three definitions: left column indicates the HTGW definition 1 (both men and women: WC ≥ 85 cM & a triglyceride (TG) ≥ 1.5 mmol/L (133 mg/dl)); middle column indicates the HTGW definition 2 (for men, WC ≥90 cM and TG ≥2.0 mmol/L(177mg/dl) ;for women, WC ≥85 cM and TG≥1.5 mmol/L(133 mg/dl)); and the right column indicates the HTGW definition 3 (for men: WC ≥ 90cM and TG ≥ 2.0 mmol/L (177mg/dl); for women, WC>=85cM and TG≥ 2.0 mmol/L
TABLES
Table-1. Characteristics of study participants by hyperglyceridaemic waist phenotype definitions
Country Characteristics* Definition-1 Definition-2 Definition-3
No Yes P-values No Yes P-values No Yes P-values
N 4773 983 --- 5074 682 ---- 5267 489 ----
China
Gender, Female % 2759 (57.8) 481 (48.9) <0.001 2760 (54.4) 481 (70.5) P<0.001 2955 (56.1) 288 (58.9) 0.230
Age, years 51.37(9.89) 53.71(9.55) <0.001 51.47(9.92) 54.02(9.22) P<0.001 51.6(9.91) 53.61(9.25) <0.001
Waist circumference, cm 78.25(8.59) 91.95(5.91) <0.001 78.97(8.89) 92.65(6.14) P<0.001 79.44(9.17) 92.96(5.55) <0.001
Body mass index, kgm2 23.3(3.83) 27.37(3.37) <0.001 23.47(3.83) 27.88(3.57) P<0.001 23.63(3.88) 27.92(3.79) <0.001
Fasting Glucose, mmol/L 5.53(1.26) 6.04(1.68) <0.001 5.55(1.29) 6.08(1.67) P<0.001 5.56(1.29) 6.21(1.81) <0.001
Systolic blood pressure, mmHg 129.04(20.24) 139.47(20.75) <0.001 129.53(20.31) 140.39(21.08) P<0.001 129.89(20.47) 140.81(20.57) <0.001
Diastolic blood pressure, mmHg 80.36(11.36) 87.34(11.99) <0.001 80.71(11.46) 87.82(12.07) P<0.001 80.88(11.52) 88.75(11.92) <0.001
Total cholesterol, mmol/L 4.38(0.84) 4.84(0.98) <0.001 4.4(0.84) 4.9(1.01) <0.001 4.41(0.85) 4.94(1.05) <0.001
High density lipoprotein, mmol/L 1.33(0.31) 1.23(0.3) <0.001 1.33(0.31) 1.22(0.3) <0.001 1.32(0.31) 1.19(0.3) <0.001
Low density lipoprotein, mmol/L 2.46(0.68) 2.35(0.85) <0.001 2.45(0.69) 2.33(0.85) <0.001 2.46(0.7) 2.18(0.86) <0.001
Triglyceride, mmol/L 1.25(1.04) 2.82(1.77) <0.001 1.32(1.11) 2.99(1.85) <0.001 1.33(1.09) 3.5(1.96) <0.001
Metabolic disorders, n (%) 1136 (23.8) 675 (68.7) <0.001 1223 (24.1) 590 (86.5) <0.001 1401 (26.6) 413 (84.5) <0.001
Abnormal liver function, n (%) 200 (4.2) 115 (11.7) <0.001 235 (4.6) 80 (11.7) <0.001 244 (4.6) 71 (14.5) <0.001
Abnormal renal function, n (%) 619 (13.0) 201 (20.4) <0.001 662 (13.0) 158 (23.2) <0.001 717 (13.6) 103 (21.1) <0.001
Australia
N 902 552 --- 1021 433 --- 1158 296 ---
Gender, female% 550 (61.0) 269 (48.7) <0.001 550 (53.9) 629 (62.1) 0.0038 687 (59.3) 132 (44.6) <0.001
Age, years 51.49(16.22) 55.21(14.38) <0.001 51.9(16.13) 55.27(14.18) <0.001 52.6(16.08) 54.1(13.78) 0.110
Waist circumference, cm 89.93(16.19) 100.86(13.08) <0.001 91.58(16.24) 99.98(13.68) <0.001 91.73(15.94) 103.27(12.48) <0.001
Body mass index, kgm2 26.75(5.06) 29.74(5) <0.001 27.01(4.97) 29.96(5.28) <0.001 27.23(5.09) 30.45(5.04) <0.001
Systolic blood pressure, mmHg 128.69(21.8) 136.8(22.6) <0.001 129.84(21.78) 136.32(23.36) <0.001 130.42(22.18) 137.03(22.75) <0.001
Diastolic blood pressure, mmHg 70.75(9.74) 74.53(10.35) <0.001 71.38(9.87) 74.08(10.51) <0.001 71.34(9.91) 75.47(10.35) <0.001
Total cholesterol, mmol/L 5.08(0.89) 5.63(1.08) <0.001 5.11(0.91) 5.71(1.1) <0.001 5.17(0.93) 5.76(1.16) <0.001
High density lipoprotein, mmol/L 1.54(0.38) 1.25(0.3) <0.001 1.5(0.38) 1.26(0.32) <0.001 1.5(0.37) 1.16(0.27) <0.001
Low density lipoprotein, mmol/L 3.1(0.79) 3.35(0.95) <0.001 3.13(0.8) 3.35(0.97) <0.001 3.16(0.82) 3.34(1.01) 0.0069
Triglyceride, mmol/L 0.96(0.29) 2.35(1.34) <0.001 1.04(0.36) 2.53(1.46) <0.001 1.11(0.39) 2.95(1.61) <0.001
Metabolic disorders, n (%) 171 (19.0) 393 (71.2) <0.001 234 (22.9) 330 (76.2) <0.001 309 (26.7) 255 (86.1) <0.001
Abnormal liver function, n (%) 80 (8.9) 100 (18.1) <0.001 107 (10.5) 73 (16.9) <0.001 116 (10.0) 64 (21.6) <0.001
Abnormal renal function, n (%) 74 (8.2) 65 (11.8) <0.001 87 (8.5) 52 (12.0) <0.001 106 (9.2) 33 (11.1) <0.001
Table-2. Adjusted associations between hyperglyceridaemic waist phenotype definitions and abnormal liver and renal function
Age and body mass index were adjusted. Point estimation (95% confidence interval) was presented for each measurement.
Definition-1 Definition-2 Definition-3
A
bno
rm
al li
ve
r
fu
nc
tio
n
China
Odds ratio 2.07 (1.34 to 3.21) 1.72 (1.05 to 2.82) 2.24 (1.30 to 3.86) Sensitivity 0.57 (0.52 to 0.63) 0.58 (0.52 to 0.63) 0.56 (0.51 to 0.62) 1 - specificity 0.28 (0.27 to 0.30) 0.32 (0.31 to 0.33) 0.30 (0.28 to 0.31)
Australia
Odds ratio 2.00 (1.24 to 3.23) 1.51 (0.92 to 2.47) 2.09 (1.22 to 3.59) Sensitivity 0.59 (0.52 to 0.67) 0.63 (0.56 to 0.70) 0.62 (0.54 to 0.69) 1 - specificity 0.35 (0.32 to 0.37) 0.34 (0.32 to 0.37) 0.32 (0.30 to 0.35)
A
bno
rm
al
R
enal
fu
nc
tio
n
China
Odds ratio 1.20 (0.86 to 1.66) 1.46 (1.01 to 2.09) 1.23 (0.81 to 1.87) Sensitivity 0.73 (0.70 to 0.764) 0.74 (0.71 to 0.77) 0.74 (0.71 to 0.77) 1 - specificity 0.32 (0.31 to 0.33) 0.31 (0.30 to 0.33) 0.32 (0.31 to 0.33)
Australia