ANALYTIC HIERARCHY PROCESS AND TOPSIS METHOD TO EVALUATE THE PERFORMANCE OF SCHOOLS
J.Merline Vinotha
Holy Cross College(Autonomous),Tiruchirappalli- 620002,Tamilnadu,India
Abstract-Evaluation of schools is a multi-criteria decision making (MCDM) problem. The Building up of good living status at the school level is the need of an hour.. As the honeybees fleck to the flower where there is honey, the best schools are glorified and demanded . In this paper a study has been made by applying Analytic Hierarchy Process (AHP) and Technique for Order Preference by Similarity to Ideal Solution (TOPSIS) to evaluate the performance of schools. The proposed model yields the ranking of the schools for evaluating their performance.
Keywords-Multi-Criteria Decision Analysis, Analytical Hierarchy Process, TOPSIS model.
1.
Introduction
School is an educational institution, which foster systematic learning in more or less prescribed manner. The social and psychological behavior of the child gradually transforms in a school as he interacts with his peers or teachers. This indicates that school improves and expands a child’s ways of thinking in a number of ways. The school provides a structured education and promotes a child’s mental and psychological growth. Aside from learning academics, a child will also learn other important life skills such as teamwork, good manners, unity, sharing, and responsibility. The present social set up is about multi focused competition. In this competitive world, our children should be thought provoking, creative and productive. It means that schools’ performance evaluation has become one of the most significant actions not only in the long run of an organization but for the development of the society. This could be achieved by multi criteria decision making (MCDM).
MCDM constitutes an advanced field of operations research that is devoted to the development and implementation of decision support tools and methodologies to deal with complex decision problems involving multiple criteria, goals, or objective of conflicting nature. The most preferable situation for a MCDM problem is when all ratings of the criteria and their degree of importance are known precisely, which makes it possible to arrange them in a crisp ranking .However, many of the decision making problems in the real world take place in an environment in which the goals, the constraints and the consequence of possible actions are not known precisely. These situations imply that a real decision problems are very complicated and thus often seems to be little suited to mathematical modeling because there is no crisp definition. Consequently, the ideal condition for a classic MCDM problem may not be satisfied, in particular when the decision situation involves both fuzzy and crisp data.
2.
Literature Review
The importance of school performance evaluation and improvement has received increasing emphasis as of late,such as Anugerah Sekolah Berprestasi Tinggi, Anugerah Sekolah Bestari, Anugerah Sekolah Cemerlang, Anugerah Sekolah Harapan Negara, Anugerah Menteri Pendidikan and Anugerah 3K. This position has a considerable impact on the school as it is a form of measurement to describe the degree of excellence in school performance, school quality assessment as well as information to community [12]. This situation also creates indirect competition between students [6], and parents had the option to send their children to schools that meet the required criteria. The importance of school ranking process can show the school performance. School ranking is not implemented to punish ,but to identify which schools need help in terms of infrastructure, financial or additional teachers to develop a conducive environment for teaching and learning process. School ranking should be viewed in a positive sight so that strategic planning for each school can be done. Evaluation of best technical institutions fuzzy analytical hierarchy process was developed to tolerate vagueness and uncertainty of human judgment [3]. S. Mahmoodzadeh and et.al proposed a new methodology to provide a simple approach to assess alternative projects and help decision makers to select the best one with the help of fuzzy AHP and TOPSIS technique [13]. A number of new aggregation techniques have been presented for application to the faculty selection [2].
Though many performance evaluations had been done in various fields only a few researchers concentrated on performance evaluation of schools. Suhaina Musani[14] in their study will focus on standardized examination results. They emphasized that Academic performance evaluation is the most practical way to rank the schools because it will give us a quick and cost effective of determining the performance of the school involved. They gave the importance only to academic achievements. The holistic developments of the children depends on some additional requirements such as quality of the teachers,Board, Co-scholastic area etc.
The rest of this study is structured as follows: The first part describes important aspects for the assessment of the performance of schools and presents the evaluation framework and methodology. Next part discusses the procedure and the results of empirical studies. The final results of the empirical study are presented and discussed in the final section.
3
. Evaluation framework and methods of evaluating the performance of schoolsThe hierarchy for evaluating the performance of the Schools through the Parent’s opinion
is shown in Fig 1
Hierarchy of Decision
Goal:
Criteria:
Alternatives:
Fig1: Hierarchy of evaluating the performance of the schools
3.1. Analytic Hierarchy Process (AHP)
The pairwise comparison method and the hierarchical model were developed in 1980 by T.L.Saaty in the context of the Analytical Hierarchy Process (AHP) [15, 16]. It is one of the best and most widely used MCDM approaches. AHP is an approach to decision making that involves structuring multiple choice criteria into a hierarchy, assessing the relative importance of these criteria, comparing alternatives for each criterion and determining an overall ranking of the alternatives [1]. AHP helps to capture both subjective and objective evaluation measures, providing a useful mechanism for checking the consistency of the evaluation measures and alternatives suggested by the team thus reducing bias in decision making [17]. Some of its applications include technology choice [18], vendor selection of a telecommunications system [9], project selection, budget allocation. The construction of the Pairwise Comparison matrices using Satty’s 9-point scale are illustrated [4] as follows:
Select the Best School Through Parent’s
Feedback
Education Quality(C1)
Academic Achievement (C2)
School Infrastructure
(C3)
Method of Teaching
(C4)
Fees (C5)
Quantity & Quality of the teacher
(C6)
Board (C7)
Co-Scholastic Area (C8)
(C8)
Sophistication (C9)
Table 1:SAATY’S 9-POINT SCALE OF PAIR-WISE COMPARISON
Scale Compare factor of i and j
1 Equally Important
3 Weakly Important
5 Strongly Important
7 Very Important
9 Extremely Important
2,4,6,8 Intermediate value between adjacent scales
3.2. TECHNIQUE FOR ORDER PREFERENCE BY SIMILARITY TO IDEAL SOLUTION (TOPSIS) TOPSIS, known as one of the most classical MCDM methods, was first developed by Hwang and Yoon [2], is based on the idea that the chosen alternative should have the shortest distance from the Positive Ideal Solution (PIS) and on the other side the farthest distance of the Negative Ideal Solution (NIS). The Positive Ideal Solution maximizes the benefit criteria and minimizes the cost criteria, whereas the Negative Ideal Solution maximizes the cost criteria and minimizes the benefit criteria [19, 20]. In the process of TOPSIS, the performance ratings and the weights of the criteria are given as exact values. Abo-sinna and Amer [7] extend TOPSIS approach to solve multi-objective nonlinear programming problems. Jahanshahloo et al. [5] extends the concept of TOPSIS to develop a methodology for solving multi-criteria decision-making problems with interval data.
3.3. STEPS AHP & TOPSIS METHOD
In this paper ,we use AHP and TOPSIS methods to evaluate the performance of the schools
The steps of AHP are as follows
Step1: Selection of Experts
Step2: Identify the Attributes/Criteria Step3: Identify the Alternatives Step4: Design the Hierarchy
Step5: Establish the pairwise comparison of the of the Alternatives with respect to each Criteria. Step6: Calculate the priority vectors for each of them
Step7: Establish the pairwise comparison of the Criteria Step8: Calculate the priority vectors for each of them
Step9:calculate the overall priority vectors for the criteria and the alternatives with respect to each Criteria.
Step10:Finally, calculate the AHP ranking by multiplying them.
The following are the steps of TOPSIS
Step1:Calculate the normalized decision matrix.
Step2:Calculate the weighted normalized decision matrix.
Step3:Determine the Positive Ideal solution and Negative Ideal Solution.
Step4:Calculate Separation measures for each alternative from the Positive and Negative ideal Solution. Step5:Calculate the relative closeness to the ideal Solution for each alternative.
4.
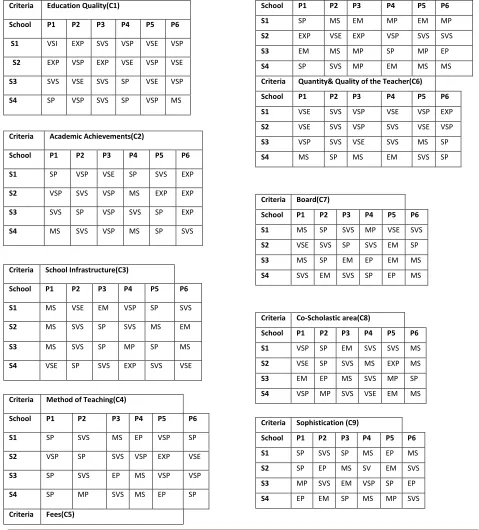
The Empirical study of performance evaluation of schoolsAfter the identification of criteria and development of alternatives, evaluation of criteria and alternatives is done by the selected parents. Parents are asked to give opinions in the form of verbal judgments. Based on the type of evaluation, verbal judgments are developed for the study. Verbal judgments from different parents are going to be used as an input for the AHP & TOPSIS algorithm. The questioners are filled through direct communication with them. Parents give their own remarks for each school for each criterion which is shown in the Table 2
Table 2-Parents opinion against each school
Criteria Education Quality(C1)
School P1 P2 P3 P4 P5 P6
S1 VSI EXP SVS VSP VSE VSP
S2 EXP VSP EXP VSE VSP VSE
S3 SVS VSE SVS SP VSE VSP
S4 SP VSP SVS SP VSP MS
Criteria School Infrastructure(C3)
School P1 P2 P3 P4 P5 P6
S1 MS VSE EM VSP SP SVS
S2 MS SVS SP SVS MS EM
S3 MS SVS SP MP SP MS
S4 VSE SP SVS EXP SVS VSE
Criteria Method of Teaching(C4)
School P1 P2 P3 P4 P5 P6
S1 SP SVS MS EP VSP SP
S2 VSP SP SVS VSP EXP VSE
S3 SP SVS EP MS VSP VSP
S4 SP MP SVS MS EP SP
Criteria Fees(C5)
School P1 P2 P3 P4 P5 P6
S1 SP MS EM MP EM MP
S2 EXP VSE EXP VSP SVS SVS
S3 EM MS MP SP MP EP
S4 SP SVS MP EM MS MS Criteria Quantity& Quality of the Teacher(C6) School P1 P2 P3 P4 P5 P6 S1 VSE SVS VSP VSE VSP EXP S2 VSE SVS VSP SVS VSE VSP S3 VSP SVS VSE SVS MS SP S4 MS SP MS EM SVS SP
Criteria Board(C7)
School P1 P2 P3 P4 P5 P6 S1 MS SP SVS MP VSE SVS S2 VSE SVS SP SVS EM SP S3 MS SP EM EP EM MS S4 SVS EM SVS SP EP MS
Criteria Co-Scholastic area(C8)
School P1 P2 P3 P4 P5 P6 S1 VSP SP EM SVS SVS MS S2 VSE SP SVS MS EXP MS S3 EM EP MS SVS MP SP S4 VSP MP SVS VSE EM MS
Criteria Sophistication (C9)
School P1 P2 P3 P4 P5 P6 S1 SP SVS SP MS EP MS S2 SP EP MS SV EM SVS S3 MP SVS EM VSP SP EP S4 EP EM SP MS MP SVS Criteria Academic Achievements(C2)
School P1 P2 P3 P4 P5 P6
S1 SP VSP VSE SP SVS EXP
S2 VSP SVS VSP MS EXP EXP
S3 SVS SP VSP SVS SP EXP
According to the verbal judgements of the parents the final ranking is calculated by AHP as follows
Step-1:
From the Table 2, the pairwise comparison matrix according to Satty’s scale mentioned in Table1 of parent -1 for the criteria Education Quality(C1) is as follows:
Table 3: Pairwise comparison matrix for C1
Education Quality S1 S2 S3 S4
S1 1 4 4 5
S2 0.25 1 0.333 0.25
S3 0.25 3 1 2
S4 0.2 4 0.5 1
Step-2:
Calculate the column sum ij i
C
for each column in table.4.
Table 4:. Column sum for C1
Education Quality S1 S2 S3 S4
S1 1 4 4 5
S2 0.25 1 0.333 0.25
S3 0.25 3 1 2
S4 0. 2 4 0.5 1
Sum 1.7 12 5.833 8.25
Step-3:
Standardized each cell ij ij
ij i
C X
C
Table 5: Standardized matrix for C1
Education Quality S1 S2 S3 S4
S1 0.588 0.333 0.686 0.606
S2 0.147 0.083 0.057 0.030
S3 0.147 0.25 0.171 0.242
Step-4:
Calculate the Priority Vector by adding the sum of the rows:
Table 6: Priority Vector for each alternative with respect to C1
Education Quality S1 S2 S3 S4 Row Average
Sum
S1 0.588 0.333 0.686 0.606 0.553
S2 0.147 0.083 0.057 0.030 0.079
S3 0.147 0.25 0.171 0.242 0.203
S4 0.118 0.333 0.086 0.121 0.165
Step-5:
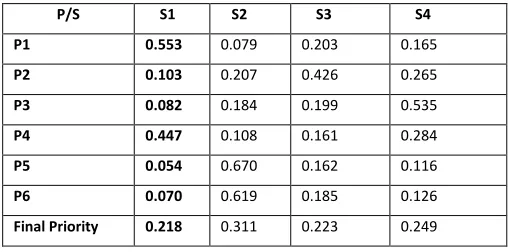
Table 7. Shows the priority vector for Education Quality for the Parents P1 to P6
Table 7
Similarly, the priority vectors for the remaining criteria are calculated.An overall priority vector of the alternatives w.r.t. each criteria are given in the table below
Table 8
School S1 S2 S3 S4
Criteria
C1 0.218 0.311 0.223 0.249
C2 0.297 0.265 0.176 0.261
C3 0.385 0.356 0.126 0.145
C4 0.196 0.374 0.209 0.226
C5 0.182 0.416 0.138 0.264
C6 0.273 0.334 0.207 0.188
P/S S1 S2 S3 S4 P1 0.553 0.079 0.203 0.165 P2 0.103 0.207 0.426 0.265
P3 0.082 0.184 0.199 0.535
P4 0.447 0.108 0.161 0.284
P5 0.054 0.670 0.162 0.116
P6 0.070 0.619 0.185 0.126
C7 0.373 0.319 0.136 0.186
C8 0.351 0.338 0.164 0.149
C9 0.299 0.259 0.225 0.217
Step6:
Then construct the pairwise comparison matrix for the nine criteria in the school selection problem, as
below
Table 9
Step7:
The following Table 10 gives the overall Priorities for each criteria Table 10
Criteria Overall Priority
C1 0.295
C2 0.205
C3 0.095
C4 0.133
C5 0.085
C6 0.104
C7 0.057
C8 0.017
C9 0.029
Step9:
Finally, the AHP ranking of alternatives is calculated by step10, which is presented in Table 11
Criteria C1 C2 C3 C4 C5 C6 C7 C8 C9
C1 1.000 9.000 5.000 6.000 5.000 1.000 6.000 7.00 5.000
C2 0.111 1.000 7.000 5.000 8.000 1.000 5.000 4.000 6.000
C3 0.200 0.143 1.000 2.000 1.000 3.000 4.000 5.000 2.000
C4 0.167 0.200 0.500 1.000 2.000 4.000 5.000 6.000 5.000
C5 0.200 0.125 1.000 0.500 1.000 5.000 1.000 4.000 3.000
C6 1.000 1.000 0.333 0.250 0.200 1.000 2.000 4.000 8.000
C7 0.167 0.200 0.250 0.200 1.000 0.500 1.000 6.000 5.000
C8 0.143 0.250 0.200 0.167 0.250 0.200 0.167 1.000 0.333
C9 0.200 0.167 0.500 0.200 0.333 0.125 0.200 3.000 1.000
Column Sum
Table 11
S1 0.263
S2 0.325
S3 0.188
S4 0.228
The above table suggests, the school S2 as thebest school from the parents' opinion.
Now, let us consider the solution by TOPSIS method. According to the parents' opinion described in Table 2 the weight for each criteria are shown in the following table
Table 12
Criteria P1 P2 P3 P4 P5 P6 Attribute
Weights
C1 8 6 7 8 7 9 7.500
C2 7 9 4 9 5 5 6.500
C3 3 2 6 4 5 5 4.167
C4 2 4 6 5 3 6 4.333
C5 5 6 8 7 6 4 6.000
C6 7 8 6 7 5 9 7.000
C7 5 8 5 4 2 6 5.000
C8 5 2 1 4 7 6 4.167
C9 4 2 3 5 3 1 3.000
Then the weight for school 1 according to the given criterion is shown in Table 21
Table 13: (S1)
Similarly the weights for other schools are calculated.Using the calculated attribute weights, the
decision matrix for the proposed model is given in Table 14 Criteria P1 P2 P3 P4 P5 P6 Attribute weight
C1 7 9 6 7 8 7 7.333
C2 5 7 8 5 6 9 6.667
C3 4 8 2 7 5 6 5.333
C4 5 6 4 1 7 5 4.667
C5 5 4 2 3 2 3 3.167
C6 8 6 7 8 7 9 7.500
C7 4 5 6 3 8 6 5.333
C8 7 5 2 6 6 4 5.000
Table 14
Criteria S1 S2 S3 S4
C1 7.333 8.000 6.667 5.667
C2 6.667 7.000 6.333 5.333
C3 5.333 4.500 4.500 7.000
C4 4.667 7.000 5.000 4.000
C5 3.167 7.500 3.000 4.000
C6 7.500 7.000 6.000 4.333
C7 5.333 5.333 3.000 4.000
C8 5.000 6.000 3.500 5.000
C9 4.167 4.000 4.000 3.500
The stepwise analysis of the TOPSIS method is given below,
Step1
: construct Normalized decision matrix by,for i=1,…,m; j=1,…,n
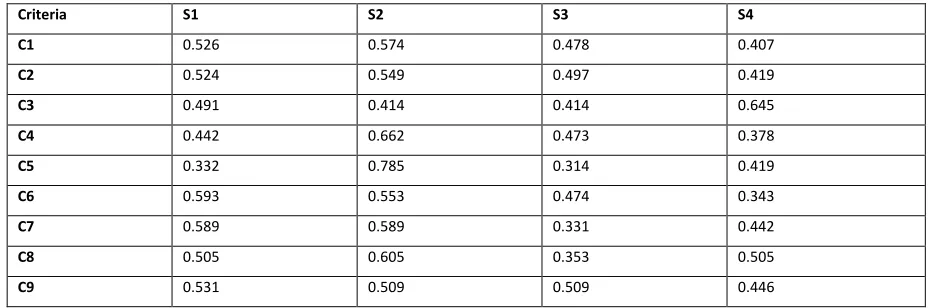
Table 15: The Normalized decision matrix
Criteria S1 S2 S3 S4
C1 0.526 0.574 0.478 0.407
C2 0.524 0.549 0.497 0.419
C3 0.491 0.414 0.414 0.645
C4 0.442 0.662 0.473 0.378
C5 0.332 0.785 0.314 0.419
C6 0.593 0.553 0.474 0.343
C7 0.589 0.589 0.331 0.442
C8 0.505 0.605 0.353 0.505
C9 0.531 0.509 0.509 0.446
Step2: Construct the weighted normalized decision matrix, by multiplying each row of the normalized decision matrix by its associated weight.
Table- 16: Weighted Normalized Decision Matrix
Criteria S1 S2 S3 S4
C1 3.945 4.305 3.585 3.053
C2 3.406 3.569 3.231 2.724
C3 2.046 1.725 1.725 2.688
C4 1.915 2.868 2.049 1.638
C5 1.992 4.71 1.884 2.514
C6 4.151 3.871 3.318 2.401
C8 2.104 2.521 1.471 2.104
C9 1.593 1.527 1.527 1.338
Step3:
Determining the Positive Ideal solution & Negative Ideal Solution
A* = {v1* , …, vn*}, where *
{
max
( )j ij
i
v v if jJ
min
( )iji
v if jJ’}
PIS d*= {4.305, 3.569, 2.688, 2.868, 4.71, 4.151, 2.945, 2.521, 1.593}
Negative ideal solution:-
A' = {v1' , …, vn' }, where vj’ ={
min
( )ij iv if jJ
max
( )iji
v if jJ’}
NIS = {3.053, 2.724, 1.725, 1.638, 1.884, 2.401, 1.655, 1.471, 1.338}
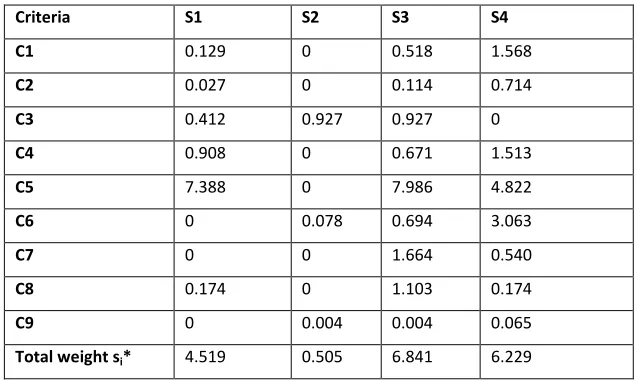
Step -4: Calculate the separation measures for each alternative. The separation from the ideal alternative is:
2 1/2 *
)]
[ ( *j ij i
j
S
v v i = 1, …, mTable 17: separation measurefrom Positive Idea Solution
Criteria S1 S2 S3 S4
C1 0.129 0 0.518 1.568
C2 0.027 0 0.114 0.714
C3 0.412 0.927 0.927 0
C4 0.908 0 0.671 1.513
C5 7.388 0 7.986 4.822
C6 0 0.078 0.694 3.063
C7 0 0 1.664 0.540
C8 0.174 0 1.103 0.174
C9 0 0.004 0.004 0.065
Total weight si* 4.519 0.505 6.841 6.229
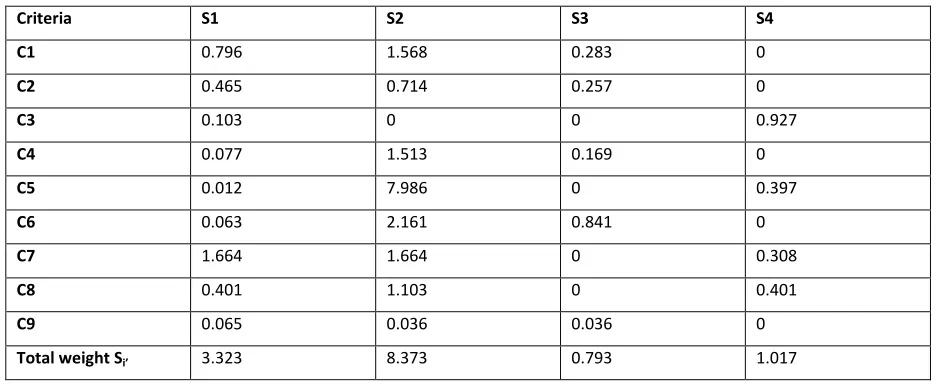
Similarly, the separation from the negative ideal alternative is:
2 1/2 '
)]
[ ( 'j ij i
j
Table 18: separation from Negative Ideal Solution
Criteria S1 S2 S3 S4
C1 0.796 1.568 0.283 0
C2 0.465 0.714 0.257 0
C3 0.103 0 0 0.927
C4 0.077 1.513 0.169 0
C5 0.012 7.986 0 0.397
C6 0.063 2.161 0.841 0
C7 1.664 1.664 0 0.308
C8 0.401 1.103 0 0.401
C9 0.065 0.036 0.036 0
Total weight Si’ 3.323 8.373 0.793 1.017
Step -5: Calculate the relative closeness to the ideal solution Ci* and the corresponding rank of the school
' *
i i
i i
i i
S C
s S
0 < Ci* <1
Table3.11. Relative Closeness & Rank of School
School Result Rank
S1 0.424 2
S2 0.943 1
S3 0.104 4
S4 0.140 3
From the above table, the School S2 has been selected as the best school according to the parent’s opinion.
Ranking of schools by AHP & TOPSIS
School Rank
AHP TOPSIS
S1 2 2
S2 1 1
S3 4 4
5.Conclusion
This paper concludes that the school (s2) is the best in their performance and followed by school(s1) and school(s4). The overall performance of the school (s3) is not good enough with respect to different criteria among all other schools. It is notable that the Academic Achievements of the school (s1) are better than the schools (s2), (s3) & (s4). So it can also be concluded that in spite of having the Academic Achievements of a school may not be the best school in the parent’s opinion. Every study done in this research will guide the schools to upgrade themselves with unique ideas.
REFERENCES
[1]. Christos Douligeris & Ian J. Pereira, “A Telecommunications Quality Study Using the Analytic Hierarchy Process,” IEEE Journal on Selected Areas in Communications, Vol. 12, No. 2, 1994.
[2] C.L. Hwang, K. Yoon, “Multiple Attribute Decision Making Methods and Applications”, Springer, Berlin Heidelberg, 1981.
[3] Debmallya Chatterjee and Dr.Bani Mukherjee “Study of Fuzzy-Ahp Model To Search The Criterion In The Evaluation Of The Best Technical Institutions: A Case Study”, International Journal of Engineering Science and Technology, Vol. 2(7), 2499-2510, 2010.
[4] F. Zahedi, “The analytic Hierarchy process-A survey of the method and its applications,” Interfaces, Vol. 16, pp.343-350, 1977.
[5] G.R. Jahanshahloo, F. Hosseinzadeh Lotfi, M. Izadikhah, “An algorithmic method to extend TOPSIS for decision-making problems with interval data”, Applied Mathematics and Computation, 2005 .
[6]. H. Y. Wu, J. K. Chen, I. S. Chen and H. H. Zhuo, Measurement, 45 (5), 856-880 2012.
[7] M.A. Abo-Sinna, & A.H. Amer, “Extensions of TOPSIS for multi-objective large-scale nonlinear programming problems”, Applied Mathematics and Computation 162, 243–256, 2005
[8]. M. Borhan and A.A. Jemain, Social Indicators Research, 106, 187–197 2012.
[9] Maggie, C.Y.Tam, & V.M. Rao Tummala, “An application of the AHP in vendor selection of a telecommunications system,” Omega, Vol. 29, pp.171-182, 2001. Dipendra Nath Ghosh et al UNIASCIT,
Vol 1 (2), 2011, 63-70 70
[10] P. Kousalya, V. Ravindranath, and K. Vizayakumar, “Student Absenteeism in Engineering Colleges: Evaluation of Alternatives Using AHP”, Journal of Applied Mathematics and Decision Sciences, Volume 2006, Article ID 58232, Pages 1–26.
[11] Pin-Chang Chen, “A Fuzzy Multiple Criteria Decision Making Model in Employee Recruitment”, IJCSNS International Journal of Computer Science and Network Security, Vol. .9 No.7, pp:113-117, 2009. [12]. S. Bradley, G. Johnes and J. Millington, European Journal of Operational Research, 135, 545-568 2001.
[13] S. Mahmoodzadeh, J. Shahrabi, M. Pariazar, & M. S. Zaeri “Project Selection by Using Fuzzy AHP and TOPSIS Technique”, World Academy of Science, Engineering and Technology 30,pp: 333-338, 2007. [14]Suhaina Musani and Abdul Aziz Jemain,A Fuzzy MCDM Approach for Evaluating School
Performance Based on Linguistic Information, AIP Conf. Proc. 1571, 1006 ,2013. [15 ]T. L. Saaty, The Analytic Hierarchy Process, McGraw-Hill, New York, 1980.
[16 ]T. L. Saaty,"Priority Setting in Complex Problems," IEEE Transactions on Engineering Management, Vol.30, No.3, pp.140- 155, 1983.
[18]V.S.Akkineni & S.Nanjundasastry “The Analytic Hierarchy Process for Choice of Technologies,” Technological Forecasting and Social Change, Vol. 38, pp.151-158, 1990.
[19]Wang Y.M and Elhag T.M.S, “Fuzzy TOPSIS method based on alpha level sets with an application to bridge risk assessment”, Expert Systems with Applications, 31, 309-319, 2006.
[20] Wang, Y-J and Lee, H-S, “Generilizing TOPSIS for fuzzy multiple-criteria group decision-making”, Computers & Mathematics with Applications, 53(11), 1762-1772, 2007.