Software Maintainability Prediction Using Soft Computing
Techniques
Mamta Punia1, Er. Amandeep Kaur2
1
Computer Science and Engineering, Sri Sukhmani Institute Of Engineering and Technology Derabassi, Punjab, India
2
Asstt. Prof., Computer Science and Engineering, Sri Sukhmani Institute Of Engineering and Technology Derabassi, Punjab, India
Abstract
Component-Based Software Engineering (CBSE) is kind of approach to develop software systems by using existing components with the objective to improve software quality and productivity. However, after deployment on customer site, maintenance of Component Based Software (CBS) becomes an important issue to be discussed and later to be solved.
In this paper we have proposed a soft computing technique to automatically predict software maintainability levels i.e. Very Good, Good, Medium, Poor and Very Poor. Firstly, Fuzzy Logic is used here to construct set of rules (35 i.e. 243 rules) and generate training (150 training data sets) and testing data sets (80 validation set). The data sets generated by the fuzzy logic, are given as input to the Neural Networks and the performance was evaluated using performance parameters, MARE 0.28 % and MRE 0.16 %. In our proposed work, we also combine the neuro-fuzzy approach with the data sets generated by the fuzzy logic to take the advantage of some of the desirable features of a neuro-fuzzy approach, such as learning ability and good interpretability. In addition, we choose fixed triangular membership functions and hybrid optimization method for training. The model was trained well and predicts satisfactory results with MARE 24% and MRE 0.009% when compared with neural network.
Keywords: software quality model, neural network, fuzzy
logic, neuro fuzzy.
1.
Introduction
The selection of the appropriate internal metrics for measuring the maintainability of one specific product depends on the nature of this product and the programming language used during its implementation. For example, in the case of object–oriented programming languages, the metrics that can also be used are: weighted methods per class, lack of cohesion of methods, coupling between objects, depth of inheritance tree, number of children, etc. Moreover, software metrics are also aimed to being acceptable indicators not only in order to estimate the structure, the cohesion and the coupling of the modules of
a software program, but also for the estimation of the readability, the clearness, the sufficiency of the comments and the simplicity of their code.
For the last few years various system developers and researchers have been interested in finding the factors that affect software development productivity and maintenance and proved that maintenance cost reduction can only be achieved by making appropriate decisions on the strategic characteristics. In literature some metrics have been proposed for measuring/predicting maintainability. In 1984 a tool was proposed which operated at syntactic level. Then another model was proposed which considered design attributes. Another model was proposed which used quality metrics. Software Maturity index [SMI] considered only modules being added or removed. Another model was proposed which considers only the design aspect. A fuzzy model has also been proposed where, Maintainability is a measure of characteristics of software e.g. source code readability, documentation quality and cohesiveness among source code and documents. [5]
There are several quality models and others proposed by researchers for general software applications, but none of them, addresses the concerns of component-based systems directly in detail, though, maintainability characteristic is supported by almost all. In our work, we have proposed a fuzzy logic approach for predicting maintainability of CBS. It is often impossible to estimate software maintainability directly. For example, maintainability is affected by many different factors such as modularity, understandability etc and there is no exact method or formula to measure them. [4, 1, 3, 7, 8]
To predict maintainability of CBS, one needs to establish a relationship of the factors with maintainability to achieve the desired goal. Our emphasis is on characterization of factors aimed at foreseeing the CBS maintenance time and effort.CBS maintenance may require replacement of faulty component or change in the component. Replacement and selection of satisfactory component increase maintenance cost and time. It is required to define and discuss efficient component selection and component storage in repository so that
component can be easily selected and retrieved from repository. For this we have proposed a framework for CBS maintenance which gives a coherent process of solving maintenance problem and some guidelines for CBS developer to ensure high maintainability.
2.
To Study and Analyze Existing Model in
Cbse to Predict Software Maintainability
Maintainability is process of finding and correcting fault or bugs within time duration and under specified resource. It may also increase efficiency of software by adding some new features. In the competitive global markets, maintainability is becoming a matter of growing importance for many companies. Over the last few years software maintenance claims a large proportion of organizational resources. It is thought that many problems in software maintenance result from inadequate practices in software development such as lack of programming standards and guidelines, solving bugs and problems, implementing changes, testing, impact analysis and integration with other systems. Planning for maintainability can minimize changes during design and reduce maintenance-related change orders and rework in construction. In traditional software it can be calculated with MTTR (mean time to repair) formula i.e. mean time required to effect a change. Based of literature survey, we found that generally maintenance activity is based on following factors which belong to software: Size, Complexity, Operating procedure, System user/customer, Maintenance procedure, Maintenance team, Environment facilities and Documentation.
Maintainability can also be considered as an internal attribute if it is solely derived from software system. Several internal attribute of program source code can impact on maintainability for example modularity. Thus measurement of all these attribute is necessary in order to compute maintainability. Several quality models have defined maintainability including its sub factors as one the main characteristics of software quality. The ISO 9126 model for software product quality recognizes maintainability as one of the 6 main characteristics of software product quality, with adaptability, changeability, stability, and testability as sub characteristics of maintainability.[3] The factors influencing maintainability are testability understandability, modifiability.[1] Simplicity, conciseness and modularity as the main maintainability factors.[4] These models proposed the maintainability factors for traditional software in which software is not a combination of different programming language. Size of traditional software is based on source line of code and source code is completely visible to user but in case of Component Based software engineering
software is combination of in house built or COTS (commercial off the self) components written in different programming language and glue code written in scripting language used for their integration. Source code of COTS components is not visible to developer. Based on the literature survey we found that maintainability of CBS cannot be measure directly. Various quality models define maintainability as an important quality factors. According to these models maintainability is a combination of sub factors. We compared these quality models to understand maintainability and its sub factors
2.1
Study of Various Quality Models to Identify
Maintainability Factors
In the 1970’s mostly theoretical models such as Knuth model were proposed which proved correctness of small programs using mathematical approach. During 1975-1980 first software quality models were developed which defined the elements of software quality and their interconnections (tables of correlation, priorities, etc.).They were divided into two category (1) “Fixed” quality models (2) “Self defined” quality models. Later several models of software quality have been proposed each one of these consist of quality factors that help to identify maintainability’s sub attributes. We have studied different types of software quality models in software engineering each of these quality models consists of number of characteristics. Selecting which one of the quality models to use is a real challenge.
2.1.1
ISO 9126 Quality Model
The ISO 9126 Quality Model defines maintainability as "the ease with which a software product can be modified to correct defects, modified to meet new requirements, modified to make future maintenance easier or adapted to a changed environment. ISO 9126 is a part of ISO 9000 standard which is most important standard for Quality assurance and evaluation. This model was based on McCall and Boehm model and developed to satisfy existing business needs. It defined 6
Qualitycharacteristics:(1)Functionality (2)Reliability (3)Usability (4)Efficiency (5)Maint-ainability (6)Portability. ISO 9126 described four sub attributes of maintainability:
(i) Analyzability: It defines effort required by the developers to diagnose deficiencies or causes of failures, or for identification of parts of which require modification.
(iii) Stability: tendency of software system to remain within defined and recognizable limits despite the impact of disturbances.
(iv)Testability: It describes the effort required for testing and validation of modified software and requirements. [3]
2.1.2
McCall's Quality Model – 1977 and Boehm’s
Quality Model - 1978
B.W. Boehm’s quality model is similar to McCall’s quality model in that it represents a hierarchical structure of characteristics, each of which contributes to the total quality. The factors influencing maintainability are Testability, Understandability and Modifiability. [1] The three main perspectives for characterizing the quality attributes of a software product. These perspectives are:-
(i) Product revision-ability to modify or change, including error correction and system adaptation. It includes three quality factors, Maintainability, Flexibility, Testability
(ii) Product transition- adaptability to new environments. It covers Portability, Reusability and Interoperability criteria.
(iii)Product operations- basic operational characteristics. Correctness, Reliability, Efficiency, Integrity and Usability are quality factors in this perspective. [4]
In total McCall identified the 11 quality factors broken down by the 3 perspectives, as listed above. Maintainability quality factor has three sub factors simplicity, conciseness and modularity. [4]
2.1.3
FURPS (Functionality Usability Reliability
Performance Supportability) Quality Model and
Dromey’s Quality Model
The FURPS model was proposed by Robert Grady in 1992. Later it was extended by IBM Rational Software. The characteristics that are taken into consideration in FURPS model are: Functionality, Usability, Reliability, Performance, and Supportability. Supportability includes testability, extensibility, adaptability, maintainability, compatibility, Configurability, serviceability, installability, and localizability / internationalization. [7]
For evaluating requirement determination, design and implementation phases, a working framework proposed. Corresponding to the products resulted from each stage of the development process; the framework consists of three models:
(i) Requirement model-The high-level attributes for the requirement quality model are accurate,
understandable, implementable, adaptable, and process mature.
(ii) Design model-The high-level attributes for the design quality model include accurate; effective, understandable, adaptable and process mature.
(iii)Implementation quality model.[8]
None of these two models defined characteristics or sub characteristics related to maintainability factors identified are very useful for traditional software. For CBS new factors must be included. The goal of component-based development is to build and maintain software systems by using existing software components i.e. promoting reusability. CBS maintenance is very much influenced by reusability factors. It is combination of components which interacts each other by their providing and required interfaces. So interaction complexity will have great impact on CBS maintainability during maintenance. So in case of CBS more activities need to be added as there is more emphasis on component. These activities are nothing but some characteristics of component which have high impact on CBS maintenance. These characteristics were used by various authors to calculate CBS maintainability using fuzzy logic and neural network. Following are some factors given by various authors in their work which have strong correlation with CBS maintenance.
• Available outgoing interaction
• Coupling and cohesion between component
• Component interface complexity
• Component reusability(CR)
• Component average interaction density
• Available incoming interaction
• Average cyclomatic complexity
• Understanding of component
• Testability
• Granularity-(How small or big it should be?)
• Modifiability
• Integrability etc.
On the basis of literature survey, we have observed that different authors have considered different factors for calculation of maintainability. No paper has been successful to give an exact description of factors which have great impact on CBS maintenance so it is impossible to rely on one observation and factor to predict maintainability. In our work we have identified various factors of CBS maintenance and these factors can be subdivided into various sub factors. Table 1 represents them clearly.
Maintainability is the quality factor including all those software characteristics designed to make the product easier to maintain towards the end of achieving greater productivity in the maintenance stage. Various researchers have calculated maintainability on the basis of some of the factors shown in table 1 using different soft computing techniques and experimental result shows that these factors have strong relation with maintainability. Different authors and researcher proposed their model for different factors and different soft computing techniques on different software (traditional software or CBS). If developers take care of these factors during development of software then poor maintenance cost and effort will be required in future and productivity will increase.
Based upon the work done by various academicians and researchers in this field, it is found out that the outcomes of experimental results may differ from one author to another based on techniques, datasets and the number of projects in
the dataset used. A tabular summary of the works analyzed is
given belo w.
A t the end
we conclude that although maintainability is undisputedly considered one of the fundamental quality attributes of software systems the research community has not yet produced a sound and accepted definition or even a common understanding what maintainability actually is. Even they are not sure about factors and still face difficulty in selecting influencing parameters of maintainability. In future more data and information can be added in tables shown above as we don’t claim completion of these tables. The gathering of detailed data on the effects of the models and factors will not only help to improve the models but gradually lead to a rich set of empirical data that will allow us to determine various facts which require more concentration during development of software and result in the benefit of quality improvements.
3.
Proposed Software Maintainability
Prediction Model Using Soft Computing
Technique
Based upon the work done by various researchers five factors have been selected from the table 1, which give clear definition of maintainability of component based software are: Documentation Quality (Documentation with good Understandability), Modifiability, Integrability, Testability and Coupling between components
The factors mentioned above are discussed below in detail. Documentation of the component is considered for understanding the behavior of the component, as source code of these components are not available to the maintainers. Documentation provides the ease with which a user can learn to operate, prepare inputs for, and interpret outputs of a system. A good quality document must include functional description, installation details, system administrator’s guide, system reference manuals etc.
Modifiability says how easy it is to modify the component to satisfy local requirements. Extensibility included the possibility to easily extend the product features towards public transportation information management, instead of bare fair collection and accounting. Thus, at the architecture level, extensions to the architecture were implemented through variation points. Variability was traced through the chain of development artifacts. Portability in the architecture dimension meant capturing the environment-specific software into components or
Maintenance factors
Sub attributes
Modifiability Variability, Extensibility,
Scalability, Flexibility, Changeability, Customizability, Tailorability
Integrability Interoperability
Robustness Reliability, Availability, Defect
trend, Portability(to run on different condition), Adaptability, Fault tolerance, Recoverability, Failure frequency
Average interaction complexity
Available incoming interface , Available outgoing interface, Active outgoing interface, Active incoming interface, Coupling between component
Understandabilit y
Documentation Quality,
Readability of source code,
Simplicity, Conciseness, Consistency, Structuredness,
Usability, Operability
Verifiability Completeness, Correctness,
Testability
Reusability Generality, Modularity, Software
layers that encapsulated environment users from the environment. Environment here means e.g. different peripherals, display and printer types. Therefore, in some of the portability requirements variability was used as a supporting technique. One of the portability requirements was also that the software should be portable to a single fixed node and to a distributed environment with the main module and a trip computer.
Integrability, i.e. conformance to component model and standards used in the system the component is to be integrated in. Interoperability with components from many different vendors. Although interoperability is an execution quality, it is related to integrability and transitively to maintainability.
Testability of components through monitoring intra-component behavior and failures. When designing software, the degree of coupling and cohesion has a major impact on both the efficiency and maintenance of the programs. If module A requires module B before it can be tested, but module B also requires module C, we might think that developing C first is the answer. Often though, these dependencies are interrelated so perhaps C also requires elements of A. For this reason, designing the modules can be complex and requires us to think about how the modules are related together. Component modifies another’s code, e.g., jumps into the middle of a routine. This is because of high dependency so coupling between components needs to be very low. So lower is coupling better is the maintainability. In our work we have proposed maintainability model using soft computing techniques namely fuzzy logic, artificial neural network and neuro fuzzy. For experimental purpose we have used matlab. Experimental results are found to be satisfactory.
3.1
Fuzzy Logic
The Fuzzy Logic Toolbox for use with MATLAB is a tool for solving problems with fuzzy logic. The concept of Fuzzy Logic (FL) was conceived at the beginning of the 70s by Lotfi Zadeh, a professor at the University of California at Berkley, and presented not as a control methodology, but as a way of processing data by allowing partial set membership rather than crisp set membership or non-membership. Fuzzy logic is a convenient way to map an input space to an output space. The mathematical concepts behind fuzzy reasoning are very simple. What makes fuzzy nice is the “naturalness” of its approach and not its far-reaching complexity. The FL model is empirically-based, relying on an operator's experience rather than their technical understanding of the system. It provides a convenient way to represent Linguistic variables and subjective probability. Linguistic variables are the variables whose values are not numbers but words or
sentences in a natural or artificial language. The use of fuzzy set theory allows to incorporate the unavoidable imprecision of the data.
Figure.1: Fuzzy Inference System
3.2
Proposed fuzzy model for predicting
maintainability
Steps for execution of rule base fuzzy system
Fuzzification
• Identify the inputs (factors in our case) and define their ranges based on domain expert.
• Identify the outputs(maintainability) and define their ranges based on domain expert
• Select a membership function and create the fuzzy partitions (degree of fuzzy membership function) for each input and output.
Fuzzy inference System
• Construct the rule base (based on input range)
In our case
There are five factors each having three values “Low”, “Medium”, “High”. So no of rule=>35 =243 rule
• These membership values are then processed in fuzzy domain by inference engine based on knowledge base (rule base and data base) supplied by domain experts.
Defuzzification
• Combine the rules and defuzzify them to get crisp output
Implementing a fuzzy system requires that the different categories of the different inputs be represented by fuzzy sets which, in turn, is represented by membership functions.
Membership function
A membership function (MF) is a curve that defines how each point in the input space is mapped to a membership value (or degree of membership) between 0 and 1. The input space is sometimes referred to as the universe of discourse, a fancy name for a simple concept. There are total 11 membership functions available in Matlab. We
Fuzzificati on
Crisp Input
Inference System (Decision Making System)
Knowledge Base (Fuzzy Rules)
Defuzzificat ion
considered Triangular Membership Functions (TMF) for our problem, because of its simplicity and heavy use by researchers for prediction models.
Triangular Membership Functions (TMF)
It is a three-point function, defined by minimum a, maximum c and modal value b i.e. TMF (α, b, c), where (α ≤ b≤ c).
a: lower boundary and c: upper boundary where membership degree is zero
b: the centre where membership degree is 1
Figure 2 : Triangular Membership Functions
We propose that maintainability of component-based system is a measure of five factors mentioned above. These combined factors can be used to measure the maintainability, as it cannot be measured directly. The proposed fuzzy logic based model considers all five factors as inputs and provides a crisp value of maintainability using the Rule Base. All inputs can be classified into fuzzy sets viz. Low, Medium and High. The output maintainability is classified as Very good, Good, Medium, Poor and Very poor.
3.3
Experiment in Matlab
3.3.1
Matlab
MATLAB is a programming environment for algorithm development, data analysis, visualization, and numerical computation. Using MATLAB, you can solve technical computing problems faster than with traditional programming languages, such as C, C++, and FORTRAN. You can use MATLAB in a wide range of applications, including signal and image processing, communications, control design, test and measurement, financial modeling and analysis, and computational biology. For a million engineers and scientists in industry and academia, MATLAB is the language of technical computing. MATLAB users come from various backgrounds of engineering, science, and economics. MATLAB is widely used in academic and research institutions as well as industrial enterprises.
In our work we are using fuzzy logic toolbox of Matlab for prediction of maintainability. We will do it using the graphical user interface (GUI) tools provided by the Fuzzy Logic Toolbox. Although it’s possible to use the Fuzzy Logic Toolbox by working strictly from the command line, in general it’s much easier to build a system graphically.
There are five primary GUI tools for building, editing, and observing fuzzy inference systems in the Fuzzy Logic Toolbox: the Fuzzy Inference System or FIS Editor, the Membership Function Editor, the Rule Editor and the Rule Viewer. These GUIs are dynamically linked, in that changes you make to the FIS using one of them, can affect what you see on any of the other open GUIs.
3.3.2
Fuzzy inference System (FIS)
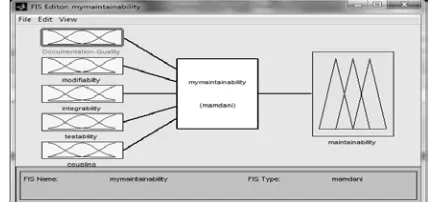
The FIS Editor handles the high-level issues for the system: How many inputs and output variables? What are their names? The Fuzzy Logic Toolbox doesn’t limit the number of inputs. There are two types of fuzzy inference systems that can be implemented in the Fuzzy Logic Toolbox: Mamdani-type and Sugeno-type. These two types of inference systems vary somewhat in the way outputs are determined. Mamdani’s fuzzy inference method is the most commonly seen fuzzy methodology. Mamdani’s method was among the first control systems built using fuzzy set theory. It was proposed in 1975 by EbrahimMamdani as an attempt to control a steam engine and boiler combination by synthesizing a set of linguistic control rules obtained from experienced human operators. Mamdani’s effort was based on LotfiZadeh’s paper on fuzzy algorithms for complex systems and decision processes. [6] Following figure show FIS editor in which we have defined five factors as input variable and maintainability as an output variable.
Figure 3: Fuzzy inference system editor
3.3.3
Fuzzify Inputs
The first step is to take the inputs and determine the degree to which they belong to each of the appropriate fuzzy sets via membership functions. In the Fuzzy Logic Toolbox, the input is always a crisp numerical value limited to the universe of discourse of the input variable and the output is a fuzzy degree of membership in the qualifying linguistic set (always the interval between 0 and 1). Following table indicates that there are three membership functions Low, Medium and High for input 1 i.e. Documentation quality. Value of these functions is taken on the basis of expert’s opinion. ≥ ≤ ≤ − − ≤ ≤ − − ≤ = c x if c x b if b c x c b x a if a b a x a x if x A 0 0 ) ( µ 0 1
a b c x
Figure 4: Input variable for Documentation Quality
Similarly we perform same steps for other factors.
Figure 5: Input
Variable for
Modifiability
Figure 6: Input Variable for Integrability
Figure.7: Input Variable for Testability
Figure8: Input Variable for Coupling
Figure 9: Output Variable for Maintainability
3.3.4
Construction of rules and apply fuzzy
operation on rules
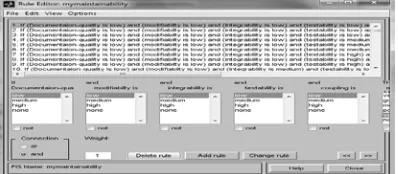
Once the inputs have been fuzzified, all possible combinations (35 i.e. 243) of inputs are considered to design the rule base. Each rule corresponds to one of the five outputs based on the expert opinions. The input to the fuzzy operator is two or more membership values from fuzzified input variables. In our case we are using Min(AND) fuzzy operator. The output is a single truth value. Some of the proposed rules are shown as:
1.
“
IF Documentation Quality is Low AND modifiability is Low AND integrability is Low AND testability is Low AND coupling is Low THEN Maintainability is Very poor.”2. “IF Documentation Quality is Low AND modifiability is Low AND integrability is Low AND testability is Low AND coupling is Medium THEN Maintainability is Very poor.”
3. “IF Documentation Quality is Low AND modifiability is Low AND integrability is Low AND testability is Low AND coupling is High THEN Maintainability is Very poor.”
4. “IF Documentation Quality is Low AND modifiability is Low AND integrability is Low AND testability is Medium AND coupling is Low THEN Maintainability is Very poor.” And so on. All 243 rules are inserted into the rule editor and a rule base is created. Depending on a particular set of inputs, a rule is fired. Using the rule viewer, output i.e. maintainability is observed for a particular set of inputs using the MatLab Fuzzy tool box.
3.3.5
Defuzzification
Since decisions are based on the testing of all of the rules in an FIS, the rules must be combined in some manner in order to make a decision. Aggregation is the process by
which the fuzzy sets that represent the outputs of each rule are combined into a single fuzzy set. Aggregation only occurs once for each output variable, just prior to the fifth and final step, defuzzification. The input of the aggregation process is the list of truncated output functions returned by the implication process for each rule. The output of the aggregation process is one fuzzy set for each output variable. The input for the defuzzification process is a fuzzy set (the aggregate output fuzzy set) and the output is a single number. As much as fuzziness helps the rule evaluation during the intermediate steps, the final desired output for each variable is generally a single number. However, the aggregate of a fuzzy set encompasses a range of output values, and so must be defuzzified in order to resolve a single output value from the set. There are five built-in defuzzification methods supported: centroid, bisector, middle of maximum (the average of the maximum value of the output set), largest of maximum, and smallest of maximum. We are using centroid calculation, which returns the center of area under the curve.
Figure 11: Rule Viewer Showing Some of the Rules
3.4
Computational Result
After applying the dataset to all inputs and output, we generate 243 rules. These rules are then inserted to rule editor of fuzzy inference system as shown in figure 12. After addition of rule we go to the view and select rule
option. A popup rule viewer window will appear which shows defuzzification of rules. In figure 12, we have shown a circle which indicates that we can fire any one or more rules by entering appropriate input. Let us say if Documentation quality is .3, modifiability is .78, integrability is .8, testability is .85 and coupling is .25 then we get the value of maintainability .299 i.e. maintainability is good.
Further we have calculated maintainability value with the help of Center of Gravity (COG) formula and results are found to be satisfactory.To calculate result for the model, we have given the following inputs to the model Documentation Quality=0.3, Modifiability=0.78, Integrability=0.9, Testability=0.85 Coupling=0.25 When these inputs are fuzzified, we get membership function shown in table 2
Table 2: Calculation of Membership Value
With these inputs, rule number 79 and 160 fire. When we composite these rule we get the following value-
Min(0.25,1,1,0.58,1)=0.25 Min(0.5,1,1,0.58,1)=0.5 When both rules are implicated, they give the maintainability good.
Figure 12: Computation of maintainability
3.5
Computation of maintainability M using center
of gravity formula
Centre Of Gravity (COG) =
(1)
=
(2)
=
(3) M = .2712
Upon opening the Surface Viewer, we are presented with a two-dimensional curve that represents the mapping from five factors to maintainability.
Para mete rs
Docum entatio n Quality
Modi fiabil ity
Integ rabili ty
Test abili ty
Cou plin g
Input 0.3 0.78 0.8 0.85 0.25
Mem bers ship value
Low=0. 25 Medium =0.5
High =1 High =1
High =1 High =1
Hig h=0. 58 Hig h=0. 58
Figure 13: Surface View of rule for integrability and testability
Figure 14: Surface View of rule for modifiability and coupling
Figure 15: Surface View of rule for testability and coupling
3.6
Discussion
In our work we have considered maintainability as a combination of five factors and assumed that these factors have high impact on maintainability. In order to validate this concept fuzzy approach of soft computing techniques is used. By applying fuzzy approach we are able to know which of the factors has how much of effect on maintainability. Overall measure indicates that all these factors have strong relation with maintainability.
4.
Proposed Artificial Neural Network Model
The data sets generated by the fuzzy model in section 3.1 now acts as input datasets to our proposed Artificial Neural Network Model. It is known that NN model can be used to model any arbitrary input-output mapping and are capable of approximating any measurable function. So NN should be able to model the functionality of the software reusability also. In a broad sense, the neural network itself is a model because the topology and transfer functions of the nodes are usually formulated to match functions of the nodes is usually formulated to match the current problem. [9] The NN model is further validated on the validation sets generated by the fuzzy models. For our work we have used feed forward back propagation supervised algorithm is used. The model is trained with four inputs namely: Documentation, Modifiability, Integrability, Testability and Coupling between components with one output i.e. software maintainability. Trainbr, training function is used
to train the network. We have used the linear transfer functions Tansig for the experimentation. The network is best trained with four input, one output and 10 neurons at the hidden layer as shown in figure 16.
Figure : 16 Trained Neural Network Model with 05 Inputs, 1 Output and 10 Neurons at the Hidden Layer
4.1
Experimental Design
The experiment is conducted to explore the possibilities of usage NN for assessing software maintainability level of component base system. The network used in this work belongs to multilayer feed forward networks and is referred to as M-H-Q network with M source nodes, H nodes in hidden layer and Q nodes in the output layer. [4] The summary of ANN used in this study is shown in Table 3.
Table 3: NN Model Summaries
Architecture
Layers 10
Input unit 05
Output unit 01
Training
Algorithm Back Propagation
Training Function Trainbr
Transfer Function Tansig
Training
Figure 17: Training with Trainbr function
4.2
Experimental Results
In this section we present the analysis performed to find relationship between independent variables (Documentation, Modifiability, Integrability, Testability and Coupling between components) and one dependable variable i.e. software maintainability. The data set contains 150 different data sets generated by the rule base of fuzzy logic. The performance function used here is Mean Absolute Error (MRE) and Mean Absolute Relative Error (MARE). [2] n actual actual estimate n i ÷ − = ∑ =1 MARE (1)
where: estimate is the network output for each observation, n is the number of observations to estimate whether models are biased and tend to over or under estimate, the MRE is calculated as follows: [2]
n actual actual estimate n i ÷ − =∑ =1 MRE (2)
The model is trained using training data sets and was evaluated on validation data set. Table 4 shows the MARE, and MRE results of ANN model evaluated on validation data set.
Table 4: Validation results of ANN Model
Comparison of the experimental results and measured software maintainability of the validation set is shown in figure 18. From which it becomes evident that our proposed model produces reusability levels that are comparable to the measured reusability levels as predicted by the proposed fuzzy model.
Figure 18: Validation Result with 10 Neurons
Based upon experimental results it is concluded that Artificial Neural Network can also be used to predict software maintainability level with reasonable accuracy.
5.
Proposed Neuro-Fuzzy Model
Fuzzy logic approach is beneficial for measuring the reusability of software components as the conventional model based approaches are difficult to be implemented. Unfortunately, with the increase in the complexity of the problem being modeled various constitutes for measuring the reusability, has led to rely on another technique which is mostly known as neuro-fuzzy approach. The neuro-fuzzy hybrid system combines the advantages of fuzzy logic system, which deal with explicit knowledge that can be explained and understood, and neural networks, which deals with implicit knowledge, which can be acquired by learning. Neuro-Fuzzy Inference system using given input/output dataset has been constructed a Fuzzy Inference System (FIS) whose membership function parameters are tuned (adjusted) using either a back propagation algorithm alone or in combination with the least squares type of method. The parameters associated with the membership function (trimf is used here) will change through the learning process. The computation of these parameters (or their adjustment) is facilitated by a gradient vector, which provides a measure of how well the fuzzy inference system is modeling the input/output for a given set of parameters. Sugeno-type neuro-fuzzy inference system is used for the experimental purposes, as sugeno output member functions are either constant or linear.
5.1
Adaptive Neuro-fuzzy Inference System
(ANFIS) Training
To train an ANFIS, training data set (data sets generated by fuzzy model) is loaded from the load data option of ANFIS editor as shown in figure 19.
Figure 19: Training data set for ANFIS
In the fuzzy inference system linguistic variables are then assigned to the input parameters based on their values. The assignment of the linguistics variables depends on the range of the input measurement. Documentation, Modifiability, Integrability, Testability and Coupling between components are assigned three linguistic variables Low, Medium and High. The output i.e. maintainability is assigned five linguistic variables Very Poor, Poor, Medium, Good and Very Good as discussed in fuzzy section 3.1 of proposed fuzzy model. A network type structure similar to that of a neural network which maps input through input membership function and associated
Performance Measures Validation Set
MARE 0.28
MRE 0.16
Validation Results Data Set 0 0.1 0.2 0.3 0.4 0.5 0.6 0.7 0.8 0.9 1
1591317212529333741454953576165
parameters, and then through output membership functions and associated parameters to output, is used to interpret the input/output map. After successfully loading the data, FIS structure will be generated using grid portioning as shown in figure 20.
Figure 20: Neural Network incorporating the Fuzzy Inference System
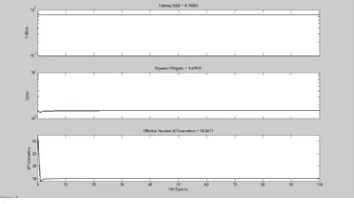
The error tolerance is used to create training stopping criteria, which is related to the error size. The training will stop after the training data error remains within this tolerance. In our study we have kept error tolerance to a value 0.005. To start training, hybrid optimization (the default, mixed least squares and back propagation) method is used. The numbers of training epochs is set to 60. The training of the anfis for 60 epochs and the training error reduces after each epoch as shown by the figure 21 and stabilities at the error value of 0.0483, so at this point the network is said to be converged.
Figure 21: Plot of Training Error V/s EpochsTesting Fuzzy Inference
System
During the testing phase, when developed system is tested against the validation data sets and an average testing error 0.045 is obtained. The performance function used here is Mean Absolute Error (MRE) and Mean Absolute Relative Error (MARE) [2] as discussed in section 4.2. The model is trained using training data sets and was evaluated on two validation data sets. Table 5 shows the MARE, and MRE results of Neuro-fuzzy model evaluated on validation data sets. The table also indicates that the proposed model trained and predicts well using Neuro-Fuzzy Approach.
Table 5: Validation Results of Neuro-Fuzzy Model
The plot between the actual outputs of validation set and the expected output of validation set is shown in figure 22.
Figure 22: Validation Result
As the actual output produced by the proposed “Neuro-Fuzzy Maintainability Evaluation System” is close to the expected output, so the system can be recommended for automatic prediction of software maintainability level for the component based system.
6.
CONCLUSION AND FUTURE WORK
In this paper we have proposed a soft computing technique to automatically predict software maintainability levels i.e. Very Good, Good, Medium, Poor and Very Poor. Firstly, Fuzzy Logic is used here to construct set of rules (35 i.e. 243 rules) and generate training (150 training data sets) and testing data sets (80 validation set). The data sets generated by the fuzzy logic, are given as input to the Neural Networks and the performance was evaluated using performance parameters, MARE 0.28 % and MRE 0.16 %. In our proposed work, we also combine the neuro-fuzzy approach with the data sets generated by the fuzzy logic to take the advantage of some of the desirable features of a neuro-fuzzy approach, such as learning ability and good interpretability. In addition, we choose fixed triangular membership functions and hybrid optimization method for training. The model was trained well and predicts satisfactory results with MARE 24% and MRE 0.009% when compared with neural network.
Finally, the neuro-fuzzy technique allows the integration of numerical data and expert knowledge; it can be a powerful tool to tackle important problems in Software Engineering and neuro-fuzzy approach can be further extends as software metric model, cost estimation model, effort prediction model, software reliability and quality prediction.
References
[1] B.W.Boehm, J.R.Brown, H.Kaspar, M.Lipow, G.McLeod, M.Merritt, “Characteristics of Software Quality,” North Holland Publishing, Amsterdam, The Netherlands, 1978.
[2] G.Finnie and G.E.Wittig, “AI Tools for Software Development Effort
Performance Measures Validation Set
MARE 0.24
MRE 0.009
Validation Results Dataset
-0.2 0 0.2 0.4 0.6 0.8 1 1.2
15913172125293337414549535761 Actual Maintainability
P r e d i c t e d M a i
Actual Maintainability
Predicated Maintainability
Estimation,” http://epublications.bond.edu.au/info tech_pubs/7, 1996.
[3] ISO/IEC TR 9126, “Software engineering - product quality -part 3: Internal metrics,” Geneva, Switzerland, 2003.
[4] J. McCall and G. Walters, “Factors in Software Quality,” The National Technical Information Service (NTIS), Springfield, VA, USA, 1997.
[5] K.K.Aggarwal, Y.Singh, A.Kaur, O.P.Sangwan, “A neural net-based approach to test oracle,” ACM SIGSOFT, pp.1-6, 2004.
[6] L.A.Zadeh, “Outline of a new approach tothe analysis of complex systems and decision processes,” IEEE Trans. Systems Man Cybemet. SMC-3, pp. 28-44,1973.
[7] R.Grady, Practical Software Metrics for Project Management and Process Improvement. Prentice Hall. ISBN 0-13-821844-7, p. 32, 1992.
[8] R.G.Dromey, “A model for software product quality,” IEEE Transactions on Software Engineering, 21(2), pp.146– 162, 1995.