ISSN 2348 - 7968
Process Parameters Optimization in Turning of Aluminum
Using a New Hybrid Approach
Vivek Soni 1, Sharifuddin Mondal 2and Bhagat Singh 3
1,2,3
Mechanical Engineering Department, Jaypee University of Engineering and Technology, Guna-473226, Madhya Pradesh, India
Abstract
In the present work, mathematical models have been developed for the prediction of surface roughness and material removal rate in turning of aluminum on CNC lathe. Turning process parameters: cutting speed, feed, and depth of cut are used as inputs to the developed models. Response surface methodology approach has been adopted to develop these statistical models. Further, multi-objective genetic algorithm optimization technique is applied to find the optimum values of these parameters. Experiments have been conducted to validate the developed models.
Keywords: Surface roughness (Ra), Material removal rate (MRR), Response surface methodology (RSM), Multi-objective genetic algorithm (MOGA).
1. Introduction
Aluminum is widely used to produce the automobile parts by turning process. It is highly desirable that products with good surface quality are manufactured in least time. The surface quality of products is generally determined in terms of the measured surface roughness. Surface roughness and material removal rate is generally dependent on the cutting parameters such as: cutting speed, feed rate and depth of cut. Right selections of these cutting parameters are essential in order to produce components with good surface finish and high tolerance in least time. High material removal rate is required in order to decrease the machining time. In the last few decades, a lot of work has been carried out to improve the product quality and efficiency in machining. Still many aspects related to the domain of this study are yet to be explored.
Lalwani et al. [1] studied the effect of cutting parameters in turning on cutting forces and surface roughness. Dickinson [2], Grieve et al. [3], and Fischer and Elrod [4] developed a turning model in which tool nose radius and feed rate are taken into account but cutting speed is ignored. Yang and Tarng [5] studied on optimal cutting parameters using Taguchi method in turning. Singh and Rao [6] studied the effects of cutting conditions and tool geometry on the surface roughness in the finish hard turning. Choudhury and El-Baradie [7] used RSM and 23 factorial designs to estimate the surface roughness during the turning process of high strength steel. Nian et al. [8] investigated the
optimization of CNC turning operations by Taguchi method with multiple performance characteristics. On the other hand, Lin et al. [9] developed a network model to estimate the surface roughness and cutting forces. Wang et al. [10] investigated the effect of tool nose vibration on surface roughness during turning theoretically and experimentally.
In this paper, the application of RSM on the turning of aluminum AISI 1040 steel with carbide tool has been carried out to develop the mathematical models of the surface roughness (Ra) and material removal rate (MRR) so as to investigate the influences of cutting parameters. For finding optimum value of these cutting parameters, multi-objective genetic algorithm technique has been utilized.
2. Experimental set-up and experimentation
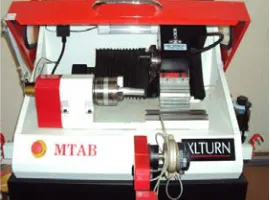
The turning experiments were carried out in dry cutting conditions on Bench-top CNC Trainer Machine as shown in Fig. 1, which have a maximum spindle speed of 150-3000 rpm and a maximum spindle power of 2.2 kW. Ranges of cutting parameters were selected as given in the tool manufacturer’s catalogue. In this study, three factors were studied and their low– middle–high levels are given in Table 1. However in all experiments depth of cut (0.6-0.8 mm), cutting speed (300-600 m/min), and feed rate (0.2-0.4 mm/rev) were taken as fixed values. Each tool was used for once and turned surface length was in 20 mm between centers. After the experiments, Surface roughness measurement has been done using a portable stylus-type profilometer, Talysurf (Taylor Hobson, Surtronic 3+, UK) as shown in Fig. 2.
IJISET - International Journal of Innovative Science, Engineering & Technology, Vol. 1 Issue 3, May 2014. www.ijiset.com
ISSN 2348 - 7968 Table 1: Cutting parameters and their levels
Cutting Parameters
Level 1 Level 2 Level 3
Speed (N) (m/min) 300 450 600
Feed (f) (mm/rev) 0.2 0.3 0.4
Depth of Cut (d) (mm)
0.6 0.7 0.8
Fig. 2 Surface roughness tester.
2.1 Work-piece and tool materials
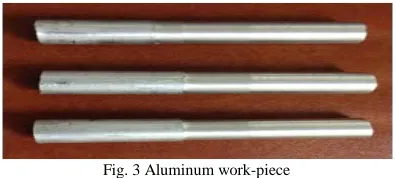
The sample material was Aluminum (diameter 32mm and length 60mm) as shown in Fig. 3. The chemical composition of Aluminum in mass% is as follows: Aluminum 99.70, Si 0.10, Fe 0.20, Zn 0.03, Ga 0.03 Cu0.01, M0.02, Others Each 0.03, Total of all Impurities 0.30. Pure aluminum is soft, ductile, corrosion resistant and high electrical conductivity. Alloying with other elements is necessary to provide the higher strengths needed for other applications. The cutting tool used for turning is carbide tools.
Fig. 3 Aluminum work-piece
3. Response Surface Methodology (RSM)
Response surface methodology is used to examine the relationship between one or more response variables and a set of quantitative experimental variables or factors. It is clear from the literature that the surface roughness and material removal rate equations are not linear and they could be predicted using the response surface method. The important controlling factors and their levels considered in the present analysis are presented in Table 1. In the present work, Box-Behnken Design has been considered for analysis of surface roughness (Ra) and material removal rate (MRR) in turning of aluminum. The set of
experimental runs conducted according to Box-Behnken Design is presented in Table 2. Then response surface analysis has been done to develop the quadratic models of surface roughness and material removal rate in terms of the cutting parameters: speed, feed and depth of cut.
Table 2: Design of Experimental Runs Speed
(m/min)
Feed (mm/rev)
Depth of Cut (mm)
Surface roughness
Ra(µm)
MRR (mm3/sec)
300 0.2 0.7 1.746 1.752
600 0.2 0.7 2.263 2.662
300 0.4 0.7 2.011 1.609
600 0.4 0.7 2.062 3.686
300 0.3 0.6 2.569 2.419
600 0.3 0.6 2.179 3.696
300 0.3 0.8 3.173 3.227
600 0.3 0.8 3.589 8.091
450 0.2 0.6 2.614 5.572
450 0.4 0.6 1.761 2.023
450 0.3 0.8 3.853 5.863
450 0.4 0.8 3.804 6.846
450 0.3 0.7 2.338 1.465
450 0.3 0.7 2.341 1.478
450 0.3 0.7 2.336 1.462
3.1 Mathematical models for
Ra
and MRR
Response surface methodology has been adopted to develop the quadratic models for surface roughness and material removal rate as given in equations (1) and (2), respectively.
39.804 0.001 11.857 107.493
23.796 67.503 0.008
0.013 42.426
Ra V f d
f f d d V f
V d f d
= − × − × − ×
− × × + × × − × ×
+ × × + × ×
(1)
179.583 0.048 147.127 431.148
61.890 266.465 0.019
0.060 143.800
MRR V f d
f f d d V f
V d f d
= − × − × − ×
+ × × + × × + × ×
+ × × + × ×
(2)
3.2 Analysis of Variance (ANOVA) for
Ra
and MRR
www.ijiset.com
ISSN 2348 - 7968
removal rate is 0.000, which establishes that the developed models are statistically significant.
Table 3: Analysis of variance (ANOVA) for Ra
Source DF Seq SS
Adj SS
Adj MS
F P
Regression 9 6.759 6.759 0.7510 30.05 0.001 Linear 3 3.557 2.050 0.6833 27.34 0.002 Square 3 2.595 2.252 0.7509 30.04 0.001 Interaction 3 0.606 0.606 0.2020 8.09 0.023 Residual
Error
5 0.124 0.124 0.0249
Lack-of-Fit
3 0.124 0.124 0.0416 6577 0.000
Pure Error 2 0.000 0.000 0.0000 Total 14 6.884
Table 4: Analysis of variance (ANOVA) for MRR
Source DF Seq SS Adj SS
Adj MS
F P
Regression 9 62.964 62.964 6.996 14.75 0.004 Linear 3 23.767 36.242 12.08 25.47 0.002 Square 3 31.164 23.795 7.931 16.72 0.005 Interaction 3 8.0327 8.032 2.677 5.64 0.046 Residual
Error
5 2.3718 2.371 0.474
Lack-of-Fit
3 2.3717 2.371 0.790 1092 9
0.000
Pure Error 2 0.0001 0.000 0.000 Total 14 65.336
3.3 Surface Plots for
Ra
and MRR
Surface plots for Ra and MRR are plotted to ascertain the effect of cutting parameters on these responses. With the increase in speed, feed and depth of cut both the responses increases as shown in Figs. 4-9.
Ra (µm)
2.0 2.5 3.0
0.
0 3
f (mm/rev)
0.2
0.3
R ( ) 3.0
3.5
0 6 0.4 0 4
0.7 0.6
0.8
d (mm)
Fig. 4 Surface plot of Ra w.r.t. f and d
Ra (µm)
2.0 2.5 3.0
30
500 v (m/min) 00 400
500 R ( ) 3 0
3.5
0 6 600 600
0.7 0.6
0.8
d (mm)
Fig. 5 Surface plot of Ra w.r.t. v and d
Ra (µm)
1.8 2.0
30 00 500 v (m/min) 00 400
500 R ( )
2.2 2.4
0.3 0.4
f (mm/r ev) 0.2
600
Fig. 6 Surface plot of Ra w.r.t. v and f
MRR (mm3 /sec)
2 4
0.
0 3 f (mm/rev) 0.2
0.3 MRR (mm3 /sec)
6 8
0 6 0.4 0 4
0.7 0.6
0.8
d (mm)
Fig. 7 Surface plot of MRR w.r.t. f and d
MRR (mm3 /sec)
0.0 2.5
30
500 v (m/min) 00 400
500 MRR (mm3 /sec)5.0
7.5
600 600
0.7 0.6
0.8 d (mm)
Fig. 8 Surface plot of MRR w.r.t. v and d
MRR (mm3 /sec)
1 2
30 00 500 v (m/min) 00 400
500 MRR (mm3 /sec)
3 4
0.2 600
0.3 0.2
0.4
f (mm/rev)
IJISET - International Journal of Innovative Science, Engineering & Technology, Vol. 1 Issue 3, May 2014. www.ijiset.com
ISSN 2348 - 7968
4. Optimization of Process Parameters
In the present analysis, response surface methodology has been adopted to develop mathematical models for surface roughness and material removal rate. Moreover, from the analysis it has been concluded that the parameters affecting these responses are; speed, feed and depth of cut. With the increase of these parameters, both surface roughness and material removal rate is enhanced as observed in the Figs. 4-9. However, to have a good surface finish of the turned jobs, surface roughness should be less. On the other hand in order to improve the productivity and less power consumption, material removal rate should be high. Therefore, the prime objective is to minimize surface roughness and maximize material removal rate. So, the present work is a multiobjective optimization problem. Multi-objective formulations are realistic models for many complex engineering optimization problems. In many real-life problems, objectives under consideration conflict with each other, and optimizing a particular solution with respect to a single objective can result in unacceptable results with respect to the other objectives. A reasonable solution to a multi-objective problem is to investigate a set of solutions, each of which satisfies the objectives at an acceptable level without being dominated by any other solution. A suitable multiobjective optimization technique has to be adopted in order to minimize one function and simultaneously maximize the other within the same lower and upper bounds for both the responses. Genetic algorithm is such optimization technique which is well suited for this purpose.
4.1 Multiobjective Genetic Algorithm (MOGA)
In this paper, surface roughness is minimized and material removal rate is maximized using genetic algorithms (GA). GA is well suited to solve such multi-objective optimization problems. In the present analysis, expression for surface roughness (Ra) and material removal rate (MRR) using response surface methodology as developed in equations (1) and (2) are utilized to find the optimum solutions.
The multiobjective problem in the present case is;
Minimize;
39.804 0.001 11.857 107.493
23.796 67.503 0.008
0.013 42.426
Ra V f d
f f d d V f
V d f d
= − × − × − ×
− × × + × × − × ×
+ × × + × ×
and, Maximize;
179.583 0.048 147.127 431.148
61.890 266.465 0.019
0.060 143.800
MRR V f d
f f d d V f
V d f d
= − × − × − ×
+ × × + × × + × ×
+ × × + × ×
with upper and lower bounds given by;
600 V 300≤ ≤
4 . 0 f 2 .
0 ≤ ≤
8 . 0 d 6 .
0 ≤ ≤
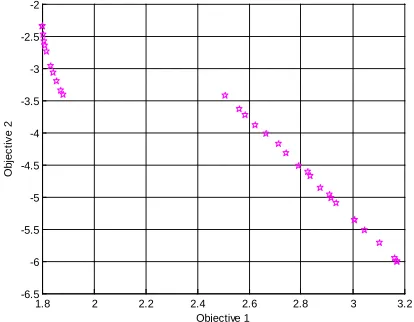
4.2 Optimal Pareto Solutions
In the present work, MATLAB software is used to generate codes for the optimization of the process parameters. A suitable fitness function is selected. Following GA parameters has been selected;
Population size: 200 No. of iterations: 500 Crossover probability: 0.8 Mutation probability: 0.8
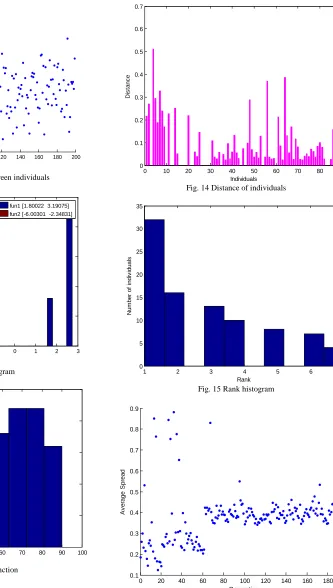
In multiobjective optimization problem single solution cannot be achieved. In the present study, 32 optimal solutions have been achieved. The detailed spread and contribution of each individual in optimization search space is presented as shown in Figs. 10-16. Out of these 32 solutions best four have been selected, depending on the compromise for both surface roughness (Ra) and material removal rate (MRR). These best four solutions are presented in Table 5.
1.8 2 2.2 2.4 2.6 2.8 3 3.2 -6.5
-6 -5.5 -5 -4.5 -4 -3.5 -3 -2.5 -2
Objective 1
O
bj
ec
ti
v
e 2
ISSN 2348 - 7968
20 40 60 80 100 120 140 160 180 200 40
50 60 70 80 90 100 110
Generation
A
v
er
gae D
is
tanc
e
Fig. 11 Average distance between individuals
-6 -5 -4 -3 -2 -1 0 1 2 3 0
5 10 15 20 25
g
Score (range)
N
um
ber
of
i
ndi
v
idual
s
fun1 [1.80022 3.19075] fun2 [-6.00301 -2.34831]
Fig. 12 Score histogram
0 10 20 30 40 50 60 70 80 90 100 0
5 10 15 20 25
Individual
N
um
ber
of
c
hi
ldr
en
Fig. 13 Selection function
0 10 20 30 40 50 60 70 80 90 0
0.1 0.2 0.3 0.4 0.5 0.6 0.7
Individuals
D
is
tanc
e
Fig. 14 Distance of individuals
1 2 3 4 5 6 7
0 5 10 15 20 25 30 35
Rank
N
um
ber
of
i
ndi
v
idual
s
Fig. 15 Rank histogram
0 20 40 60 80 100 120 140 160 180 200 0.1
0.2 0.3 0.4 0.5 0.6 0.7 0.8 0.9
Generation
A
v
er
age S
pr
ead
IJISET - International Journal of Innovative Science, Engineering & Technology, Vol. 1 Issue 3, May 2014. www.ijiset.com
ISSN 2348 - 7968
Table 5: Best four optimal solution
Sl No. Ra
(µm)
MRR
(mm3/sec) V
(m/min) f
(mm/rev) d
(mm)
1 1.881 3.416 300.05 0.40 0.60 2 2.833 4.738 443.48 0.21 0.77
3 2.982 5.318 437.07 0.2 0.78
4 1.846 3.094 300.13 0.39 0.60
5. Conclusions
This paper presents the findings of an experimental investigation into the effects of speed, feed and depth of cut on the surface roughness and material removal rate while turning aluminum bars. Genetic Algorithm is best multiobjective optimization technique as it learns the best fit of multiple models. It unveils better performance in enhancement of surface finish and material removal rate while turning operation. The optimal values of surface roughness and material removal rate obtained from GA are presented in Table 5. The Optimal cutting conditions obtained from GA are also obtained as shown in Table 5. The present analysis provides the production engineers an insight view into the factors affecting the surface finish and material removal rate. Aforesaid principle can be utilized for the better productivity in modern industries and also improving the tool life. This work can be further extended by considering other parameters such as tool geometry, flank wear, tool life, other tool and workpiece materials and also cutting fluid etc. Moreover, other multiobjective optimization techniques can be invoked for further improvement of the optimal solutions.
References
[1] D. I. Lalwani, N. K. Mehta, and P. K. Jain, “Experimental investigations of cutting parameters influence on cutting forces and surface roughness in finish hard turning of MDN250 steel”, J. Mater. Process Technol., Vol. 206, 2008, pp. 167–179.
[2] G. R. Dickinson, “A survey of factors affecting surface finish”, in: Proceedings of the Conference on Properties and Metrology of Surfaces, Institution of Mechanical Engineers, (UK), 3K, 1968, pp. 135–147.
[3] D. J. Grieve, H. Kaliszer, and G. W. Rowe, “The effects of cutting conditions on bearing area parameters”, in: Proceedings of the 9th International Machine Tool Design and Research Conference, 2, 1968, pp. 989–1004.
[4] H. L. Fischer, and J. T. Elrod, “Surface finish as a function of tool geometry and feed: a theoretical approach”, Microtechnic, Vol. 25, 1971, pp. 175–178.
[5] W. H. Yang, and Y. S. Tarng, “Design optimization of cutting parameters for turning operations based on Taguchi method”, J. Mater. Process Technol., Vol. 84, 1998, pp. 112– 129.
[6] D. Singh, and P. V. Rao, “A surface roughness prediction model for hard turning process”, Int. J. Adv. Manuf. Technol., Vol. 32, 2007, pp. 1115–1124.
[7] I. A. Choudhury, and M. A. El-Baradie, “Surface roughness prediction in the turning of high-strength steel by factorial design of experiments”, J. Mater. Process Technol., Vol. 67, 1997, pp. 55–61.
[8] C. Y. Nian, W. H. Yang, and Y. S. Tarng, “Optimization of turning operations with multiple performance characteristics”, J. Mater. Process Technol., Vol. 95, 1999, pp. 90–96.
[9] W. S. Lin, B. Y. Lee, and C. L. Wu, “Modeling the surface roughness and cutting force for turning”, J. Mater. Process Technol., Vol. 108, 2001, pp. 286– 293.