Volume 10, No. 2, March-April 2019
International Journal of Advanced Research in Computer Science
RESEARCH PAPER
Available Online at www.ijarcs.info
THE EFFECT OF ELECTROCARDIOGRAM ON ARRHYTHMIA USING A
DIGITAL PROCESSING APPLICATION
Macarthy Osuo-Genseleke
Computer Science
Ignatius Ajuru University of Education Port-Harcourt, River State, Nigeria
Abstract:The analytical process of Electrocardiogram (ECG) is an important area of study in health science while handling digital signs. The reason is as a result of the rapid growth of medical activities going on in the world and the advancement in computing technology which plays a great role to the recognition of abnormalities at different phases from bio-medical signals. The heart is usually examined by Electrocardiogram device. Its productivity is in waveform as well as in a P-Q-R-S slope form. Q-R-S is an important characteristic of the waveform. This paper seeks to study and demonstrate ECG indicators for arrhythmia using a digital processing application, MatLAB to showcase its non-linear signal processing structure. The Q-R-S duration, RR interval and heart rate of clients are most vital parameters to consider during an ECG test. .
Keywords:Heart, Heart Rate, Blood Pressure, Arrhythmia, Electrocardiogram, tachycardia, bradycardia
I. INTRODUCTION
A. The Heart
The human heart is made of the left and right portion. The right portion has its porch and ventricle while the left portion has its own porch and pericardium. A septum which is like a wall divides the two portions of the heart. According to [1], the humans heart in men and women weighs about 280 to 340 and 230 to 280 grams respectively This paper dwells on an abnormal heart disorder which can be easily traced through a client’s blood pressure. These ailments are usually detected [2] from electrocardiographic (ECG) medical -signal.
B. Blood Pressure
This is a true reflection of the rate at which the heart pumps the blood. A client’s heart beat determines blood flow. Heart beat can be normal or abnormal. For abnormal, the heartbeat can be too fast (during exercise) or too slow. In a situation where one’s heartbeat is too fast and it is above 100 beats per minute (bpm) we refer to it as tachycardia while bradycardia is for a heartbeat that is slow, below 60bpm, [16]. One method of measuring the changes of heart rate is the examination of spontaneous heart rate variability
(HRV) from a standard 24-hour ambulatory
electrocardiographic Holter recording, [25,26].
C. Arrhythmia
It is an electrical heart disorder that can starts in superior cavity or can originate in the hearts lower cavity [20]. It is a heart condition in which one’s heartbeat is unbalanced. Ones heartbeat can be fast, or slow. In most humans with healthy heart from birth, as they progress in life, the heart develops an abnormal electrical pathway that causes arrhythmia. Its signs which includes the impression
of fast heartbeat, dizziness and fainting is very essential. Although, most categories of arrhythmia have no warning sign [16], but when signs are existing they might consist of palpitations or feeling a pause between heartbeats [23]. In severe circumstances, lightheadedness, passing out, might be the case.
D. Signal Processing
Signals are series of mathematical facts that differs by means of a fundamental independent variable. It is suitable in handling problems from various categories of fields.
E. Bio-signals
Bio-signals [3] are the biological facts from our physiques that can be achieved through biomedical instrument that will produce real-time results to the medical practitioner. These biomedical instruments measure parameters like blood pressure, heart rate, blood glucose level, oxygen saturation level, and so on. All bio-signals are used for analysis, check clients, therapy and health risk assessment [4]. An examples of a medical instrument for bio-signals is Electrocardiography (ECG).
F. Electrocardiographic (ECG)
the heart. A classic ECG signal waveform of a standard heart beat is shown below,
Fig 1. A pictorial view of an ECG signal. [6]
G. Normal ECG Waveform
According to [3], the ECG bio-signal waveform is in a regular form with one cycle consisting of P wave, QRS complex wave, and T wave, as shown in Figure 1 above.
The right and left superior cavities of the heart makes up the P wave, the right and left bottom cavities makes the QRS complex wave, while T wave signifies a state of rest for the heart cavities.
Fig. 2 Electrical pattern across the hearts activity [3]
H. Abnormal ECG Pattern
[image:2.612.104.448.379.485.2]Fig 3. The Interpretation of the three traces of ECG beats [13]
II. RESEARCHBACKGROUND
Heart arrhythmia is a type of heart ailment in which one’s heartbeat is instable. One’s heart frequency may be too slow or fast, it may be firm or disordered (15]. Some can be very harmful and cause unexpected cardiac death while others may be troublesome but not deadly.
III. RELATEDWORK
Arrhythmia have emotional impact on millions of people. [16], ln Europe and North America, as of 2014, atrial fibrillation affected approximately 2% to 3% of the inhabitants. [17], Atrial fibrillation and atrial flutter occasioned 112,000 deaths in 2013, and 29,000 in 1990. [18], unexpected cardiac death is the reason of almost half of demises as a result of cardiovascular ailments and roughly 15% of loss universally. [19], nearly 80% of unexpected cardiac death is as a result of ventricular arrhythmias.] Arrhythmias occurs at any age but mostly amongst elderly people [19].
IV. CAUSESOFARRTHYTHMIA
Arrhythmias takes place due to problem in the hearts electrical structure. Its causes consist of:
A. Irritable heart cells
This happens when the heart begins to breakdown and begin to send out electrical pointers when ordinarily they would not. These signs affect the regular signals from the regular pacemaker within the heart which then complicates the heart and makes it beat unevenly.
B. Blocked signals
The electrical signs that articulates the heart to beat may get congested,which will suddenly result to the slow beating of the heart.
C. Abnormal pathways
There are times the electrical signals start at the right place and time, but get interjected and are lead astray so they don’t trail the right pathway through your heart and cause an arrhythmia.
D. Medicines and stimulating substances
These are situations were medicine and other constituents such as caffeine, nicotine and alcohol can cause an arrhythmia
V. PARAMETERS
The parameters used for ECG analysis are QRS durations, R-R interval and heart rate. They are explained below [22];
A. QRS duration
This is gotten by allotting samples between the QRS complex and the sampling frequency. This duration helps us to ascertain whether the signal is irregular or normal. A QRS duration of a normal ECG pointer ranges from 0.06 to 0.10 seconds.
B. R-R Interval
This is calculated by dividing the number of samples between R-Peaks and sampling frequency.
C. Heart rate
This can be achieved by using the formulae shown in Equation (1);
Heart rate=60 /RR interval in seconds ……... (1)
Table 1. Summarized ECG test showing QRS duration, RR intervals and heart rates for arrhythmia. source: [5]
Signal RR Interval (seconds) Heart rate(beats/min) QRS duration(seconds) Condition
Normal 0.791 75.84 0.094 Standard
Signal A 0.877 68.41 0.093 Normal
Signal B 0.911 65.83 0.088 Normal
Signal C 1.059 56.65 0.238 Abnormal
Signal D 0.80 75.00 0.080 Normal
Signal E 0.516 116.07 0.0197 Abnormal
Signal F 0.78 76.90 0.083 Normal
Signal G 0.45 133.33 0.162 Abnormal
VI. RESEARCHMETHODOLOGY
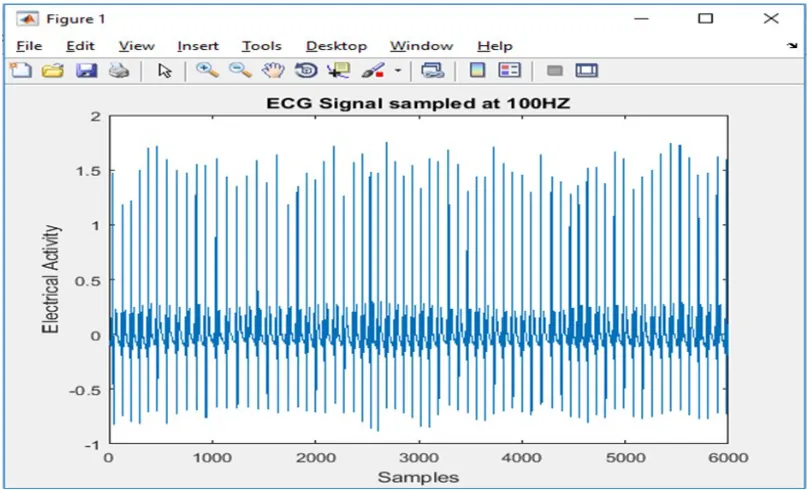
Raw Data used for demonstration arrhythmia is gotten from eleceng.dit.ie/dorran/matlab/ecg.txt. The text file online has the reading and codes are read from the text file and simulated to get the graph below using Matlab 2015a. The
electrical non-linear wave form is performed using 6 samples with 6000 readings. The graph showing the non- linear structure of arrhythmia is shown in Figure 4 below;
FIG 4: A non Linear structure for Arrhythmia using MatLAB 2015a
VII. CONCLUSION
This paper presents the effect ECG on arrhythmia, an abnormal heart disease using digital signal processing. 6 different samples with 6000 readings was used. The
parameters considered are the heart rates, QRS and RR interval of the ECG machine. The resultant effect is a non – Linear graph.
VIII. REFERENCES
[image:4.612.104.510.351.596.2]Abnormality in Electrocardiogram (ECG) Signals Based on Katz’s and Higuchi’s Method Under Fractal Dimensions,” Computational Biology and Bioinformatics. Vol. 4, pp. 27-36, 2016.
[2] Cardiovascular Disease. [Online]. Available:
http://www.who.int/cardiovascular_diseases/en/, accessed: 2016.02.27
[3] T. O. Takpor, and C. Nduijuba, “ECG Biosignal: Vital for Detecting Cardiovascular Diseases,” Proceedings of the World Congress on Engineering. vol .I, 2016.
[4] M. Baumert, A. Porta and A. Cichocki, “Biomedical Signal Processing: From a Conceptual Framework to Clinical Applications,” in Proc. IEEE Journal and Magzine, vol. 104, pp. 64–71, February 2016.
[5] P. T. Rao, S. K. Rao, G. Manikanta and S. R. Kumar,
“Distinguishing Normal and Abnormal ECG Signal,” Indian Journal of Science and Technology, vol. 9,pp. 1-5, 2016.
[6] E. Gajendra and J. Kumar, “A Novel Approach of ECG Classification for Diagnosis of Heart Diseases: Review,” International Journal of Advanced Research in Computer Engineering & Technology (IJARCET), vol. 4, pp. 4096-4100, 2015.
[7] R. Ahmed and S. Arafat, “Cardiac Arrhythmia Classification Using Hierarchical Classification Model,” 6th International Conference on CSIT,2016.
[8] Electrocardiography. [Online]. Available:
https://en.wikipedia.org/wiki/Electrocardiography, accessed: 2016.02.27.
[9] A Picture Guide to Heart Disease. [Online]. Available: http://www.medicinenet.com/heart_disease_pictures_slide show_visua l_guide/article.htm, accessed: 2016.02.27
[10] E. A. Ashley and J. Niebauer, “Cardiology Explained. London: Remedica,” ch. 3, 2004.
[11] ECG Filtering. [Online]. Available:
https://courses.cs.washington.edu/courses/cse466/13au/pd fs/lectures/E CG%20filtering.pdf, accessed 2016.03.14
[12] V. Gujiri , A. Joshi and A. Chavan, “ECG Signal Analysis for Abnormality Detection in the Heart beat,” Global Research and Development Journal for Engineering . vol. 1, pp. 66-71, 2016.
[13] L. Sornimo, and P. Laguna,“Bioelectrical signal processing in cardiac and neurological applications,” Academic Press, Cambridge. vol. 8, pp. 669, 2005.
[14] H. El-Saadawy, M. Tantawi, H. A. Shedeed and M. F. Tolba. “Heart Disease Diagnosis using Electrocardiogram Signal Processing,”vol 10, 2017.
[15] Asian Journal of Information in Technology. vol.16, pp. 777-782, 2015.
[16] What Is Arrhythmia?". National Heart, Lung, and Blood Institute. July 1, 2011. Archived from the original on 2 March 2015. Retrieved 7 March 2015
[17] Who Is at Risk for an Arrhythmia?". National Heart,
Lung, and Blood Institute. July 1, 2011. Archived from the original on 3 March 2015. Retrieved 7 March 2015.
[18] M. Zoni-Berisso, F. Lercari, T. Carazza, and S. Domenicucci, "Epidemiology of atrial fibrillation: European perspective," Clinical epidemiology. vol.6, pp. 213–20, 2014.
[19] GBD 2013 Mortality and Causes of Death, Collaborators. "Global, regional, and national age-sex specific all-cause and cause-specific mortality for 240 causes of death, 1990–2013: a systematic analysis for the Global Burden of Disease Study 2013". Lancet. 385 (9963), pp. 117–171, December 2014.
[20] R. Mehra,(2007). "Global public health problem of sudden cardiac death". Journal of electrocardiology. vol. 40, 2007.
[21] Heart Rhythm Society . Heart Diseases and Disorders Retrived 20th Oct. 2018.
[22] Task Force of the European Society of Cardiology and North American Society of Pacing and Electrophysiology. Heart rate variability. Standards of measurement, physiological interpretation and clinical use. Vol. 93, pp. 1043–1065, circulation 1996
[23] What Are the Signs and Symptoms of an Arrhythmia?". National Heart, Lung, and Blood Institute. July 1, 2011. Archived from the original on 19 February 2015. Retrieved 7 March 2015.
[24] L. So¨Rnmo and P. Laguna, “Electrocardiogram (ECG)
Signal Processing,” Wiley Encyclopedia of Biomedical Engineering, vol. 20, pp. 1-15, 2006.
[25] P. T. Rao, S. K. Rao, G. Manikanta and S. R. Kumar, “Distinguishing Normal and Abnormal ECG Signal.” Indian Journal of Science and Technology, vol. 9, pp. 1-5, 2016.
![Fig. 2 Electrical pattern across the hearts activity [3]](https://thumb-us.123doks.com/thumbv2/123dok_us/676313.1074909/2.612.158.428.92.217/fig-electrical-pattern-hearts-activity.webp)
![Fig 3. The Interpretation of the three traces of ECG beats [13]](https://thumb-us.123doks.com/thumbv2/123dok_us/676313.1074909/3.612.58.547.80.236/fig-interpretation-traces-ecg-beats.webp)