DOI: http://dx.doi.org/10.26483/ijarcs.v9i3.5949
Volume 9, No. 3, May-June 2018
International Journal of Advanced Research in Computer Science RESEARCH PAPER
Available Online at www.ijarcs.info
ISSN No. 0976-5697
CLASSIFYING TWITTER USER AS A BOT OR NOT AND COMPARING
DIFFERENT CLASSIFICATION ALGORITHMS.
Mufaddal Haidermota
Mumbai University ,Computer Engineering Dept.
Mumbai, IndiaDrishit Mitra
Mumbai University,Computer Engineering Dept.
Mumbai, IndiaAshwini Pansare
Mumbai University,Computer Engineering Dept.
Mumbai, IndiaAbstract: Social media provides a platform for sharing content and news and provides online marketing landscapes for start-ups and companies in their early phase - social media marketing. But, in today’s scenario, we can see that a growing amount of social media content is generated by bots. These bots have been used for harmful tasks such as spreading false information and news, spams, malicious links, and contents, etc. The popularity and open structure of Twitter has attracted a large number of automated programs, known as bots [1]. In our work, we present a framework or model to detect such entities on Twitter and be able to assist human users in identifying who they are interacting with. The proposed classification model used a publicly available dataset of Twitter users, having both humans and bots account for training and testing purposes. We observe and analyze the different characteristics of human and bot in terms of their tweeting behavior, tweet content, and account properties. We also used the Twitter API to extract some additional information that was necessary for classification.
Keywords: Random Forest, Twitter API, Bot, Classification
I. INTRODUCTION
Social media are powerful tools connecting billions of people across the globe, Twitter being one of them. Twitter is a platform that fosters social connectivity and the broadcasting of popular contents and news, which is now plagued by automated accounts. Bot detection is an important task in social media [2]. One study has estimated that over half of the accounts on Twitter are not human [2]. Bots are not just a danger to the users of social media, but also to those that study it. The manipulation that a bot causes bleeds across into the analysis that is done on this particular platform.
Malicious bots have been greatly exploited to spread wrong and malicious content on social media. These bots follow other users randomly and expect users to follow them back. Once, they get followed, the user’s timeline starts filling up with harmful tweets containing appealing content. The users may get enticed to click on these links and get forwarded to malicious sites that threaten the user’s security. Clearly, there is a need for us to remove malicious bots from social media both for the benefit of the users, organizations, and researchers.
The objective of our work is to identify the features that separate a human from a bot by analyzing the tweeting behavior, tweet content and account properties. This will assist genuine users to recognize with whom they are interacting and engaging within the community.
Then we perform data extraction and cleaning techniques on the dataset and find a set of useful features to classify users into the two classes. Based on the results, we propose a classification system and validate the efficiency of the system
through the test dataset.
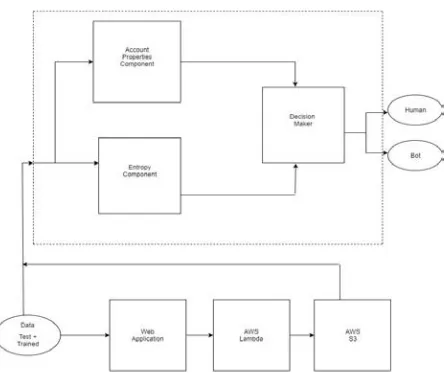
II. DESIGN OF PROPOSED MODEL
Fig. 1. Block Diagram
III. FEATURES
The features identified below are the essential minimum features required in distinguishing between bots and humans. Some features collected by the account properties component including followers to friends’ ratio, reciprocity are helpful in recognizing simple bots, however, there have emerged some sophisticated bots that unfollow their friends if they do not follow back within a certain amount of time [1]. Entropy, URL ratio, tweeting device are the important features [1] that help in distinguish between humans and bots on Twitter. The following features are assessed by collecting 20 latest tweets of a user by using Twitter API.
• Followers to Friend Ratio - We have the individual columns containing the followers and friends count of every user (both humans and bots) in the dataset. We will create a new column having the ratio of and friends count followers in the final dataset.
• Recognizing the Tweeting Device – Identify the user-id and using the Twitter API, recognize the device from which the tweets were tweeted from and classify them as android, web etc.
• URL Ratio – Whether a tweet contains a URL is determined by looking at the “entities” field of the tweet returned by Twitter’s API. This measures the number of times the user has published a tweet containing a URL divided by the number of tweets the user has published :
URL Ratio = (number of tweets containing URL) / (total number of tweets published by a user) (1)
• Reciprocity – For every user randomly choose 20 users from the list of users whom he/she follows. Check whether the follower follows back the user or not. Find the ratio of the number of users who follow back to 20.
• Entropy – If the entropy is low for the inter-tweet
delays, it indicates a predictable or regular behavior, a sign of automation which is done by most of the bots. High entropy indicates irregularity in tweeting pattern, a sign of human nature.[2]
Entropy = (1/ total number of tweets of a user -1) ∑ (ti - ti-1) (i=2 to N) (2)
Where ti is the time stamp of the ith
timeline sorted chronologically in ascending order tweet in user’s
and N is the total number of tweets published by a user [2].
IV. CLASSIFICATION ALGORITHMS (COMPARISON)
Classification is a supervised learning approach where we categorize data into a given number of classes (bots and humans). The main goal of classification problem is to identify the category/class to which a new data will fall under.
• Logistic Regression – Logistic regression measures the relationship between the categorical dependent variable and one or more independent variables by estimating probabilities using a logistic function (sigmoidal function) [4]. It maps a large input domain onto a smaller range of 0 and 1.
• Naïve Bayes – It is a classification technique based on Bayes’ Theorem with an assumption of independence between predictors [4]. In order to perform a classification, the conditional probability (P (H|X)) has to be determined. P (H|X) is the probability that the hypothesis (H) holds given the “evidence” or observed data tuple (X).
• Random Forest – Random Forest is an ensemble of decision trees [4]. To classify a new data object based on features identified, each tree gives a classification output or in other words, we can state that a tree “votes” for an output class [4]. The forest chooses the class that is “voted” the most [4].
• Adaptive Boosting (AdaBoost) – AdaBoost is a boosting algorithm for binary classification. It combines the output of several weak learners to obtain a strong classifier. AdaBoost’s key benefit is that it can create a non-linear decision boundary for the classification problem by combining the decision boundaries of these weak learners from different iterations. [5]
Table 1. Comparison of Classification Algorithms
Parameter Logistic Reg.
Naïve Bayes (Gaussian)
Naïve Bayes (Multinomial)
Random Forest
Accuracy 0.52 0.68 0.7045 0.9545
Precision 0.27 0.77 0.76 0.95
Recall 0.52 0.68 0.70 0.95
F1 Score 0.36 0.66 0.69 0.95
Table 2. Results after Boosting Classification Algorithms
Parameter Logistic Reg. + AdaBoost
Naïve Bayes (Gaussian) +
AdaBoost
Naïve Bayes (Multinomial) + AdaBoost
Random Forest + AdaBoost
Accuracy 0.81 0.50 0.71 0.948
Precision 0.84 0.41 0.72 0.95
Recall 0.81 0.50 0.71 0.95
F1 Score 0.81 0.37 0.71 0.95
From Table (1), we can see that logistic regression underperforms even though it is known for its binary classification and the reason for that its inflexibility to capture complex relationships and also tends to underperform when there are non-linear decision boundaries. The reason for the underperformance of Gaussian Naïve Bayes is that the points are Gaussian-distributed in the input space so that the shapes of the clusters are ellipses. This restriction is too strong for most classification problems. Another concern about Bayes classifier is that it needs a large number of parameters to decide the centroids and the shapes of the Gaussian ellipses. Another reason for poor performance is that it performs well in case of categorical input variables compared to the numerical variable(s). For a numerical variable, a normal distribution is assumed (bell curve, which is a strong assumption). Both, logistic regression and naïve Bayes are susceptible to outliers (see figure 4 and figure 5).
The best classification performance of 0.95 AUC is obtained by the Random Forest model [3].
V. MACHINE LEARNING COMPONENT
We can see that Random Forest is one of the most effective and versatile machine learning algorithms and results in higher classification accuracy.
The machine learning model will be trained using Random Forest algorithms to classify whether the given user is a bot or a human.
In random forest classification algorithm, a random instance of data is chosen from the training dataset. With the selected data, a random set of attributes from the original dataset is chosen. All the input variables are not considered because of enormous
computation and high chances of overfitting. In a dataset, where M is the total number of input attributes in the dataset, only m attributes are chosen at random for each tree where m < M. It is also robust when training with an imbalanced dataset.
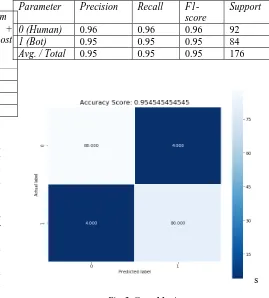
VI. RESULTS
All the results shown below are of Random Forest algorithm - the decision maker used in our classification system.
Table 3. Classification Report
Parameter Precision Recall
F1-score
Support
0 (Human) 0.96 0.96 0.96 92
1 (Bot) 0.95 0.95 0.95 84
Avg. / Total 0.95 0.95 0.95 176
[image:3.595.288.557.211.509.2]s
Fig. 2. Cross Matrix
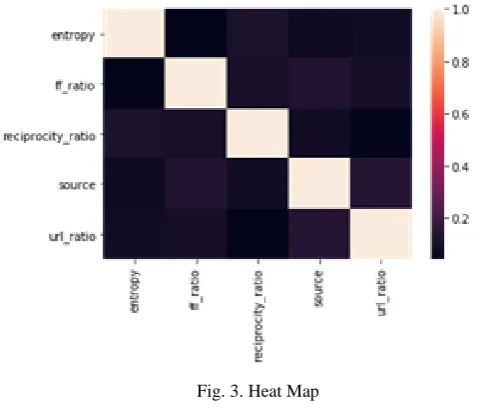
A. Heat Map
Fig. 3. Heat Map
B. Box Plot
A box plot (or box-and-whisker plot) shows the distribution of quantitative data in a way that facilitates comparisons between variables or across levels of a categorical variable. The box shows the quartiles of the dataset while the whiskers extend to show the rest of the distribution, except for points that are determined to be “outliers” using a method that is a function of the inter-quartile range.
[image:4.595.39.280.72.281.2]Fig. 4. Box plot 1
Fig. 5. Box plot 2
C. Pair Plot
Pair plot displays pair wise relationship between the features present in the dataset and along the diagonal it shows univariate relationship with the help of histograms.
Fig. 6. Pair plot
VII. CONCLUSION
In the paper, we have discussed Twitter a social media platform that is not only used to share content but also used for other purposes such as social media marketing, research, etc. But unfortunately, most of the contents generated on Twitter are by bots. To solve this issue in hand, we have used machine learning classification algorithms to identify these bots and separate them from genuine users and be able to get rid of the problem of automation that bots cause in the Twitter community.
[image:4.595.306.525.361.542.2] [image:4.595.40.262.420.585.2]given away by their regular or periodic timing, i.e., low entropy [1]. We also have discovered that certain account properties, like URL ratio, entropy, and tweeting device, are very helpful features in detecting automation [1].
This work also presented an experimental study comparing the use of four machine learning techniques on the same dataset, for classification.
The effectiveness of the classification system is evaluated through the test dataset and by our real-time web application.
VIII. RECOMMENDATIONS
Recognizing whether a user is really a human or bot in today’s world is important, because the most of the content or information shared by bots are malicious or fake, which not only harms the individual but the community as well.
Continue to explore new features emerging with the Twitter development for more effective bot detection in the future. Our model can be used to develop a web application wherein the user can enter the Twitter handler to check whether that account is of a bot or not, and take actions accordingly.
The work done can be extended to other social media platforms that have been plagued by the automated programs –
“bots” and safeguard oneself from false information or malicious content. Also, our work can be utilized to sort/identify human online traffic from bot activity.
IX. REFERENCES
[1] Zi Chu, Steven Gianvecchio, Haining Wang and Sushil Jajodia. “Who is Tweeting on Twitter: Human, Bot, or Cyborg?” Annual Computer Security Applications Conference (ACSAC).
[2] Fred Morstatter, Liang Wu, Tahora H. Nazer, Kathleen M. Carley and Huan Liu. “A New Approach to Bot Detection: Striking the Balance Between Precision and Recall”. IEEE/ACM International Conference on Advances in Social Networks Analysis and Mining (ASONAM).
[3] Onur Varol, Emilio Ferrara, Clayton A.Davis, Filippo Menczer, Alessandro Flammini, “Online Human-Bot Interactions: Detection, Estimation, and Characterization”. arXiv:1703.03107v2 [cs.SI]. Mar 27, 2017.
[4] Sunil Ray. “Essentials of Machine Learning Algorithms (with
Python and R codes).” Internet:
[5] Von Kirby P.German, Bobby D. Gerardo, and Ruji P.Medina. “Implementing Enhanced AdaBoost Algorithm for Sales Classification and Prediction”. International Journal of Trade, Economics and Finance. [On-line].Vol. 8, No. 6. Available: http://www.ijtef.org/vol8/577-C0163.pdf [December 2017].