University of Windsor University of Windsor
Scholarship at UWindsor
Scholarship at UWindsor
Electronic Theses and Dissertations Theses, Dissertations, and Major Papers
9-20-2018
A SELF
‐
ADAPTIVE ENERGY DISSIPATION STRUCTURE FOR LOW
A SELF ADAPTIVE ENERGY DISSIPATION STRUCTURE FOR LOW
SPEED IMPACT AND PEDESTRIAN PROTECTION
SPEED IMPACT AND PEDESTRIAN PROTECTION
James Wu
University of Windsor
Follow this and additional works at: https://scholar.uwindsor.ca/etd
Recommended Citation Recommended Citation
Wu, James, "A SELF‐ADAPTIVE ENERGY DISSIPATION STRUCTURE FOR LOW SPEED IMPACT AND
PEDESTRIAN PROTECTION" (2018). Electronic Theses and Dissertations. 7586.
https://scholar.uwindsor.ca/etd/7586
This online database contains the full-text of PhD dissertations and Masters’ theses of University of Windsor students from 1954 forward. These documents are made available for personal study and research purposes only, in accordance with the Canadian Copyright Act and the Creative Commons license—CC BY-NC-ND (Attribution, Non-Commercial, No Derivative Works). Under this license, works must always be attributed to the copyright holder (original author), cannot be used for any commercial purposes, and may not be altered. Any other use would require the permission of the copyright holder. Students may inquire about withdrawing their dissertation and/or thesis from this database. For additional inquiries, please contact the repository administrator via email
A SELF
‐
ADAPTIVE ENERGY DISSIPATION STRUCTURE FOR LOW
SPEED IMPACT AND PEDESTRIAN PROTECTION
By
James Wu
A Thesis
Submitted to the Faculty of Graduate Studies
through the Department of Mechanical, Automotive and Materials Engineering in Partial Fulfillment of the Requirements for
the Degree of Master of Applied Science at the University of Windsor
Windsor, Ontario, Canada 2018
A Self
‐
Adaptive Energy Dissipation Structure for Low Speed Impact and
Pedestrian Protection
by
James Wu
APPROVED BY:
______________________________________________
D.E. Green
Department of Mechanical, Automotive and Material Engineering
______________________________________________
N.G. Zamani
Department of Mechanical, Automotive and Material Engineering
______________________________________________
W. Altenhof, Advisor
Department of Mechanical, Automotive and Material Engineering
DECLARATION OF CO-AUTHORSHIP / REVIOUS PUBLICATION
I. Co-Authorship
I hereby declare that this thesis incorporates material that is result of joint research, as follows: The thesis was developed by the author under the supervision of professor Dr. Altenhof, from university of Windsor, with input from Dr. Bhattacharjee and Dr. Sundararajan, from Ford Motor Company. In all cases, the key ideas, primary contributions, experimental designs, data analysis, interpretation, and writing were performed by the author. The contribution of Dr. Altenhof was primarily through the provision of supervision, and the knowledge of crashworthiness and finite element analysis. The contribution of Dr. Bhattacharjee and Dr. Sundararajan was primarily through the provision of information and suggestions regarding industrial standard and manufacturability. Mr. John Magliaro contributed to the editing of the manuscript.
I am aware of the University of Windsor Senate Policy on Authorship and I certify that I have properly acknowledged the contribution of other researchers to my thesis, and have obtained written permission from each of the co-author(s) to include the above material(s) in my thesis.
I certify that, with the above qualification, this thesis, and the research to which it refers, is the product of my own work.
II. Previous Publication
Thesis Chapter Publication title/full citation Publication status
5-9
Wu J, Altenhof W, Bhattacharjee S, Sundararajan S and Magliaro J. A self-adaptive energy absorber for improved pedestrian safety and low speed damage requirements. International Journal of Crashworthiness. Accepted on September 7, 2018.
This is an Accepted Manuscript of an article will be published by Taylor & Francis in Journal of International Journal of Crashworthiness, available online:
https://doi.org/10.1080/13588265.2018.1524546
Accepted
I certify that I have obtained a written permission from the copyright owner(s) to include the above published material(s) in my thesis. I certify that the above material describes work completed during my registration as graduate student at the University of Windsor.
III. General
I declare that, to the best of my knowledge, my thesis does not infringe upon anyone's copyright nor violate any proprietary rights and that any ideas, techniques, quotations, or any other material from the work of other people included in my thesis, published or otherwise, are fully acknowledged in accordance with the standard referencing practices. Furthermore, to the extent that I have included copyrighted material that surpasses the bounds of fair dealing within the meaning of the Canada Copyright Act, I certify that I have obtained a written permission from the copyright owner(s) to include such material(s) in my thesis and have included copies of such copyright clearance to my appendix.
ABSTRACT
Bumper design regulations for low-speed vehicular impacts (Part 581, Bumper
Standard, formerly FMVSS 215) and high-speed pedestrian impacts (ECE 127/GTR 9)
possess a contradictory set of requirements. Essentially, an ideal bumper structure should
be stiff under low-velocity vehicular impacts while exhibiting a softer response when
impacting pedestrians at elevated velocities to satisfy both regulations. A series of energy
absorbing structures capable of passively adapting their mechanical responses based on the
loading conditions were investigated using finite element modelling tools which were
validated to a series of experimental testing observations. The preferred structure consisted
of a rectangular array of trapezoidal cells which buckle under single-cell impacts while
resisting lateral deformation and artificially increasing the overall stiffness under large-area
impacts. A geometric study of this dissipater demonstrated the potential to increase total
energy absorption by 37.3% by adding thin-walled crossbars at the bases of adjacent cells.
Additionally, a parametric study identified a combination between upper cell angle and the
ratio between the wall thicknesses as the most critical parameter to consider when tailoring
ACKNOWLEDGEMENTS
I would first like to thank my wife, Yutong Lu, and my parents, Weixing Wu and
Yaohong Zhang, for their love and support through the period of my study.
I would like to express my deep gratitude and sincere thankfulness to Dr. William
Altenhof, my academic advisor, for his support, encouragement and guidance with his vast
of knowledge and experience in crashworthiness and finite element modeling. I would also
like to thank my committee members, Dr. Green and Dr. Zamani, and industrial expert
from Ford Motor Company, Dr. Bhattacharjee and Dr. Sundararajan, for their help and
support. I am indebted to Mr. Kevin Harkai and Mr. Matt St. Louis for their technical
assistance. I am also grateful to Matthew Bondy, Yang Song and John Magliaro for their
help and friendship.
Last but not least, the financial support from Ford Motor Company and the Natural
Sciences and Engineering Research Council of Canada (NSERC) are gratefully
TABLE OF CONTENTS
DECLARATION OF CO-AUTHORSHIP / REVIOUS PUBLICATION ... iii
ABSTRACT ... v
ACKNOWLEDGEMENTS ... vi
LIST OF TABLES ... x
LIST OF FIGURES ... xi
LIST OF ABBREVIATIONS ... xiv
NOMENCLATURE ... xv
1. INTRODUCTION ... 1
2. LITERATURE REVIEW ... 4
2.1. Axial loading of thin walled structure ... 4
2.2. Lateral loading of thin walled structure ... 10
2.3. Self-adaptive eggbox shape structure ... 12
2.4. Summary of literature review ... 13
3. RESEARCH OBJECTIVES ... 15
4. PRESCRIBED DESIGN REQUIREMENTS ... 17
5. PILOT STUDY ... 20
5.1. Finite element model of pilot study ... 22
5.1.1. Element discretization ... 22
5.1.2. Material properties ... 23
5.1.3. Contact algorithms ... 23
5.1.4. Boundary conditions and simulation environment ... 24
5.2.1. Preliminary design 1: Hemispherical structure ... 27
5.2.2. Preliminary design 2: Lateral ring structure ... 29
5.2.3. Preliminary design 3: Round top cellular structure ... 30
5.3. Pilot study results ... 31
5.3.1. Hemispherical structure ... 32
5.3.2. Lateral ring structure ... 33
5.3.3. Round top cellular structure ... 34
5.3.4. Comparison of pilot study results ... 36
6. MODEL VERIFICATION AND VALIDATION ... 40
6.1. Revised design selected for further study ... 40
6.2. Verification and validation approach ... 41
6.2.1. Test of material property ... 43
6.2.2. Validation test setup ... 48
6.3. Finite element model... 49
6.3.1. Element discretization ... 50
6.3.2. Material properties ... 50
6.3.3. Contact algorithms ... 52
6.3.4. Boundary conditions and simulation environment ... 52
6.4. Results and discussion ... 54
6.4.1. Model verification ... 54
6.4.2. Model validation ... 55
7. PARAMETRIC STUDY ... 62
7.1. Concept and methodology ... 62
7.2. Finite element model... 63
7.4. Influence of altering dimension “B” ... 69
7.5. Influence of altering dimension “E” ... 71
7.6. Influence of altering dimension “F” ... 72
7.7. Summary of parametric study ... 74
8. GEOMETRIC MODIFICATIONS ... 78
8.1. Concept and methodology ... 78
8.2. Influence of groove design... 78
8.3. Influence of added structure between upper trapezoidal section ... 80
8.4. Influence of extended upper surface ... 82
8.5. Influence of support structure for lower section ... 83
8.6. Other geometric modifications investigated ... 85
8.7. Summary of designs with modified geometry ... 86
9. CONCLUSIONS... 91
10. RECOMMENDATIONS FOR FUTURE WORK ... 93
REFERENCES ... 95
APPENDIX A: LOAD/DISPLACEMENT RESPONSES FROM PARAMETRIC AND GEOMETRIC STUDIES ... 100
APPENDIX B: DETAILED NUMERICAL COMPARISON OF PARAMETRIC AND GEOMETRIC STUDY ... 107
LIST OF TABLES
Table 1. Key parameters from the load/displacement responses of preliminary designs. 38
Table 2. Key parameters for evaluating result of test result. ... 75
Table 3. Key parameters for evaluating result of test result. ... 87
Table B4. Parametric test detailed result. ... 107
LIST OF FIGURES
Figure 1. (a) Axisymmetric collapse, (b) non-symmetric collapse, and (c) mixed
mode. [6] ... 5
Figure 2. Cross section of multi-cell columns with different layers. [7] ... 6
Figure 3. Types of tube inversion. [9]... 7
Figure 4. Typical tube cutting process without deflector. [11] ... 9
Figure 5. Deformation mode of frustum: (a) with no constraint, (b) with the larger end constrained. [12,13] ... 10
Figure 6. Braided tube with aluminum foam core under concentrated loading. [25] ... 12
Figure 7. Plain and section view of eggbox structure. ... 13
Figure 8. Demonstration of impactor and design volume. ... 19
Figure 9. Demonstration of two-stage self-adaptable system. ... 21
Figure 10. Legform test of structure with discontinuous contact surface. ... 25
Figure 11. Result of legform test of Figure 10 with different impact location. ... 26
Figure 12. The hemispherical design in (a) front view, (b) isometric view... 28
Figure 13. The lateral ring design in (a) front view, (b) isometric view... 30
Figure 14. The round top cellular design in (a) front view, (b) isometric view. ... 31
Figure 15. Load response versus displacement for hemispherical structure design. ... 32
Figure 16. Impact deformation of hemispherical structure for (a) Pendulum test at 20 mm and (b) Legform test at 50 mm. ... 33
Figure 17. Load response versus displacement of lateral ring structure design. ... 34
Figure 18. Impact deformation of lateral ring structure for (a) Pendulum test at 26 mm and (b) Legform test at 35 mm. ... 34
Figure 20. Impact deformation of round top cellular structure for (a) Pendulum test at 17 mm, (b) Legform test scenario 1 at 42 mm and (c) Legform test scenario 2 at 42 mm.
... 36
Figure 21. Preferred structure showing the expected load path in structure with (a) large area loading and (b) single cell loading. ... 41
Figure 22. Specimen with tracker dots. ... 42
Figure 23. Dimensions of tensile specimen. ... 44
Figure 24. Engineering stress versus strain for physical extensometer result. ... 46
Figure 25. Engineering stress versus strain for optical extensometer result. ... 46
Figure 26. Dimension of testing specimen. ... 48
Figure 27. Test setup of (a) flat platter compression, (b) roller compression. ... 49
Figure 28. FEM of (a) flat platter apparatus and (b) roller apparatus. ... 49
Figure 29. Effective stress versus Effective plastic strain of mild steel. ... 51
Figure 30. Energy terms with respect to displacement for validation FEM. ... 54
Figure 31. Deformed shape after flat platter compression. ... 57
Figure 32. Deformed shape after roller compression... 57
Figure 33. Path of tracked dots/nodes in flat platter compression. ... 57
Figure 34. Path of tracked dots/nodes in roller compression. ... 58
Figure 35. Load to displacement response of flat platform compression test. ... 60
Figure 36. Load to displacement response of roller compression test. ... 61
Figure 37. Deformed specimen at 17 mm of flat platter compression. ... 61
Figure 38. Deformed specimen at 14 mm of roller compression. ... 61
Figure 39. (a) Critical dimensions and (b) load configuration of the unit cell. ... 63
Figure 40. Finite element model of revised structure: (a) section of structure with symmetrical cut-off and (b) layers of structure differed with color. ... 64
Figure 42. Load versus displacement of the energy dissipating structure with default
dimensions. ... 68
Figure 43. Legform test deformation: (a) observed during the first stage of deformation at 5 mm, (b) observed during the second stage at 15 mm, and (c) observed during the third stage at 45 mm. ... 68
Figure 44. Pendulum test deformation: (a) observed during the first stage of deformation at 3 mm, (b) observed during the second stage at 16 mm and (c) observed during the third stage at 45 mm. ... 68
Figure 45. Pendulum test at 25 mm impactor displacement for “B=50mm”. ... 71
Figure 46. Pendulum test at 6 mm displacement with (a) E=6.4 mm and (b) E=22 mm. 72 Figure 47. Legform test load/displacement response for tests in Table 2. ... 75
Figure 48. Pendulum test load/displacement response for tests in Table 2. ... 75
Figure 49. Structure Modification of: (a) Groove location, (b) Added structure in upper section, (c) Extended initial contact surface and (d) Added support in lower section. ... 78
Figure 50. Structure at 25 mm of impactor displacement (a) with groove and (b) without groove. ... 80
Figure 51. Dimension callout for added material in the upper section. ... 81
Figure 52. Pendulum test deformation mode (a) without extended top, and (b) with extended top. ... 83
Figure 53. Reinforced structure at (a) upper and (b) middle corner. ... 85
Figure 54. Legform test load/displacement response for tests in Table 3. ... 88
LIST OF ABBREVIATIONS
ASTM American Society for Testing and Materials CAE Computer aid engineering
ECE Economic Commission for Europe EDM Electric Discharge Machine FE Finite Element
FEA Finite Element Analysis FEM Finite Element Model
FMVSS Federal Motor Vehicle Safety Standard GTR Global Technical Regulation
NHTSA National Highway Traffic Safety Administration
PP Polypropylene
NOMENCLATURE
E Young’s modulus
L Total number of discrete data
P Load
Pm Average load
S Displacement
V Validation metric
being Engineering stress
σTrue True stress
εEng Engineering strain
εTrue True strain
1.INTRODUCTION
Safety is a major concern for engineers when designing vehicles. Significant
research efforts within the field of crashworthiness have historically been allocated towards
studies involving occupant safety. However, in recent years, more attention has been raised
in the protection of pedestrians, who could be more vulnerable in road accidents. Based
on a report from NHTSA, over 5000 pedestrians were killed and over 70,000 pedestrians
reported injuries in road accidents in the USA during the year of 2015 [1]. Among these
cases, 85% were frontal impacts where the front bumper was the first entity to contact the
pedestrian. Vehicular accidents are also the leading cause of death worldwide for ages 15
to 29 based on latest data from the World Health Organization [2].
In general, bumper design involves two sets of regulations: a pedestrian safety
driven standard and vehicle protection driven standard. Pedestrian protection is tested by
the requirements defined in UN regulation ECE 127/GTR 9 [3]. This regulation
emphasizes a limit on the impact force and effect of impact location when the bumper
collides with a legform impactor. In the Part 581 Bumper Standard, which was formally
referred to as FMVSS 215 [4], the bumper is required to maintain a high stiffness when
struck by an impacting pendulum at low velocities (~4 km/h). The engineering challenge
proposed in this study is to design a bumper which can adjust and quasi-optimize its
mechanical response over a broad range of loading conditions based upon the above
described criteria.
In the ECE 127/GTR 9 testing requirement, two tests related to front bumper and
front hood impacts have been developed. This study considered the front bumper tests since
energy absorber that can easily be adapted for multiple applications. Bumper testing for
this standard involves an impact between a bumper and legform impactor. The standard
requires the legform to impact the front bumper at a velocity of 40 km/h. The results of
each test are evaluated depending upon the bumper height of the tested vehicle. When the
lower bumper height is above 500 mm where the upper legform impactor was used, the
maximum impact force must be limited to 7.5 kN and the maximum bending moment
cannot exceed 510 N·m throughout the impact duration. When the lower bumper height is
below 425 mm and a flexible lower legform impactor is utilized, injury is evaluated both
for the knee and tibia sections. The knee injury is evaluated with the elongation of three
specific dimensions in the knee joint center which represents the medial collateral
ligament (MCL), anterior cruciate ligament (ACL) and posterior cruciate ligament (PCL).
The tibia injury is evaluated based on the maximum bending moment within the tibia
section of the impactor. The maximum dynamic elongation of the represented dimensions
of the MCL, ACL and PCL are limited to 22 mm, 13 mm and 13 mm, respectively. The
maximum tibia bending moment is set to 340 N·m. In this legform impact scenario, a
deformable bumper structure is desired to minimize the impact force.
In the Part 581 Bumper Standard [4], the test apparatus is composed of a front and
rear bumper impacted by a pendulum. The impacting mass, calculated by adding the mass
of the pendulum block and 1/3 of the mass of the supporting arm, is assumed as equivalent
to the vehicle tested. The impact velocity is prescribed as 3.7 km/h (equivalent to 2.3 mph)
for longitudinal impacts and 2.1 km/h (equivalent to 1.3 mph) for corner impacts as per US
dissipation potential is ideal. The post-test examination of the vehicle includes the
alignment of the lights, the suspension, the functionality of the door, hood, cooling system
and other critical components. In the low speed pendulum test, the bumper is required to
be stiff and absorb large quantities of energy to prevent severe damage of other, more
expensive and vital components.
This study was driven by the increased attention directed towards pedestrian
protection in road accidents. The interest of the author is to develop a structure for the
vehicular bumper that could reduce damage to the pedestrian while still being able to
2.LITERATURE REVIEW
A bumper protects other components of the vehicle including the engine and
passengers by dissipating kinetic energy. When excessively high impact energy must be
absorbed, most of the energy will be absorbed through permanent deformation of the
dissipating structure. Considerable research has been conducted on energy absorption to
study the deformation behavior of various structures under load with the intent to maximize
spatial energy absorption and achieving a controllable load/displacement response.
Considering the objectives of this study, a literature review was conducted on
various energy absorbing structures. The primary interests of previous studies were the
deformation behavior of structures and their corresponding energy absorbing behavior. The
geometries studied were mostly thin-walled structures with large design volumes for
maximum deformation and energy dissipation. Energy absorbing structures are usually
evaluated with the consistency of the load/displacement response and energy absorption.
2.1.Axial loading of thin walled structure
Plastic deformation by loading thin-walled tubular structures in the axial direction
usually involves changes in shape or size of the cross-sectional area of the tube which
repeats in the axial direction of the tube throughout the collapsing process, as in progressive
folding, tube inversion, tube splitting, or axial cutting. Progressive folding has been studied
extensively by many researchers as in Yuen and Nurick’s overview [5]. Under progressive
folding, a small section of a given thin-walled extrusion folds as the structure is loaded and
minimum that coincide with the folding process. The deformation was controlled by
adjusting the geometry of the tube. Guillow studied axial loading of circular 6060 T5
aluminum tubes and summarized the observed deformation modes occurring from different
tube dimensions [6]. Guillow tested 70 tubes with various dimensions and classified the
deformation into axisymmetric collapse (Figure 1a), non-symmetric collapse (Figure 1b),
mixed mode (Figure 1c) and Euler’s buckling mode. The occurrence of these deformation
modes was mapped with factors of diameter to thickness ratio and diameter to length ratio.
Euler’s buckling can also be predicted by factoring in consideration for Euler’s critical
buckling load. The maximum load required to initiate progressive folding should never
exceed Euler’s critical load.
Figure 1. (a) Axisymmetric collapse, (b) non-symmetric collapse, and (c) mixed mode. [6]
Furthermore, the frequency and amplitude of the load/displacement response can
be controlled by altering the cross-sectional geometry of the tube. Tang [7] studied
multi-cell columns under axial loading, where the cross section of the column was divided
into cells as shown in Figure 2. Throughout this study, it was determined that increasing
the number of layers inside the column increased the specific energy absorption, or energy
absorption per unit mass. Furthermore, cylindrical, multi-cellular columns displayed a
Figure 2. Cross section of multi-cell columns with different layers. [7]
When axial loading thin walled tubes, machining pre-designed stress concentrators
into the structure such as grooves, notches or a drilled hole are commonly used to control
the deformation during the collapsing process. As in Hosseinipour‘s research [8], grooves
were pre-cut on the circumference of the cylindrical tube. During the collapsing process,
the grooved location transitioned into the plastic folding hinge and influenced the
frequency of the load/displacement response.
Tube inversion is another deformation mode which allows for energy absorption
under axially compressive loading. This deformation mode primarily absorbs energy by
altering the radius of the cylindrical tube. Since the deformation process is continuous, it
displays a consistent load/displacement response. There are generally three variations of
tube inversion as shown in Figure 3. Type A and B in Figure 3 displays the first design of
tube inversion, in which one end of the extrusion must be manufactured with a different
diameter compared to the majority of the tube. The smaller/larger end will be fixed during
the deformation and the inverting process will be initiated at the fixed end. The second type
is shown as type C in Figure 3, where the tube possesses two sections with different
diameters connected with a transition section. When the tube is under axial loading,
Figure 3, is the design with the lowest manufacturing cost and easiest to use. The tubes
used in this scenario are straight tubes without special features.
Figure 3. Types of tube inversion. [9]
An inverting die, or deflector, with suitable radius will cause the tube to increase or
decrease in diameter and initiate the inversion process. The first and second design of tube
inversion are commonly called free inversion of tubes; load characteristics of the
compression process mostly depend upon the tube geometry and material property. In the
and the contact condition are also important to the energy dissipation behavior. Al-Hassani
has conducted research on tube inversion with the use of a deflector [9]. In this study, the
author has performed experiments on tubes composed of several materials while also
utilizing deflectors with various dimensions. Comparing tubes with various materials
revealed that for extrusions which possessed a high stiffness, asymmetric buckling could
form during the inversion process. The author has also found the optimal deflector angle
and radius that could maximize the energy absorption of the deformation process. When
the deflector was designed with a large radius or a tapered surface, the extrusion material
under axial loading would reach the strain limit and the wall will split into evenly spaced
circumferential strips and transition the deformation mode into tube splitting. In Huang’s
study [10] of tube splitting, the energy has been found to be dissipated by splitting the tube,
curling the strips, and the friction between the tube and deflector. The energy dissipation
of axial splitting could be further increased by adding a plate to the system to prevent
excessive curling.
Axial tube cutting, studied by Jin [11], considered energy dissipation by cutting the
sacrificial tube with blades along the axial direction. A highly repeatable and consistent
load/displacement response was achieved in the author’s research. The load/displacement
response of the cutting process is strongly correlated to the extrusion dimensions and the
number of cutting blades. The load/displacement response of axial tube cutting could
intentionally be varied throughout the cutting process by machining the tube to have
different thicknesses along the axial direction; this technique cannot be implemented for
Figure 4. Typical tube cutting process without deflector. [11]
Unique cases of axial loading were studied by loading structures with circular
cross-sections which varied in the loading direction such as the frustum investigated by
Alghamdi [12, 13] or spherical shells studied by Gupta [14]. In the study of the frustum,
the deformation of the structure experienced a combination of bending and change in
surface area which promoted increased energy absorption. The load/displacement response
was consistent before the displacement reached 50% of the height of the frustum. Further
study also showed the specific energy absorption increased when the larger end of the
frustum was constrained during the process. When the larger end of the frustum was
constrained, more plastic hinges formed during the deformation (Figure 5b) which
increased the total energy absorption; fluctuation in the load/displacement response was
significant. In the study considering spherical shells, the load/displacement response
presented a smoothly increasing load for shells with a constant wall thickness. With the
proper design of variable shell thickness along the axial direction, a near-constant
Figure 5. Deformation mode of frustum: (a) with no constraint, (b) with the larger end constrained. [12,13]
2.2.Lateral loading of thin walled structure
The mechanical response of thin-walled structures loaded in the lateral direction
has been studied extensively [15-20]. In this configuration, tubes with multiple
cross-sectional geometries were tested, experiencing a load in the lateral direction and
absorbing kinetic energy as the structure deformed. Studies for square or rectangular
shaped tubes demonstrated excellent resistance to deformation during the initial contact,
followed by a loss of rigidity as the structure experienced continued deformation. The
load/displacement response in the process of deforming a square tube demonstrated a high
peak load initially, followed by a rapid decrease and more consistent, lower load in the
later stages of deformation. When a circular tube is crushed resulting in deformation in the
lateral direction, the deformation of the structure is continuous during the process and the
load/displacement response is more consistent. Since the deformation modes observed for
studies on reinforced tubes with additional internal cross-sectional geometry or foams to
increase the controllability and energy absorption capability. In Niknejad’s study [22],
modified circular tubes with grooves added along the axial direction were tested and
compared with various internal reinforcement conditions. The reinforcement conditions
included filling the internal volume with foam, inserting a smaller, empty cylindrical tube
and inserting a smaller foam filled tube. It was found that the specific energy absorption of
the tube with the first two reinforcements was decreased, while the last reinforcement
condition increased the specific energy absorption. Constraining the space for deformation
of circular tubes was also studied by Baroutaji [23] to observe the change in
load/displacement response and energy absorption. The study demonstrated that when the
deformation of the tube was constrained, the structure will deform in a more complex mode
and increase the energy absorption. Lu [24] further elaborated on the behavor of tubes with
external constraints loaded with various types of impactors.
To maximize the energy dissipation of tubes loaded laterally, Smith [25] developed
and tested composite structures comprised of braided stainless-steel tubes and aluminum
foam cores. The braided tubes subjected to transverse loads increased in length and
simultaneously decreased in diameter; as the diameter of the tube decreased, the foam cores
were progressively crushed, as shown in Figure 6. This deformation mode allowed for
concentrated loads to be dissipated more effectively over the volume of the entire structure,
thus increasing the total energy absorption.
Figure 6. Braided tube with aluminum foam core under concentrated loading. [25]
2.3.Self-adaptive eggbox shape structure
Among the multitude of energy absorbing structures studied previously, the
“eggbox” geometry researched by Deshpande [26], Zupan [27], Nowpada [28],
Sashikumar [29] and Yoo [30] was relevant to this study and shared the common goal of
passive self-adaptability. The structure was composed of a conical geometry formed with
sheet metal above and below the median plane, alternatively, as in Figure 7. The
deformation mode of the conical structure was similar to the frustum when loaded axially.
However, the load/displacement response was more consistent compared to the loading of
the frustum due to the rounded corners. When the structure was loaded, the response was
relatively consistent up to 50% of the structural thickness; the amplitude of the force was
strongly correlated to the loading area. As shown in the study of the “eggbox”
provides the opportunity for a passively adaptable load/displacement response by adjusting
the loading area of the structure.
Figure 7. Plain and section view of eggbox structure.
2.4.Summary of literature review
Previous investigations of general energy absorbing structures have provided
information regarding the relationship between deformation modes and the
load/displacement responses. Under the axial loading of tubes, many different deformation
modes were studied. The tube splitting mode had the highest specific energy absorption
compared to other axially loaded dissipaters. Axial cutting yields the most consistent
load/displacement response and has very good controllability. Tube inversion also exhibits
a favorable load/displacement response but could only utilize a maximum of 50% of the
total length for energy absorption. The various laterally loaded structures provided good
energy absorption with minimal displacement. While the square tubes demonstrated
excellent plastic deformation resistance, circular tubes benefit from a more consistent
The studies of the eggbox structure, lateral loading of rings with various constraints
and axial loading of frustums demonstrated the capabilities of passively adaptable energy
absorbers. The corresponding deformation modes could be altered under different loading
3.RESEARCH OBJECTIVES
As stated in Section 1, two testing standards exist to provide a guideline for ideal
bumper performance. However, the stipulations from each set of regulations posted by the
ECE 127 and Part 581 of US standard are conflicting in terms of the desired structural
properties. The purpose of this investigation is to develop a structure to passively adapt its
mechanical response for high velocity pedestrian impacts and low velocity, large contact
area impact scenarios. This allows for the achievement of performance requirements for
different impact/crash conditions, thus quasi-optimizing the performance of the bumper for
various potential loading conditions. In this study, numerical analyses will be performed
to meet these goals. Finite element models will be constructed to represent the two distinct
impact conditions posted in the testing standards. The simulated tests will consider
quasi-static deformation of the designed structure, and the outcome will be discussed with
emphasis on the aspects significant to the performance of the designed structure. The study
will be conducted in 4 major sections as follows:
1. A pilot study will be conducted as the first step of the research. During the pilot
study, brainstorming and testing of possible designs will be the primary focus. The
knowledge obtained from the literature review will be utilized as the foundation of
this study. A most preferred design will be determined to be used as the base
structure for further study and referred to as the designed structure in this thesis.
2. Model verification and validation will be performed for the FEM of the designed
structure that will be used in further investigations. A physical specimen, with
similar geometry to the designed structure, will be manufactured and tested in a lab
results. After the model is verified and validated as acceptable representation of the
physical test, similar modeling technique will be used in further study.
3. A further parametric study will be performed with the designed structure to
understand the significance of the critical dimensions and features. The designed
structure will then be adjusted based upon the knowledge obtained.
4. The final section will be a geometric study utilizing the adjusted structure from
parametric study. In this section, material will be added/removed from the structure
at critical locations to reinforce the structure and/or to modify the deformation
sequence within the system.
Throughout this study, CAE software will be utilized to construct the FEM and
perform numerical analysis of the impacting event. Software and tools used for the
4.PRESCRIBED DESIGN REQUIREMENTS
The research within this thesis was an industrial driven project, therefore, a set of
requirements was prescribed at the initial stage of the research. In this study, the impact
was simulated utilizing LS-DYNA. The designed structure was impacted under two
distinct impact conditions, which will be referred to as the legform test and pendulum test
in the latter sections. Since the FEM was a simplified representation of the testing standards,
the requirements of the results were also narrowed to limit the load response for legform
tests and the energy absorption for pendulum tests. Specific dimensions of the model and
requirements of the test were as follows:
1. The prescribed design volume implemented in the analyses were 500 mm long,
100 mm wide at the impact surface and 80 mm deep in the loading direction. This
geometry was considered to approximate a potential bumper-type energy
dissipating structure and/or other geometries which would allow for the
examination of structural performance under both localized and full area contact
loading.
2. The impactor of the pendulum test was represented as a flat plate with dimensions
of 600 mm long and 112 mm wide, which was large enough to fully contact the
surface of the energy absorber. The impactor for the legform test was a solid
cylinder with a radius of 125 mm and length of 112 mm.
3. The impacting direction for both tests was perpendicular to the 500 mm by
100 mm impact surface of the design volume, which is in the negative z-direction
in Figure 8. For the pendulum test, the impactor makes full contact with the
to the impacting direction. In the legform test, the impactor will contact the center
portion in the contact surface of the energy dissipater, the center axis of the
impactor was positioned perpendicular to both the impacting direction and the
longer side of the design volume. In Figure 8, the green, blue, and red parts
represent the legform impact, pendulum impactor, and design volume respectively.
Note that for each individual test, only one impactor will be present and impact
with the dissipater.
4. The legform test represents the scenario where the pedestrian impacts with the
bumper at high velocity. The prescribed motion throughout the test was 10 m/s.
Since the goal was to minimize damage to the pedestrian, the maximum load during
the deformation process was stipulated to not exceed 6 kN. The energy absorption
was also a variable that was considered, but the primary focus was to reduce the
load response. The pendulum test was modeled following the low speed test
scenario, and the impactor was set to travel at 1 m/s. Since the results of the test
could not be assessed with a similar approach to the Part 581 test requirement,
energy absorption was used to evaluate the result. The basic requirement was to
absorb 1 kJ of energy through the deformation process, which is equivalent to the
kinetic energy of a small car traveling at 4 km/h. The travel distance of the
impactors in both tests were 60 mm, which was 75% of the total depth within the
design volume. No requirement was postulated for the mass of the system, however,
since the specific energy absorption is an important aspect in evaluating energy
5. Although the estimated cost was not a part of the requirements for the project,
the manufacturability was considered through the design process. The material was
also not restricted; however, a polymeric material model was kindly provided by
the industrial partner to be utilized in the study.
5.PILOT STUDY
The objective was to design a self-adaptable system; therefore, it was important to
decide what conditions the system must be adapted to. By comparing the difference
between the impact scenarios, the major differences between these tests were the impact
velocities and contact surface conditions. A structure capable of passively adapting to
multiple impact velocities was anticipated to require complex working mechanisms, and
such a system may not behave as intended under dynamic loading conditions. Therefore,
the scope of this investigation was limited to the consideration of adjusting the deformation
mode by controlling the contact area.
The authors wish to emphasize the adaptive characteristics of the system to the
force/displacement behavior when the system is subjected to either (i) a local region of
deformation or (ii) the condition of complete, full contact between the energy dissipation
system and the impactor. In the case of a bumper system, the former could potentially
represent a legform impact condition, while the latter could represent a full-frontal impact
condition.
Many designs of the self-adaptive energy absorbing system were considered during
the brainstorming stage. The designs consisted of two major categories. The first category
was a two-stage system where the first stage acted as a mechanical switch and affects the
deformation mode of the second stage. A simple illustration of such a system is shown in
Figure 9. The gray blocks represent the switch element and the blue blocks represent the
energy absorbing element, each switch element would control the deformation of a distant
increase the stiffness of energy absorbing element B. However, since block B will not be
in contact with the impactor, the impacting event will have a reduced load response. Under
a large area impact event, all switch elements would be triggered, therefore the overall
stiffness of the system would be increased. The second category of designs was
characterized by no moving parts and has the structure divided in multiple repeated cells.
The structure could be stiffened by having the deformation of two adjacent cells interacting
with each other and forcing the deformation mode to change.
Figure 9. Demonstration of two-stage self-adaptable system.
The first category has the advantage of being able to modify the deformation mode
on a large scale since moving parts are available. However, if multiple objects where
impacted simultaneously, for example, two legs of a pedestrian, one object may trigger the
switch and the other object could be impacted by the stiffened structure. Therefore, the
designs of the first category were not ideal for complex scenarios although it may be
acceptable in terms of satisfying the test requirement. Also, the space occupied by the
switch element will have low contribution to the energy absorption, which my lower the
overall energy absorption. Compared to the designs of the first category, designs within
the second category could be more reliable since there is no reliance on moving parts. With
simpler designs, the manufacturing costs would almost certainly also be reduced. Therefore,
A series of analyses were completed on proposed designs originating from
established and previously discussed energy absorbing systems. These analyses
emphasized the compressive loading characteristics of the energy dissipation system with
the application of two loading conditions; a localized contact region and a full contact
condition.
5.1.Finite element model of pilot study
The pilot study designs were developed with CATIA V5, discretized in a
capitalized mesh with HyperMesh, then transferred to LS-PrePost to generate the keyword
for simulation within LS-DYNA. Details of the finite element model which was used for
the pilot study designs are listed below. Minor changes of modeling parameters throughout
the research will be stated in later sections as necessary.
5.1.1. Element discretization
The pendulum impactor of the test was modeled as flat plates with shell elements,
and the legform impactor was modeled with solid elements. Both impactors were modeled
as rigid bodies since negligible deformation in these components was expected. The
pendulum impactor utilized elements with an average size of 8mm by 8 mm. The legform
impactor was modelled with 44 elements along the radius to form a relatively smooth outer
surface. The energy absorbing structures were modeled with all hexahedron solid elements
with 3 elements through the wall thickness; the elements had edge length between 0.5 mm
to 2 mm. The largest element aspect ratio was 3 for the hemispherical design and 2 for the
Belytschko-Bindeman hourglass viscosity and hourglass coefficient of 0.15 to reduce
hourglassing.
5.1.2. Material properties
A piecewise linear isotropic plasticity material model based on von Mises yield
criterion, MAT_024 in LS-DYNA [31], was used to model the elastoplastic behavior of
the dissipater in the simulation. The material property used for the study was provided by
the industrial partner, which was PP T20 polymer. The material had strain rate effects
implemented in the plastic region. The density, elastic modulus, and Poisson’s ratio were
specified as 1040 kg/m3, 1.1 GPa, and 0.3, respectively. The strain to failure was 0.8. The
yield stress and the effective stress versus effective plastic strain relation were rate
dependent and described with multiple stress versus strain curves over multiple strain rates.
The yield stress and ultimate stress under a strain rate of 0.001 s-1 were 9.2 MPa and
25.2 MPa, respectively. The ordinate of the effective stress versus effective plastic strain
relation increased by approximately 2 MPa whenever the strain rate increased by a factor
of 10.
5.1.3. Contact algorithms
The contact algorithm defined between the impactors and the energy dissipater was
a segment based, automatic surface-to-surface contact [31]. In this contact definition, the
dissipater was the slave and impactors were the master since the dissipater possessed a
more discrete mesh. The static and dynamic coefficient of friction was unknown since no
physical material was available for testing. Nevertheless, the friction coefficient was
estimated to be 0.4 for the static condition and 0.3 for the dynamic condition; these
recommendations and supplier catalogs for steel to polymer contact. The exponential decay
coefficient was set to 104 for all contact definitions which resulted in a rapid transition
between the static and dynamic coefficients of friction. The optional card “SOFT” was
activated with default parameters to invoke segment-based contact and reduce penetration.
An automatic single-surface contact algorithm was also defined for the dissipater to
account for self-contact during compression. The single surface contact included friction
coefficients of 0.5 and 0.4 for static and dynamic conditions, respectively.
5.1.4. Boundary conditions and simulation environment
Several boundary conditions were applied to the impactors and the energy
absorbing structures. The impactors were constrained to only allow for translation in the
z-axis as shown in Figure 8. The boundary condition of pilot study designs was different
due to the geometry of the structure, which will be discussed in a later section with the
dimension of the designs. Impactor displacement was defined with a boundary prescribed
motion with 10 m/s for the legform test and 1 m/s for the pendulum test as described in the
prescribed requirements in Section 4. All models were simulated with explicit time
integrals. No time scaling or mass scaling was used. The analysis was performed with
LS-DYNA, shared memory processing (SMP), double precision solver R8.0.0. Data from
the simulation results including energy terms and contact forces were output at 50 kHz for
the legform. Since the pendulum tests were simulated with a test rate 10 times lower than
the complementary legform tests, the data from the pendulum tests were collected at a
proportionate rate of 5 kHz. By carefully observing and comparing the load/displacement
5.1.5. Layer offset of energy absorber
For the designs with a continuous contact surface, the legform impact test result
was not affected by the location where impact was initiated. However, for the design
structure with a discontinuous initial contact surface, as shown in Figure 10, the load
response will be affected. Figure 11 shows the comparison of the legform test results by
having different initial impact locations for the structure in Figure 10. This effect will cause
the results of legform test for the structure with a discontinuous contact surface to be
unreliable. To reduce this inconsistency, the structure was divided into multiple layers in
the y-direction and offset in the x-direction. The number of layers was decided based upon
the size of discontinued space, larger space required more offset layers. Each layer was
offset in the x-direction with distance calculated by the dividing the x-dimension of the cell
with number of layers. Preliminary design 2 and 3 in the following section were divided
into several layers, as needed.
Figure 11. Result of legform test of Figure 10 with different impact location.
5.2.Pilot study designs
A myriad of structures with diverse working mechanisms were considered based
on the information and results obtained from previous studies. Axial loading structures
with uniform cross section are advantageous since they typically yield a highly repeatable
load/displacement response. Axial cutting and inversion are especially favorable since
these energy dissipation methods are capable of yielding a near-constant load/displacement
response. However, these designs were rejected from further consideration since the
deformation requires nearly perfect loading alignment to prevent buckling, and because of
the low space efficiency of the deformation process, and the requirement to install a cutter
and deflector which consumes both space and mass capacity within a given system.
Moreover, the deformation modes of tube under axial loading could not be designed to
Based on the requirements of the study, many designs were tested. Some of them
did not generate results as expected and were therefore removed from consideration. After
a series of tests on designs inspired by previous studies had been completed, three typical
structures were selected as preliminary designs for more detailed investigation and
comparison: (1) stacked, alternating layers of hemispherical structure, (2) an array of
adjacently positioned lateral rings and (3) a rounded top, self-stiffening rectangular array.
All three designs were selected based on the knowledge from reviewing previous studies
that potentially address the capabilities of self-adaptive energy absorption.
5.2.1. Preliminary design 1: Hemispherical structure
The first design utilized a similar concept of the axial loading of frustum, spherical
shell and eggbox energy absorber. Layers of repeating hemispheres were stacked in an
alternating fashion such that the hemispheres were in contact with each other as shown in
(Figure 12(a)). When the structure is loaded, the hemispherical caps will compress into flat
plates as their diameters increase. When multiple hemispheres are simultaneously
compressed, adjacent caps will resist their respective radial deformations, acting as a
boundary constraint, and therefore increasing the force required for plastic deformation.
In addition to this self-stiffening behavior, hemispherical cells were selected to
ensure contact stability during the crushing process. As shown in Figure 16(a), an
increasing degree of lateral shifting occurs throughout the structure at elevated
deformations. A similar design with frusta instead of hemispheres was investigated and the
lateral shift in upper layers during the legform test reduced the contact area between layers
and caused the frustum to deform in an undesired shape. The hemispherical cells will
flat-sided cell under shifting. This will result in the most efficient load path between the cellular
chains which is crucial to a stacked energy dissipating structure.
Each layer of the hemispheres had a structural thickness of 10 mm, with 8 layers
stacking to fit the design space available. The wall thickness was 2 mm. The
center-to-center distance between adjacent hemispheres was 25 mm. The nodes at the
bottom surface of the lowest layer were fully constrained against both translation and
rotation. The nodes on the end surface perpendicular to the x-axis were constrained against
translation in the x-direction and rotation along the y-axis and z-axis to represent a
symmetry condition. The nodes on the end surface perpendicular to the y-axis were
constrained to prevent translation in the y-direction to ensure the structure will not deform
outside of the design space.
5.2.2. Preliminary design 2: Lateral ring structure
The second design was inspired by the previous investigation where constraints
were imposed on the lateral compression of circular tubes. The structure was composed of
an array of rings that were loaded orthogonally to their axes (Figure 13(a)). Additionally,
adjacent rows were offset laterally by the magnitude of their radii to increase the
consistency of contact conditions. When a circular ring is compressed laterally and
deformed, the radius parallel to the loading direction decreases with a corresponding
increase in the transverse directions, yielding an elliptical geometry. This deformation
phenomenon was not expected to occur for rectangular cells or other alternative flat-sided
structures. Therefore, ring-like cells were chosen. This lateral deformation is significant
for cases when multiple adjacent rings are loaded; transverse deformation will be
suppressed due to interaction between neighboring rings. The tight contact between
adjacent cells ensures that lateral resistance will occur instantaneously. This will result in
a more complex bending mode, increasing the structure’s rigidity and maximizing the
potential energy absorption.
The diameter of the rings was 80 mm and the wall thickness was 3 mm. The
structure was divided into 2 layers in y-direction and offset at 40 mm in x-direction. For
this design, applying symmetry for the end surfaces and constraining the bottom surface as
in hemisphere design was not suitable. Three solid walls were created on the bottom and
two ends in the x-direction as shown in Figure 13(b), acting as a barrier for the design space.
These walls had similar properties to the pendulum impactor both in element and material
also similar to the contact defined for the absorber to pendulum impactor as discussed in
Section 5.1. The nodes of the walls where fully constrained for all degrees of freedom.
Figure 13. The lateral ring design in (a) front view, (b) isometric view.
5.2.3. Preliminary design 3: Round top cellular structure
The third design was based on a modification of the lateral ring structure design
with an amalgamation of aspects from the first design. The upper section is elliptical and
converges into a rectangular profile towards the lower section (Figure 14(a)). The intention
of the design of the lower section was to produce a high load response in the initial stage
of the deformation similar to square tubes under lateral loading in the pendulum test. When
multiple cells are loaded, the neighboring cells will transfer the crushing load to the base
and subject the structure to compression while resisting transverse deformation, artificially
increasing the stiffness. This concept is discussed in further detail with consideration for
the load path for a revised design in Section 6.1 of this document. Unlike either of the
previous designs, this preliminary design utilizes energy dissipating cells which are fixed
together. The additional constraints were more feasible with this proposed geometry and
of 10.7 mm and the oblique wall made a 68.5 degrees angle with the x-y plane. The height
of the lower section was 35 mm and the width of the cell in the x-direction was 50 mm.
The full structure consists of 9 complete cells and 2 half-cells, one at each end of the
structure, connected at the lower section of the structure over the span in the x-direction.
The nodes of the cutting surface of the half-cell were constrained to prevent translation in
the x-direction and rotation along the y and z axes for symmetry. The bottom surface of
the structure was fully constrained. Since the contacting surface at the top of structure was
discontinuous and the gap was relatively large, the structure was divided into 4 layers in
the y-direction and offset by 12.5 mm in the x-direction between each layer.
Figure 14. The round top cellular design in (a) front view, (b) isometric view.
5.3.Pilot study results
The pilot study emphasized a comparison between the force/displacement
responses and deformation modes in both testing configurations. Following the comparison,
the most preferable design was selected and modified based on the critical findings. The
following parameters were utilized to assess the performance on each design: consistency
of the load/displacement response in the legform test, the instance of peak energy
absorption in the pendulum test and the ratio between the average legform and pendulum
5.3.1. Hemispherical structure
The load/displacement response of the pendulum test for the hemispherical
structure in Figure 15 displayed an increasing load as the impactor progressed and the
hemispherical geometries were progressively compressed into flat sheets. The crushing
load reached 33 kN at 32 mm, followed by a minor fluctuation between 32 mm to 50 mm,
then increased rapidly as the space between the impactor and bottom surface became
occupied by the compressed material. During the legform test as shown in Figure 16(b),
the contact area increased as the impactor traveled downwards, this resulted in an increased
load response proportional to the increase in contact area. The load/displacement response
in the legform test increased continuously throughout the simulation, reaching
Figure 16. Impact deformation of hemispherical structure for (a) Pendulum test at 20 mm and (b) Legform test at 50 mm.
5.3.2. Lateral ring structure
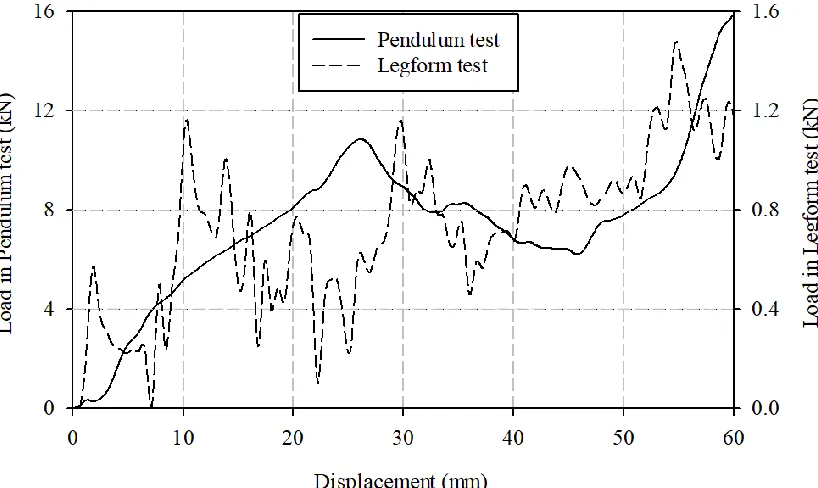
For the lateral ring structure test result (Figure 17), the load/displacement response
in the pendulum test experienced a near-zero crushing force within the first 5mm of
displacement, followed by a quasi-linear increase up to 20 mm. The first peak load and
corresponding maximum energy absorption occurred at 26.4 mm of deformation, with the
energy absorber transitioning from a ring-like geometry to rectangular cells as shown in
Figure 18(a). A resultant peak load of 11 kN was observed. The second peak load of 16 kN,
and global maximum for the response, occurred beyond 50 mm of displacement. In contrast
to the pendulum test, the rings in the legform test were not constrained laterally under
compression (Figure 18(b)), resulting in significantly less resistance as illustrated by the
load/displacement response. Additionally, as the deformed rings expanded laterally
adjacent rings were shifted; the contact area between the impactor to the adjacent rings was
reduced due to this behavior. The load response in the legform test displayed a peak load
Figure 17. Load response versus displacement of lateral ring structure design.
Figure 18. Impact deformation of lateral ring structure for (a) Pendulum test at 26 mm and (b) Legform test at 35 mm.
5.3.3. Round top cellular structure
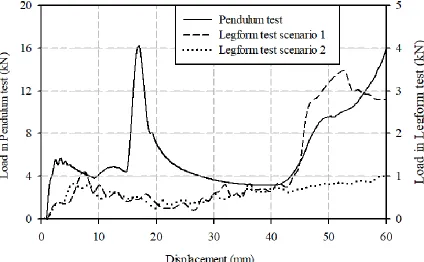
The load/displacement curve from the pendulum test on the round top cellular
structure (Figure 19) exhibited local maxima of 32.0 kN at 17 mm and 60 mm. The first
peak load occurred when the rounded upper section was compressed into a geometry with
The first scenario considered impact directly above a vertical wall in the lower section.
High compressive loads were observed as the impactor approached the vertical
wall (Figure 20(b)). In the second scenario, the impactor was offset to the side of the
wall (Figure 20(c)). These loading cases will be referred to in later sections as scenarios 1
and 2, respectively. In this test, the wall was subjected to a bending load which resulted in
a significantly lower load response. Both scenarios of the legform impact possessed a
similar load response below 2 kN and prior to 45 mm of deformation; beyond 45 mm, the
load response remained consistent at approximately 1.8 kN until termination in scenario 2.
In contrast, scenario 1 displayed a sudden increase in load to 7.0 kN for the remainder of
the test. It is important to note that the scenario 1 accounted for less than 10% of the
possible impact occurrences.
Figure 20. Impact deformation of round top cellular structure for (a) Pendulum test at 17 mm, (b) Legform test scenario 1 at 42 mm and (c) Legform test scenario 2 at 42 mm.
5.3.4. Comparison of pilot study results
All preliminary designs functioned as expected in the pendulum test with the
self-stiffening requirements. The hemispherical structure possessed a self-stiffening
geometry prior to the initial deformation while the lateral ring structure and round-top
cellular structure required some deformation to achieve a self-stiffening structure. To
evaluate the performance of the 3 designs the following parameters were considered: the
consistency in load during the legform test, the occurrence and locations of peak energy
absorption in the pendulum test, and comparison between the mechanical responses
observed during the legform and pendulum tests of each design individually.
For the legform test, the hemispherical structure experienced a steady, gradual
increase in load throughout the test. The lateral ring structure and the round-top cellular
structure both experienced a rapid increase in load initially, followed by a short decrease
in the load response and finally, a slow increase until termination. For the pendulum test,
the hemispherical structure absorbed the majority of the energy in the second half of the
test, between 30 mm and 60 mm. The lateral ring structure displayed a local peak of load
absorption between 15 mm and 20 mm of deformation with a local peak load of 16 kN.
The ratio of average loads between the pendulum tests and legform tests for the
hemispherical structure, lateral ring structure and round top cellular structures were 5 to 1,
9 to 1 and 10.2 to 1, respectively. For each scenario, the average load (Pm) was calculated
as a function of load (P) within the displacement (S) domain as per the method
demonstrated in equation 1.
𝑃𝑚 = 1
𝑆𝑡𝑜𝑡𝑎𝑙 ∫ 𝑃(𝑆)𝑑𝑆
𝑆𝑡𝑜𝑡𝑎𝑙
0
(1)
However, since the load/displacement responses were generated from discrete data points
rather than continuous functions it was impossible to perform a true integration of the data.
Therefore, the average load was numerically approximated using equation 2.
𝑃𝑚 = 1
𝑆𝑡𝑜𝑡𝑎𝑙∑(𝑆𝑖+1− 𝑆𝑖) ∙ (
𝑃𝑖+1+ 𝑃𝑖
2 )
𝑛−1
𝑖=1
(2)
These average loads and the complementary peak loads are summarized in Table 1. It is
important to note that multiple maximum loads were present in pendulum tests of the lateral
ring structure and rounded top cellular structure; the results are therefore displayed in
Table 1. Key parameters from the load/displacement responses of preliminary designs.
Legform test Pendulum test
Preliminary designs Peak load (kN) Average load (kN) Peak loads (kN) Displacement at peak load(s) (mm) Average load (kN) Hemispherical
structure 10.0 4.0 23.0 32.0 20.5
Lateral ring
structure 1.5 0.7
10.8* 16.9
26.4
60.0 6.5
Round top
cellular structure 2.0 1.2
32.0 31.6*
17.0
60.0 12.2
Note: * indicates that the peak load represents a local maximum.
Comparing the legform test results, the round top cellular structure demonstrated
the most consistent load/displacement response. Among the pendulum test results, the
round top cellular structure could absorb the greatest quantity of energy in the early stages
of deformation. This is demonstrated in Table 1 by a primary peak crushing load of 32.0 kN
at 17.0 mm of deformation for round top cellular structure compared to 23.0 kN at 32.0 mm
and 10.8 kN at 26.4 mm for the hemispherical and lateral ring structures, respectively.
When comparing the average loads between the pendulum and legform tests of each
individual design, the round-top cellular structure also possessed the greatest pendulum to
legform force ratio. A summary of this comparison is provided in Table 1. Since the
round-top cellular structure displayed the most favorable results with respect to the
previously described considerations, it was therefore selected for further revision and study.
Although alternative scenario 2 of the legform test for round top cellular structure could
potentially result in a high load response, the occurrence was less than 10%; reduction of
this behavior should be an important consideration for further study.
![Figure 3. Types of tube inversion. [9]](https://thumb-us.123doks.com/thumbv2/123dok_us/1363092.1169125/23.612.190.459.130.546/figure-types-of-tube-inversion.webp)