ISSN(Online): 2320-9801
ISSN (Print): 2320-9798
International Journal of Innovative Research in Computer
and Communication Engineering
(An ISO 3297: 2007 Certified Organization)
Vol. 4, Issue 7, July 2016
Machine Learning for Big Data Analytics
Dhananjay Tyagi
Department of Computer Science and Engineering, Guru Tech Bahadur Institute of Technology, New Delhi, India
ABSTRACT: Big data is more than just repository and access to data. Big data Analytics plays an imperative role in making sense of the data and capitalizing it. But it’s a substantial challenge to discern and cultivate new types of machine learning algorithms. Scaling up big data to suitable dimensionality is an issue that is tackled in machine learning algorithms, also there are challenges of dealing with velocity, volume and various more across all categories of machine learning algorithms. This paper probes big data concept, bringing with a desperate need for advanced data acquisition, management, and analysis mechanisms.Also, this paper presents the concept of big data and spotlights the four phases of big data that are engendering data, acquisition of data, storing this voluminous data, and then analysing it. The next phase of this paper, zeros on dealing with big data using machine learning (ML), and spotlighted the four ML methods: supervised learning, unsupervised learning, semi-supervised and reinforcement learning and its impact on big data.
KEYWORDS: Big Data, Machine Learning, Supervised learning, unsupervised learning, Semi-supervised, Reinforcement learning.
I. INTRODUCTION
As a result of the huge data explosion, largely due to the widespread presence of the Internet, there is an exigency to automate large-scale data analytics. Big data analytics processes diverse data from various distributed data source producing complete data set.Big Data technologies present a new rank of technologies and architectures, constructed so organizations can prudentlyextract value from voluminous and disparate data by high-velocity seizure, discovery or analysis. Advances in Machine Learning hitherto, have tackled this need by exploiting statistical methods that learn from data. Some methods such as Supervised and Unsupervised Learning can handle problems such as classification and clustering. Given their manifold applications, these Machine Learning techniques attract a large audience in computing. Researchers in Computer Security employ these techniques to discern peculiarbehaviour in streaming data. In the field of Green Computing and Smart Energy, Machine Learning approach is employed to grasp energy usage patterns and correspond them with real-time demands. Computational Biologists are applying Machine Learning for time-series data design to unravel the puzzle, that is, the human genome. Intricate graphical frameworks are being adopted by Linguists to unearth syntactic structures in written languages and words. Also outside the realm of Computer Science, kernel process and Bayesian predictions have aided financial analysts to fruitful proprietary trading strategies, and astronomers to cluster stars. Most of these applications have credence on years of human cognizance transfer amongst developments, and different empirical refinements to the designs, to equip Machine Learning techniques so that they work in any particular sphere.
ISSN(Online): 2320-9801
ISSN (Print): 2320-9798
International Journal of Innovative Research in Computer
and Communication Engineering
(An ISO 3297: 2007 Certified Organization)
Vol. 4, Issue 7, July 2016
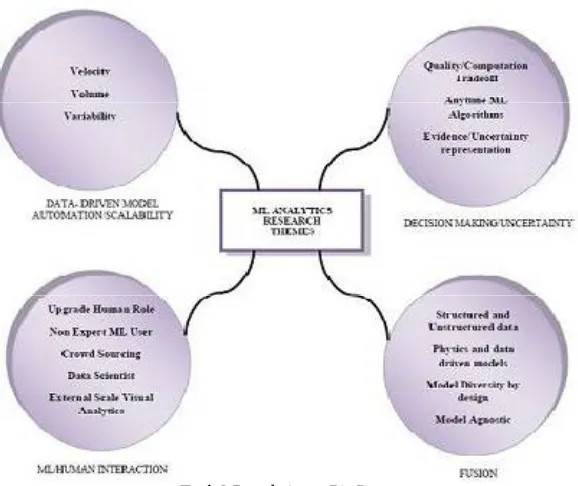
Fig 1. ML analytics on Big Data
II. BIG DATA AND ITS IMPACT
A. Layered Architecture of Big Data
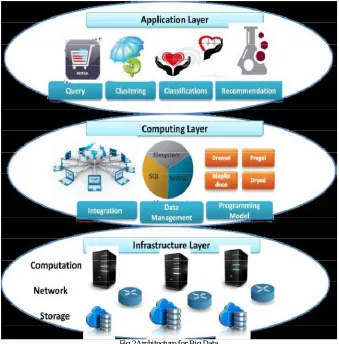
The big data system can be disintegrated into a layered structure, as illustrated in Fig. 2. The layered structure can be further decomposed into three layers, i.e., the application layer, the computing layer, and, the infrastructure layer from top to bottom. This decomposed view provides a conceptual hierarchy to manifest the complexity of a big data system. The objective of each layer is as follows.
The infrastructure layer is made up of a large number of ICT resource which can be handled by cloud computing. These resources will be in contact to upper-layer systems in a one-grained fashion with a special service-level agreement (SLA). Within this scheme, resources must be apportioned to realize the big data demand while accomplishing resource efficiency by increasing system utilization, energy cognizance, operational elucidation, etc. The computing layer encapsulates various data tools into a middle layer that runs above the crude ICT resources. In the premise of big data, tools include data integration, data management, and the programming model.
Data integration means elicitation of data from disparate sources and subsuming the dataset into a unified form with the needed data pre-processing operations. Data management provides persistent data storage and highly efficient management, such as distributed systems and SQL or NoSQL data repositories. The programming scheme implements abstraction application logic and expedites the data analysis applications.
ISSN(Online): 2320-9801
ISSN (Print): 2320-9798
International Journal of Innovative Research in Computer
and Communication Engineering
(An ISO 3297: 2007 Certified Organization)
Vol. 4, Issue 7, July 2016
Fig.2Architecture for Big Data
B. Big Data Phases
A big-data system is convoluted, employing different functions to handle with different phases in the digital data life cycle from its emergence to its obliteration. At the same time, the system also involves various distinct phases for diverse applications. In this section, we highlight on the chain for big data analytics. Specifically, we delineate the big data chain that is composed of four stages.
Fig. 3. Big Data Value Chain
a. Data Generation
ISSN(Online): 2320-9801
ISSN (Print): 2320-9798
International Journal of Innovative Research in Computer
and Communication Engineering
(An ISO 3297: 2007 Certified Organization)
Vol. 4, Issue 7, July 2016
Stage I: The first stage started in the 1990s. As digital technology and database systems were widely accepted, many
management systems in various organizations began saving volumes of data, such as bank transactions, transportation records, and government sector archives. These datasets are organized and can be investigated via database-based storage management systems.
Stage II: The second stage started with the rising acclaim of web systems. The Web 1.0 systems, represented by web
search engines and e-commerce businesses during the late 1990s, generated myriads of semi-structured and/or unstructured data such as web pages and transaction logs. Since the late 1990s, many Web 2.0 applications created a plethora of user-generated content from social networks, such as records, forums, online groups, blogs.
Stage III: The third stage is sparked by the surge in mobile devices, such as smart phones, PDAs and other
Internet-enabled gadgets. The mobile focused networks has created highly mobile, location-informed, person-centered, and context pertinent data. Withthis classification, it is intelligible that the data is being generated at a fast pace, from passive documentation in Stage I to active generation in Stage II and automatic production in Stage III. These three classes of data constitute the chief sources for big data.
b. Data Acquisition
As represented in the big data value chain, the function of the data acquisition phase is to accumulate information in a digital fashion for further storage and analysis.The acquisition process is composed of three sub-steps, data compilation, data transmission, and data pre-processing, as shown in Fig. 4. Data elicitation refers to the process of retrieving crude data from real-world users/objects. The process needs to be well constructed. Otherwise, imprecise data collection would affect the subsequent data analysis procedure and conclusively lead to irrational results. Data transmission means that once we gather the crude data, we must transfer it into a data storage framework, generally in a data centre, for subsequent processing. The transmission procedure can be decomposed into two stages, IP backbone transmission and data centre transmission
Fig.4 Subtasks of Data Acquisition
Data pre-processing is also imperative in data acquisition phase. Because of the disparate sources, the procured data sets may have various levels of quality with respect to noise, redundancy, consistency, etc. Transferring and saving crude data would have necessary costs. Certain data analysis schemes and applications might have stringent requirements on the quality of data. As such, data preprocessing methods that are designed to better the data quality should be in position in big data systems.
c. Data Storage
The data storage subsystem in a big data platform formulates the elicited information in an apt format for analysis and value elicitation. For this, the data storage subsystem should furnish two sets of characteristics: The storage infrastructure must shelter information in a steady and dependable manner. The data storage subsystem must furnish a scalable access interface to query and analyze the large volumes of data. This functional decomposition manifests that the data storage subsystem can be segregated into hardware infrastructure and data management.
d. Data Analysis
ISSN(Online): 2320-9801
ISSN (Print): 2320-9798
International Journal of Innovative Research in Computer
and Communication Engineering
(An ISO 3297: 2007 Certified Organization)
Vol. 4, Issue 7, July 2016
Secondly, this paper discusses the application development for different data sources and outlines the six most significant areas. Lastly, this paper introduces different typical methods that play central roles in data analytics.
III. MACHINE LEARNING FOR BIG DATA
The vitalcapabilities of the data analytics and the machine learning to model, discern from, and forecast data were significantly affected by the arrival of big data. Almost instantaneously the challenge came from all sides: accessing large volumes of data, learning the models from it and carry out volumes of forecasts all in a plausible amount of time. Since big data processing requires disintegration, parallelism, modularity and/or recurrence, rigid black-box type machine learning models floundered on the outset. As a matter of fact, all machine learning algorithms with computational complexity of O(n2) rapidly become unmanageable when faced with billions of data objects. Depending on the pool of knowledge that is accessible for learning, ML schemes can be classified into supervised, unsupervised, semi-supervised and reinforcement learning algorithms.
Supervised learning algorithms are first trained using labeled examples, for instance an input where the correct output
is known beforehand. The learning algorithm is given a set of inputs along with their corresponding correct outputs and then the algorithm learns by comparing its calculated output with correct outputs to find errors. It then adjusts the model accordingly. Through methods like classification, regression, and gradient boosting, supervised learning uses the structures and patterns to predict the values of the label on unlabeled data. Supervised learning is employed in applications where previously known data likely predicts future events. For example, predict housing prices when the previous records with correct labels are provided.
Unsupervised learning algorithms are employed when no previously known labels are provided. The system is not
given the “correct labels” to the data points. The algorithm must understand what is being presented and find some structure within. Unsupervised learning works fine on transactional data. For example, it can discern segments of customers with similar attributes who can then be dealt accordingly in marketing campaigns. Or it can find the chief attributes that distinguish customer categories. Examples of such algorithms arenearest-neighbor mapping, k-means clustering, anomaly detection and singular value decomposition. These algorithms are also used to categorize text topics and recognize data outliers.
Semi-supervised learning is a part of supervised learning but also employs unlabeled data for learning. It uses both
labeled and unlabeled data for training – generally a small amount of labeled data and a large volumes of unlabeled data (because unlabeled data isinexpensive and requires less effort to acquire). This type of learning scheme can be employed with methods such as classification, regression and prediction. Semi-supervised learning is employed when the cost of labeling is very high to facilitate for a fully labeled training process. Examples of this include face recognition.
Reinforcement learning algorithms discover via trial and error which actions produce the greatest cumulative rewards.
This type of learning has three fundamental components: the agent (the one who learns the decision), the environment (things the agent interacts with) and actions (what the agent do). The aim is for the agent to choose actions that will maximize the expected reward in a given amount of time. The agent will reach the objective much faster by following a good scheme. So the aim in reinforcement learning is to learn the best strategy.
IV. CONCLUSION
ISSN(Online): 2320-9801
ISSN (Print): 2320-9798
International Journal of Innovative Research in Computer
and Communication Engineering
(An ISO 3297: 2007 Certified Organization)
Vol. 4, Issue 7, July 2016
REFERENCES
1. T.M. Mitchell. Machine Learning. McGraw-Hill, New York, 1997
2. 2. B. Park and H. Kargupta, Distributed data mining: Algorithms, systems, and applications, distributed data mining handbook. 3. A. Mohri, A. Rostamizadeh and A. Talwalker. Foundations of Machine Learning. The MIT Press, Cambridge, 2012.
4. D. Fisher, R. DeLine, M. Czerwinski, and S. Drucker, ``Interactions with big data analytics,'' Interactions, vol. 19, no. 3, pp. 50_59, May 2012.
5. O. Chapelle, B. Cholkopf, A. Zien. Semi-Supervised Learning (Adaptive Computation and Machine Learning Series). MIT Press, Cambridge, 2006.
6. S. Marsland. Machine Learning, An Algorithmic Perspective. Chapman and Hall / CRC Press, Boca Raton, 2009.
7. J. Gantz and D. Reinsel, ``The digital universe in 2020: Big data, bigger digital shadows, and biggest growth in the far east,'' in Proc. IDC iView, IDC Anal. Future, 2012.
8. C.M. Bishop. Pattern Recognition and Machine Learning. Springer, New York, 2006.