Transactions of the 17th International Conference on Structural Mechanics in Reactor Technology (SMiRT 17) Prague, Czech Republic, August 17 –22, 2003
Paper # K16-1
Seismic Analysis of Coupled Primary – Secondary Systems: Effect of
Uncertainties in Modal Properties
Abhinav Gupta and Byounghoan Choi
Center for Nuclear Power Plant Structures, Equipment and Piping North Carolina State University
INTRODUCTION
Seismic response of secondary systems, in addition to their own dynamic properties, depends upon the interaction with the primary structure supporting them. A variation in the primary structure properties due to uncertainties in material characteristics, soil-structure interaction or modeling techniques can cause a significant variation in the secondary system response. In the conventional uncoupled analysis, the effect of these uncertainties is considered by broadening the peaks of floor response spectra or conducting multiple analyses by shifting the floor response spectra in a specified range of frequencies. According to the USNRC
recommendation [8], this frequency region is obtained by considering a ±15% variation in the frequencies
associated with the spectral peaks. Unlike a coupled primary-secondary system analysis, an uncoupled analysis can be excessively conservative as it does not account for the effects of non-classical damping and mass interaction between the two sub-systems [3,4]. Peak Broadening and Peak Shifting methods increase the conservatism in the conventionally evaluated responses [1]. These methods cannot be directly used in the coupled primary-secondary system analysis as the floor response spectra are neither generated nor required. One way to account for the effect of these uncertainties in a coupled primary-secondary system analysis is to conduct multiple analyses by varying the primary system frequencies and evaluating the final response statistically. Choi and Gupta [2] studied the effect of uncertainties in only the earthquake input and the frequency of uncoupled primary system. In this paper, we present a detailed discussion on incorporating the effect of uncertainties in the modal properties (frequencies and damping ratios) of both the uncoupled primary and the uncoupled secondary system in a coupled system analysis by response spectrum method.
COUPLED SYSTEM ANALYSIS
The equation of motion for an N-DOF coupled primary-secondary system is given by
[ ]
M{ }
U&& +[ ]
C{ }
U& +[ ]
K{ }
U =−[ ]
M{ }
Ub u&&g (1)in which {U} is the displacement vector relative to the fixed base and {Ub} is the static displacement vector of
the coupled system when the base of the primary system undergoes a unit displacement in the direction of the earthquake. Gupta and Gupta [3,4] introduced a transformation in which the displacement at primary system DOF are expressed relative to its fixed base and those at the secondary system DOF relative to the primary system connecting DOF. The corresponding equation of motion in the transformed coordinates is written as
[ ]
M{ }
U&& +[ ]
C{ }
U& +[ ]
K{ }
U =−[ ]
M{ }
Ub u&&g (2)The complex eigenvector pair evaluated by solving Eq. (2) together give two real response vectors
{ }
Ψid and{ }
v iΨ corresponding to the ith coupled mode.
{ } { }
iN
i
v i i d i v
i d i N
i
i
U
U
y
y
U
U
∑
∑
∑
&
= =
Ψ
−
Ψ
=
−
=
=
1 1
(3)
where is the relative displacement and the relative velocity of an equivalent SDOF oscillator. In practice,
the design responses are calculated using the response spectrum method in which the earthquake input is defined by a design spectrum corresponding to a specified level of non-exceedence probability (NEP). In this method, the modal responses are calculated as follows and combined in accordance with an appropriate rule to obtain the design response [5].
i
y y&i
{ } { }
{ } { }
{ }
vDi v i i v Vi v i v
i d
Di d i d
i
S
U
S
S
U
=
Ψ
=
Ψ
=
ω
Ψ
(4)where SDid and are the spectral displacements corresponding to the frequency and damping ratio of the i
v Di
S th
RELATIVE SIGNIFICANCE OF UNCERTAINTY IN INPUT EXCITATION AND MODAL PROPERTIES
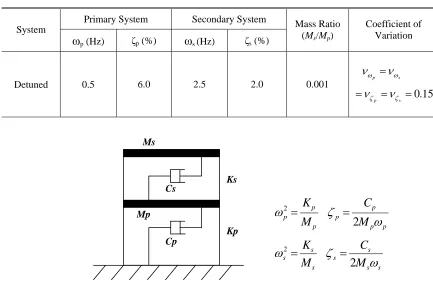
Gupta and Gupta[3,4] have shown that the secondary system response can be greatly influenced by the mass interaction and non-classical nature of damping in a coupled system analysis. Therefore, uncertainties in the modal properties of primary and secondary systems can lead to significant variation in the secondary system response. To illustrate the effect of uncertainties in modal properties of primary and secondary systems, we consider two different coupled (SDOF primary – SDOF secondary) systems of the type shown in Fig. 1. One of the two coupled systems comprises of detuned primary and secondary oscillators while they are perfectly tuned in the other coupled system. Table 1 gives the characteristics of the uncoupled systems in each of the two 2-DOF coupled systems. The relative effects of uncertainties in the earthquake input, the frequencies, and the damping ratios of the uncoupled primary and secondary systems is evaluated by conducting multiple time history analyses for each of the two coupled systems. First, the secondary system responses are evaluated by considering a variation in only the input excitation. All the earthquake records are normalized to the same value of ZPA for this purpose. Next, the responses are calculated using only a single normalized earthquake record but considering a variation in the frequencies of the uncoupled primary and secondary systems. Finally, the secondary system responses are calculated by considering a variation in only the damping ratios of the uncoupled systems. Fig 2 shows the relative values of displacements for each of the three analyses types in the detuned as well as tuned cases. For ease of comparison, the secondary system displacements in Fig 2 are normalized with respect to the maximum displacement evaluated in a particular type of analysis. As evident for a tuned system from Fig. 2, the effects of uncertainties in frequencies and input excitation have relatively greater significance than that due to uncertainties in only the damping. However, the effect of uncertainties in the damping ratios of the two uncoupled systems cannot be neglected as these uncertainties can also influence the secondary system response significantly. On the other hand, the effect of uncertainties in the input excitation dominates in a detuned system thereby rendering the effect of uncertainties in frequencies and damping ratios of the uncoupled systems meaningless. Consequently, the behavior of tuned or nearly tuned primary and secondary systems is emphasized in the rest of this paper.
Table 1. Modal Properties of Uncoupled Primary and Secondary Systems
Primary System Secondary System
System
ω
p (Hz) ζp (%)ω
s (Hz) ζs (%)Mass Ratio
(Ms/Mp)
Coefficient of Variation
Detuned 0.5 6.0 2.5 2.0 0.001
15
.
0
=
=
=
=
s p
s p
ζ ζ
ω ω
ν
ν
ν
ν
Ms
Cp Cs
Kp Ks
Mp
s s
s s
s s s
p p
p p
p p p
M
C
M
K
M
C
M
K
ω
ζ
ω
ω
ζ
ω
2
2
2 2
=
=
=
=
0 0.4 0.8 1.2
Base Excitation
Frequency
Damping Ratio
Fig. 2. Relative Significance of Uncertainties in Base Excitation and Modal Properties
Normalized Displacemen
t
Tuned System Detuned System
EVALUATION OF DESIGN RESPONSE BY MONTE CARLO SIMULATION
The primary reason for characterizing the design spectrum at 84% NEP is to account for uncertainty in the earthquake input. Consequently, the design response is implicitly defined at the same NEP, i.e. if a design spectrum corresponds to the 84% NEP over multiple earthquake time histories that are normalized to the same value of ZPA, then an alternative to evaluating the design response would be to conduct multiple time history
analyses of the structure using individual time histories and to select the 84th percentile value as the design
response [7]. Such an approach would also facilitate the evaluation of design response when uncertainties in the frequencies and damping ratios of uncoupled systems are considered. Considering the random variables representing the frequencies of the uncoupled systems, their damping ratios, and the earthquake input to be independent, a Monte Carlo simulation can be conducted in which multiple time history analyses are performed. For each analysis, the variables are sampled from a set of randomly generated values for the frequencies and damping ratios together with a collection of normalized earthquake time histories that were used to arrive at the design spectrum. Once again, the design response is selected as that corresponding to the 84% NEP. This approach cannot, however, be extended directly to the response spectrum method due to reasons discussed below.
As stated earlier, characterization of design spectrum at 84% NEP is intended to account for uncertainty in the earthquake input. Such a characterization ensures that the individual modal responses correspond to the same NEP and that the design response obtained after combining modal responses is close to the intended value of 84% NEP. When an uncertainty in the modal properties is also considered, this process is likely to give satisfactory results for detuned primary - secondary systems wherein uncertainty in input excitation dominates the response of secondary system as shown in Fig. 2. Therefore, one may conduct a Monte Carlo Simulation wherein multiple response spectrum analyses are conducted by considering a single design spectrum together with a variation in the frequencies and damping ratios of the uncoupled primary and secondary systems. The design response can then be specified as that corresponding to the 84% NEP over all the responses. Contrary of the behavior exhibited by detuned primary – secondary systems, the secondary system response in a tuned case is not dominated by the uncertainty in input excitation alone as was shown earlier in Fig 2. Therefore, selection of a design response corresponding to 84% NEP is likely to be excessively conservative. This is so because the
design spectrum is itself specified at 84% NEP and the modal responses evaluated at 84th percentile value by
considering a variation in only the modal properties will give values that are much higher than the corresponding values obtained from multiple time history analyses. These excessively high values of modal responses then result in design responses that are much higher than the true design response evaluated from a Monte Carlo simulation using multiple time history analyses.
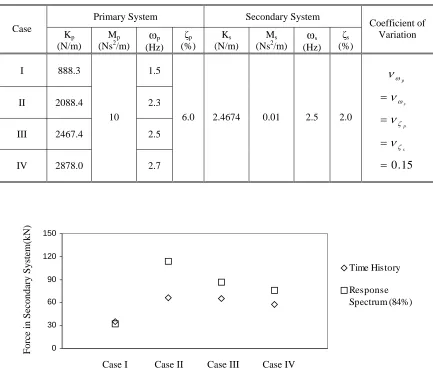
multiple response spectrum analyses, a design spectrum corresponding to 84% NEP is evaluated using the individual response spectra for each of the 75 normalized time histories [2]. The design spectrum is then used as a single specified input in conducting multiple response spectrum analyses by considering variations in the frequencies and damping ratios of the uncoupled primary and secondary systems. Fig. 3 compares the secondary system response corresponding to 84% NEP over these multiple responses with those evaluated from multiple time history analyses. It is evident that in a tuned or nearly tuned primary – secondary systems, specification of design response (or modal response) at 84% NEP can result in excessively high values. Fig 3 also shows that the two responses are close to each other for the detuned system.
The above discussion and illustration necessitates the development of a method to accurately account for the effect of uncertainties in the modal properties of the primary and secondary systems in a seismic analysis of the coupled system by response spectrum method. Next, we use the first order reliability method (FORM) for evaluating the non-exceedence probability value that would be needed to define the individual modal responses so that the combined response corresponds to the true design response, i.e. 84% NEP.
Table 2. Properties of Uncoupled Primary and Secondary Systems
Primary System Secondary System
Case
Kp (N/m)
Mp
(Ns2/m)
ω
p (Hz)ζp (%)
Ks (N/m)
Ms
(Ns2/m)
ω
s (Hz)ζs (%)
Coefficient of Variation
I 888.3 1.5
II 2088.4 2.3
III 2467.4 2.5
IV 2878.0 10
2.7
6.0 2.4674 0.01 2.5 2.0
15
.
0
=
=
=
=
s p s p
ζ ζ ω ω
ν
ν
ν
ν
0 30 60 90 120 150
Time History
Response Spectrum (84%)
Fig. 3. Response Corresponding to 84% NEP in Monte Carlo Simulation
Force i
n
Secondary Syst
em(kN)
Case IV Case III
Case II Case I
FIRST ORDER RELIABILITY METHOD (FORM) APPROACH
For modes with closely spaced frequencies such as those encountered in tuned or nearly tuned primary – secondary systems, the double sum combination rule is used to obtain the design response [5].
∑∑
=
i j
j i ij
R
R
in whichR is the design response whereas
R
i, andR
j are the modal responses in the ithand jth modes,
respectively. The modal correlation coefficient is denoted by
ε
ij. When multiple response spectrum analysesare conducted by varying the frequencies and modal damping ratios of the uncoupled primary and secondary
systems, each analysis gives a unique set of values for modal responses. Evaluation of design response then
requires that the modal responses be defined at specified NEP values so that a combination of these values in accordance with Eq. (5) gives a design response close to 84% NEP. The problem at hand is same as that of evaluating the load and resistance factors in a reliability-based design. To evaluate the NEP at which modal responses are needed to be defined, we consider FORM. The first step lies in characterizing the performance function. The performance function corresponding to Eq. (5) can be written as.
R
0
)
(
−
=
2−
∑∑
=
i j
j i ij
R
R
R
g
ε
(6)The above equation would, however, require statistical properties of not only and but also those of
which are difficult to quantify. Therefore, we re-arrange Eq. (6) into a non-dimensional form as follows. i
R
R
j R0
1
)
(
−
=
−
∑∑
=
i j j i ijX
X
g
ε
R
R
X
i jj i
,
,
=
(7)Eq. (7) facilitates the evaluation of partial load factors for and by considering only the coefficient of
variations for X
i
R
R
ji and Xj together with different values for the mean of
X
iX
j . It should be noted that for all, this ratio varies between 0 and 1, i.e., i
j
X
X
≥
0
≤
X
iX
j≤
1
. Ifγ
iandγ
j are the partial load factorsfor modal responses in the ith and jth modes, respectively, we can write
(
)
(
)
∑∑
=
i j j j i iij
R
R
R
2ε
γ
γ
(8)The partial load factors give the corresponding values of NEP. Once again, we consider the SDOF primary – SDOF secondary systems described earlier in this paper to study the partial load factors. The limit-state equation (performance function) corresponding to Eq. (7) becomes
0
1
)
(
12 1 22 2 2
1
−
−
=
−
=
−
X
X
X
X
g
ε
(8)For simplicity and consistency with the current practice adopted in conventional uncoupled analysis, we assume that the probability distribution and the coefficient of variation for each modal response is same. Although we consider only Gaussian distribution for the preliminary results presented in this paper, other distributions will be
considered later. It is also assumed that correlation coefficient
ε
12 is constant in a particular application ofFORM to Eq. (8). However, the correlation coefficient is varied between 0 and 1 to study the nature of variation
in partial load factors corresponding to different values of
ε
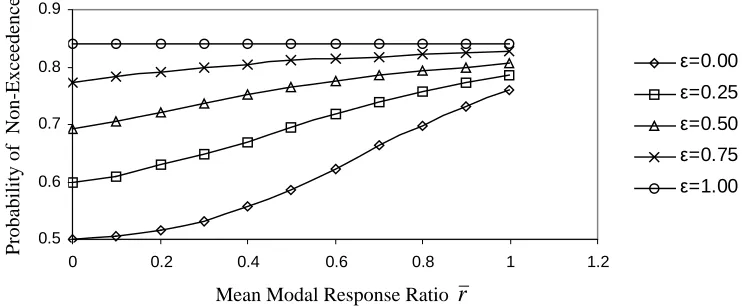
12. Figs. 4 and 5 show the values of NEP(corresponding to the evaluated partial load factors) for each modal response as evaluated using FORM. In these figures, the mean modal response ratio is defined as
(
2 12 1 2 1 R R R R X X
r
µ
µ
µ
)
µ
µ
µ
≥
=
=
(9)in which 1 R
µ
and 2 Rµ
are mean values of modal responses and , respectively. As shown in Figs. 4 and 5,the NEP values vary from 50% to 84% for each modal response depending upon the values of
1
R R2
r
andε
12.These figures show that the modal responses should be defined at 84% NEP in systems that have perfectly
correlated modal responses (
ε
12=
1
) and in systems where only a single mode contributes to the particularresponse quantity of interest (
r
=
0
). In other cases, characterizing modal responses at 84% NEP would give0.7 0.8 0.9
0 0.2 0.4 0.6 0.8 1 1.2
ε=0.00
ε=0.25
ε=0.50
ε=0.75
ε=1.00
r
Mean Modal Response RatioProbability of Non-Exceedence
Fig. 4. Values of NEP for R1 Needed to Evaluate Design Response Defined at 84% NEP
0.5 0.6 0.7 0.8 0.9
0 0.2 0.4 0.6 0.8 1 1.2
ε=0.00
ε=0.25
ε=0.50
ε=0.75
ε=1.00
r
Fig. 5. Values of NEP for R2 Needed to Evaluate Design Response Defined at 84% NEP
Probability of Non-Exceedence
Mean Modal Response Ratio
PROPOSED METHOD
Choi and Gupta [2] have shown that the probability density function for design response and the conditional probability density functions for modal responses (conditioned upon a given set of values for modal properties) can be approximated as either Log-normal or Gaussian. They used this result to develop a simplified formulation for evaluating design response that can be expressed as follows
∑
Θ
=
Ni
i i i
R
N
R
1
ω84ζi i i
ζ ω
ν
ν
+ + =
1 1
Θ (10)
in which
R
is the design response corresponding to 84% NEP and the total response corresponding to84% NEP obtained after combining individual modal responses conditioned upon a given set of values for the frequencies and damping ratios of uncoupled systems, i.e.,
84
i i
R
ωζi
ω
ζ
i representing the ith
set of modal properties
among N variations considered. Further,
Θ
iis a factor that is dependent upon the coefficient of variationν
forthe design response and i iζ
ω
ν
for the conditional response. For same values of coefficient variations,Θ
i=
1
which further simplifies Eq. (10).
∑
=
8484
1
i i
R
N
R
ωζ (11)The maximum possible error due to the above assumption regarding
Θ
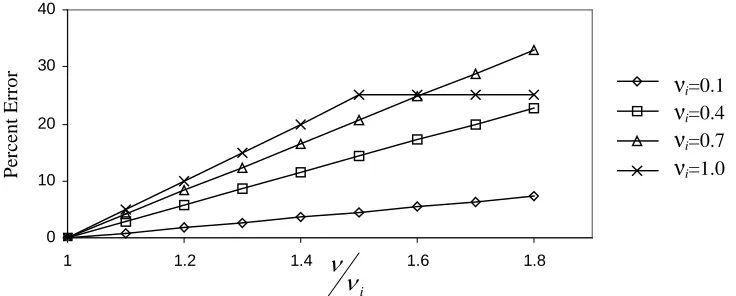
iis shown in Fig 6 for a wide range ofsummarized in Table 2. Fig. 7 compares the secondary system response evaluated by this method with those evaluated earlier by Monte Carlo simulation using multiple time history and response spectrum analyses. As shown in Fig. 7, the design responses obtained from the proposed method are close to those given by time history analyses.
Fig. 6. Error due to AssumptionΘi =1
0 30 60 90 120 150
Time History
Response Spectrum (84%)
Response Spectrum (Proposed)
0 10 20 30 40
1 1.2 1.4 1.6 1.8
i
ν
ν
Fig. 6. Maximum Error in Proposed Method
ν
i=0.1ν
i=0.4ν
i=0.7ν
i=1.0Percent Erro
r
Fig. 7. Response Corresponding to 84% NEP in Monte Carlo Simulation
Force i
n
Secondary Syst
em(kN)
Case IV Case III
Case II Case I
CONCLUSIONS
modal responses need to be evaluated at 84% NEP in systems that have perfectly correlated modes (
ε
12=
1
) and in systems where only a single mode contributes to the particular response quantity of interest. In other cases, characterizing modal responses at 84% NEP would give design response that is excessively higher than its true value. Since the results of first-order reliability method cannot be directly included in a response spectrum method due to computational complexity and inefficiency, a simplified method based on total probability theorem is presented for this purpose. It is shown that the numerical results obtained from the simplified method are close to the true values of design responses.REFERENCES
1. Aradhya, P. and Gupta, A., "Effect of uncertainty in primary system properties on coupled secondary
system seismic response," Proceedings of 13th Engineering Mechanics Conference, ASCE, Baltimore, MD,
June 13-16, 1999.
2. Choi, B. and Gupta, A., “Seismic response of SDOF primary-SDOF secondary system: Effect of
uncertainty in the primary system frequency,” 16th International Conference on Structural Mechanics in
Reactor Technology, Washington, DC, August, 2001.
3. Gupta, A. and Gupta, A.K., “New developments in coupled seismic analysis of equipment and piping,” 13th
International Conference on Structural Mechanics in Reactor Technology, Porto Alegre, Brazil, August, 1994.
4. Gupta, A. and Gupta, A.K., “Application of new developments in coupled seismic analysis of piping
systems,” 13th International Conference on Structural Mechanics in Reactor Technology, Porto Alegre,
Brazil, August, 1994.
5. Gupta, A. K., Hassan, T. and Gupta, A., “Correlation coefficients for modal response combination of
non-classically damped systems,” Nuclear Engineering and Design, Vol. 165, 1996, pp. 67-80.
6. Hasofer, A. M. and Lind, N. C., “Exact and invariant second moment code format,” Journal of Engineering
Mechanics, ASCE, Vol. 100, 1984, pp. 111-121.
7. Reed, J.W., Kennedy, R.P., Lashkari, B., and Manuel, L., "In-Structure Response For Calculating
Equipment Capacities In SMA And SPRA Reviews," Proceedings of 5th Symposium on Current Issues
Related to Nuclear Power Plant Structures, Equipment and Piping, Lake Buena Vista, Florida, December, 1994.