RESPONSE OF UNDERGROUND STRUCTURES SUBJECT TO
BLAST LOADING UNDER GROUND
Mrigendra Nath Ray1, Dr. Nishikant Vaidya, P.E.2, Dr. Umesh Dayal3
1 Consultant to Nuclear Power Projects; Former Chief Engineer (Civil), Kudankulam Nuclear Power
Plant, Nuclear Power Corporation India Ltd. ([email protected])
2 Vice President, Paul C. Rizzo Associates, Inc., Pittsburgh, PA, USA 3 Technical Director, Paul C. Rizzo Associates, Inc., Pittsburgh, PA, USA
ABSTRACT
The response of underground structures subjected to blast loading is generally discussed in protective engineering. Usually example structures are box shaped concrete structures, partially or fully buried in soil medium. The loading and response of the underground structure involves different mechanisms as compared to the above-ground structures. The response of an underground structure to a Blast Loading is investigated in this paper, neglecting the effect of structure–soil interaction (SSI). In this paper an attempt is made to use the easily available FEM software STAAD and ANSYS, instead of latest software programs such as LSDYNA/AUTODYN for the Smooth Particle Hydrodynamics (SPH) technique, which is superior in modeling large deformation zone with relatively simple geometry, with the Lagrange finite elements (FE) which are more effective in modeling complex structures. Soil is a continuum of millions of particles assembled in a close proximity with the voids between these particles normally filled with air and/or water. In this paper, two phase soil model is considered consisting of saturated soil in the ratio of 70:30 of solid and water, respectively. Three cases of the FEM Models are considered; in Case-1 soil is considered a 3D solid linear element connected through nodes; in Case-2 soil is considered a 3D element divided into solid and water; and in Case-3 soil is considered a Non-linear 3D Element. Blast Load is applied as a transient load in the form of a nodal load spike for 5 milliseconds and the Dynamic response is calculated for the three cases. Two types of Response are provided in this paper, Displacement and Stresses.
INTRODUCTION
Blast effect on over ground structures has been discussed in industry literature over several decades. Researchers have carried out both model and full scale investigations and analysis to study the blast effects on surface structures, but now terrorist activities are likely to be extended to underground structures as well which necessitate an understanding of the effect of blasting on underground structures such as strategic underground facilities, tunnels and Metros. This paper aims to estimate the response of blasting on underground structures.
Underground structures are surrounded by soil which is an assemblage of individual particles, rather than a continuum, and have various degrees of water saturation. Therefore, the blasting wave will transmit through this medium. A rapid release of energy from a buried explosion causes a sudden rise of pressure or a shock front propagating through a soil medium requiring very accurate prediction of the soil behavior under blast loading. Presently, it is a common practice to estimate the effects of underground blast loading using empirical formulae which are primarily based on field tests (Wang et al. 2004)[5].
As Soil is composed of solid particles with different sizes and shapes that form a skeleton and the voids are filled with water and air, the soil will become saturated if all the voids are filled with water. In the first case of the analysis the soil is assumed as a solid materials and whereas in the second case soil model is conceived by using solids and water elements subjected to similar Blast Pressure Timeload in the cubical null element located in the same mid depth.The response of the blasting are observed and compared in both cases In the third case soil model is conceived wherein soil is assumed to follow Non-linear Drucker-Prager Yield Criteria[2]. Instant Blast Time Load is applied at the similar location within the solid
model of same size and properties.
In the output of these models, Stresses and Displacement on a few selected nodes were compared and the differences in the results are provided.
FINITE ELEMENT MODEL IN THE THREE CASES OF FEM BOUNDARY
Case-1
In this case an 11m long cubical shaped structure is assumed which is covered with 1m thick
solid soil particles. At the mid depth and mid location from both horizontal axes, one cube null element was modeled. The Buried Structure is modeled as a plate element of 25cm thickness, assuming a Rectangular Rim at a height of 1m below the top and 2m above the null element. The outer boundary of this soil model was constrained to only one direction, i.e., in the direction of the axis while keeping the other two linear directions and three rotational directions free. Only the top plane of the FEM Boundary was kept free in all six directions.
The STAAD program’s version 8i is used which can model only linear soil failure mechanism. Additionally, the Blast Load-Pressure was assumed to be effective with the value calculated as per the JWL Equation of State (EOS) by expansion of a typical detonator. The EOS for the detonator element
TNT/C4 can be modeled as JWL EOS as provided below in Equation (1) and in Table1.
(1)
Table 1: Modeling of the Blasting Force
Though the calculated CJ Pressure value comes to 25.3E+06, we will continue with 21E+06 KN/m2 detonation pressure applied in all eight nodes of the null solid element in all three outward directions. On each wall (1m x 1m) of the null element, CJ Pressure 21E+06 kn/m2 will be distributed on all four nodes thereby putting 5.25E+06 KN force at time t=1.0 ms. As we are not generating a Pressure Time History due to blast wave within soil, we consider peak pressure applied on the nodes and continuing for a time span of 5 milliseconds to reach a value 0, and we continue with this time load for a time span of 5 milliseconds. We will analyze the Model to get the response on various soil nodes and a representative 25cm-thick concrete, rectangular, open rim of a plate element which is placed within a soil mass at a depth of 1m from the top.
Case- 2
The second Model is also generated from STAAD Pro assuming a two-phase soil model. The two-phase soil model is derived from the three-phase soil model of Henrych (1979)[3], provided in Figure
1, assuming zero air void as a saturated soil condition. The saturated soil is assumed to consist of 70%
solidand 30% water. The outer size of the soil model has been kept the same as that of Case-1. However,
the solid element of Case-1 was split up into a solid element at 70cm x 70cm x 70cm and below one water element of 30cm x 30cm x 30cm. Other boundary conditions were kept the same as that of Case-1. Similarly, the Blast Load-Time History had been altered from that of Case-1 due to the reasoning that 21xE+06 Kpa peak pressure will now be applied on the nodes of a soil element sized 70cm x 70cm x 70cm. So on each face of the cube, the 2.58E+06KN load will be active instead of 5.25E+06KN. The analysis was performed using this time load for a time span of 5 milliseconds to obtain the response on various soil nodes and a representative 25cm-thick concrete, rectangular, open rim of a plate element which is placed within a soil mass at a depth of 1m from the top.
Case-3
The third Model was developed using ANSYS with a soil model composed of solid elements with Non-linear Drucker-Prager Failure Criteria. To maintain similarity with the first two models, this model size was kept similar and the element size was kept at 1m x 1m. Here also one null element was created at mid depth and at mid position with respect to both horizontal axes. The size and location of the buried structure was also kept the same as that of Case-1. Using ANSYS we can input Blast Force-Time History as 5.25E+06Kn/m2 on the eight nodes of the null element.
The Boundary Condition had been kept the same to that of other two cases. We continue with this Time load for a time span of 5 milliseconds and analyze the Model to get the response on a representative 25cm-thick concrete, rectangular, open rim of a plate element which is placed within a soil mass at a depth of 1m from the top.
FAILURE MECHANISM SOIL MASS UNDER BLAST LOADING
The classical Mohr-Coulomb model is often used to describe soil behavior. In one dimension, the yield “surface” of the Mohr-Coulomb model is defined by a linear line between shear stress T and normal stress S which is written in Equation (2) as follows:
f = T - (c – StanФ) =0 Where c and Ф are cohesion and angle of internal friction. (2)
In 3D, the yield surface is further expressed as Equations (3) and (4) as follows:
f = I
1SinФ+√J
2Sin(θ+ )+√(J
2/3) Cos(θ+ )SinФ –cCosФ = 0
(3)
Where I1 = First Invariant of Stress Tensor, J2 = Second Invariant of deviatric Stress Tensor, and θ
= Angle of Similarity, and defined by the following Equation (4):
) J
3Cos 3θ = ---x---
(4)2 J
2 3/2Where I1= s1+ s2+ s3. Where s1, s2 and s3 are the Principal stresses.
J2 =1/6 [(s1- s2)2 + (s2- s3)2+(s3- s1)2], J3 is = (s1-1/3I1)(s2-1/3I1)(s3-1/3I1).
For carrying out a study on the example problem, soil data was taken from Brinkgreve (2004) as shown in Table 2.
TIME HISTORY ANALYSIS OF THE CASE-1 MODEL
Normal Shear
Solid L/C Sxx Syy Szz Sxy Syz Szx Max Szz 1285 3 11.52 4.05 6.95 0 0 0
By plotting the Mohr Circle for solid element 1285 with values as per the above results and a
Mohr-Coulomb failure line with C = 20Kn/m2 at
θ
=22.7deg. The failure line meets the Mohr Circle at aShear Strength value of 3.70N/mm2 and Normal Strength of 8N/mm2 which exceeds the Shear Stress in that solid element with adequate margin. Incidentally, the location of element 1285 is actually near to Concrete Open Rim Plate element. The Normal Stress exceeded Normal Strength, which indicates a failure of local soil element.
Taking another case of Solid Element 1280 which is at a location near to theBoundary element, we get the output from STAAD as outlined below.
Normal Shear
Solid L/C Sxx Syy Szz Sxy Syz Szx
Max Sxx 1280 3 -13.92 -3.18 -5.716 1.04 3 0
By plotting the Mohr Circle for solid element 1280 with Sxx, Syy and Szz values as per the above
result and a Mohr Coulomb failure line with C = 20Kn/m2 at
θ
=22.7deg. The failure line meets the MohrCircle at a Shear Strength value of 4.7N/mm2 and a Normal Stress of -11.5 N/mm2, which exceeds the Shear Stress in that solid element by a good margin. Here also the Normal Stress exceeded Normal Strength, indicating a failure of local soil element.
Taking another critical case of Solid Element 1046 which is located at the third level from the top and on the right side of the RCC Box, we get the output from STAAD as outlined below.
Normal Shear
Solid L/C Sxx Syy Szz Sxy Syz Szx
Max Sxy 1046 3 0.683 -2.228 0.660 -7.661 -0.007 -0.005
By plotting the Mohr Circle for solid element 1046 with Sxx, Syy and Szz values as per the above
result and a Mohr Coulomb failure line with C = 20Kn/m2 at
θ
=22.7deg. The failure line meets the MohrCircle at a Shear Strength value of -2.9N/mm2 and a Normal Strength of -7.0 N/mm2 which is less than the Shear Stress of -4.61 Mpa and the Normal Stress of -8.57 Mpa in that solid element, thereby indicating a local failure of soil.
TIME HISTORY ANALYSIS OF CASE-2 MODEL
The FEM model in Case-2 was conceived from a three-phase Kandaur’s conceptual model originally proposed by Henrych (1979)[3] for saturated soil. This concept is explained in a Ph.D. research
thesis by Jichong An, (University of Nebraska)[4]. The following quote from this thesis (para 3.3) provides
a good explanation for this model:
“In a saturated soil the salts on the grain contacts are dissolved and the bonds get weakened. Under a rapid dynamic loading, the water and air have a higher resistance than the contact bonds of the skeleton grain. In soils, two deformation mechanisms exist:
b) the deformation of all the soil phases, determined by their volume compression.
When the soil is being compressed, both mechanisms are always acting simultaneously. At certain phases of the loading process, however, one of the mechanisms predominates to such a degree that the other may be neglected.
The deformation and resistance of the soil are determined by the dominating second mechanism, particularly by the water and air deformation; the solid phase becomes effective only at high pressures (hundreds and thousands of kp/cm2). With fast dynamic deformation the water and air cannot escape from the cavities through the spaces between the blocks; with a slow static deformation the water and air are forced through the spaces into less loaded surroundings and the dominant resistance is offered by the bonds between blocks and by the blocks themselves.”
The author has further simplified by assuming a saturated condition with 30% water and 70% solid contents. In Figure 2 below, the Grid is representing the individual element. The brown color represents solid, blue as water, and white as air. At the center, the yellow portion represents the detonator. Since the author in this Thesis used the LS Dyna program for analysis, the program took care of the generation of Pressure Time History in the soil mass based on change of volume and density of both phases of solid and water at every instant of time. Whereas the present authors have applied nodal force time history due to Underground-Blast using the common Jones-Wilkins-Lee EOS for the detonator element, Luccioni and Ambrosoni et al.[5] has presented details of evaluation of this high explosive
pressure at the instant of explosion.
Solid L/C Sxx Syy Szz Sxy Syz Szx
Max SXX 1116 2 TIME HISTORY LOAD 9.893 1.883 12.274 0.006 0.038 0.355
Max SYY 1096 2 TIME HISTORY LOAD 4.064 10.725 3.309 -3.118 -0.25 0.240
Max SZZ 1115 2 TIME HISTORY LOAD 9.788 1.573 12.36 0.028 0.08 0.491
Max Sxy 1113 2 TIME HISTORY LOAD -2.828 1.742 5.175 7.096 -0.116 2.250
Max Syz 827 2 TIME HISTORY LOAD 6.517 6.428 6.771 -0.008 11.30 0.417
Max Szx 1401 2 TIME HISTORY LOAD 5.214 5.901 6.276 2.670 -6.22 3.948
The Output shows a Considerable reduction is the stress field using this type of model.
TIME HISTORY ANALYSIS OF MODEL IN CASE-3 (NON-LINEAR TRANSIANT)
As explainedearlier in this paper , the third model was generated in ANSYS, in which the soil was considered to behave as Non-linear with large deformation, the Stress Stiffening effect on the failure criteria considered was Drucker-Prager, and the soil parameter was kept the same as that of earlier cases. A Transient Non-linear Analysis was carried out for a total time span of 5 milliseconds. The Stress Resultant (DIR-X) were plotted at the last sub-step which shows much less deformation and Stresses in the solid elements above the Concrete Rim than that of Cases-1 and 2. The obvious reason is that this method is Non-linear and has considered material damping in the soil where as in Cases-1 and 2 only modal damping of 10% was considered.
The Yield Criteria as per Drucker-Prager is expressed in Equations (5) and (6) below.
f = I1SinФ+√J2Sin(θ+ )-√(J2/3) Cos(θ+ )SinФ –cCosФ = 0 (5)
) J3
Cos 3θ = ---x--- = -1.0 = Cos180 deg , θ =60deg (6)
2 J2 3/2
By inputting the output of a particular element very close to the detonator location we get the following:
I1 =7705+4257+7705 =19667Kn/m2 J2 =(1/6)[2(7705-4257)2] =3962901 Kn/m2
J3 =(7705-(1/3)x19667)x(4250-(1/3)x19667)x (7705-(1/3)x19667) =-3.04E+09 Ф =22.7deg
J23/2 =(3962901)3/2=7.89E+09.
SinФ = 0.386 (1/3)xI1x SinФ =(1/3)x19667x0.386 =2530.5 θ =60deg Sin(θ+ ) =0.866 Cos(θ+ )
=-0.5 CosФ =0.922 c=20kn/m2 √J2 =1990.70 √(J2/3) =1149.33
f= I1SinФ+√J2Sin(θ+ )+√(J2/3) Cos(θ+ )SinФ –cCosФ.
=2530.5. +1990.7x0.87+ 1149.33x(-0.5)x0.386-20x0.922 =4014.38 kn/m2 Highly Plastic State.
RESPONSE OF THE BURIED STRUCTURE UNDER BLAST LOADING
Cases-1 and -2 are soil models wherein the soil was considered to behave linearly. In Case-1 where the void was not modeled the stresses in the Plate Element became quite high, indicating a failure of concrete and increase of Normal Stress in the soil over Normal Strength, indicating soil node in tension. In Case-1 the peak displacement also was quite high at a particular node. In Case-2 at the same location, the displacement is about 8% of the first case.
If we examine the model, we can see that the High Stiffness of pore water that was considered to simulate the Rheological behavior of pore water in such an infinite soil mass in undrained conditions has led to a reduction in stresses and displacements. In addition, 10% modal damping was also considered.
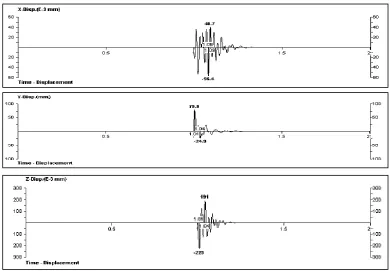
In Case-3, where analysis was done in Non-linear Mode, the Displacement shown in Figure 3 at
Figure 5. Response of Displacement T.History at Node attached to Rectangular Concrete Rim in Case-2.
CONCLUSION
Comparing these three methods, it is concluded that the Blast Load Analysis for Buried Structure can better be analyzed by Non-linear methods such as Drucker-Prager. The main reason is that soil is not an elastic material, therefore cannot transmit the shock wave through a solid element through node to node connection. Therefore, the response in Case-1 shows comparatively very high value compared to Case-2 and Case-3.
In Case-2, where moisture was modeled as a solid, the deformation of an undrained soil mass is related to the stiffness of both the pore water and the solids. Therefore the FEM model conceived in Case-2 correctly transmits the Blast wave through water and solid elements, and we can observe that the response is much less than in Case-1 and appears to be rational. However the research findings of Jichong An[4] propose a complete analytical method for generating the Blast Pressure Time History inside soil
mass and its propagation with time till it dies down.
In Case-3, the Authors have modeled the soil as Isotropic Non-linear Material with Drucker-Prager Yield Criteria. This soil model has been developed similar to the model of Case-1 but with difference of Material Non-linearity. In addition, the cohesion and angle of internal friction of soil was taken from Table 2. The response in stress in the center of the soil element is shown in Figure 2 and the
same for displacement is presented in Figure 3. The output of Stresses and Displacement shown in these
figures show that unlike Case-1, the transmission of Blast Wave is restricted to one or two grids above the
Null element. Here when we derive Equations (3) and (4) based on DP criteria we get to know the state
of Yielding existing in Solid Model due to Blasting.
REFERENCES
[1] Bibiana, M., Luccioni and Ricardo, D. Ambrosini. (2008) “Evaluating the Effect of Underground
Explosions on Structures,” Mecanica Computacional, Argentina, vol xxvii.
[2] Drucker D.C., Prager W. (1952) “Soil Mechanics and Plastic Analysis or Limit Design,” Q Appl
Math, 10(2): 157–64.
[3] Henrych, J. (1979) “The Dynamic of Explosions and its Use,” Amsterdam, Elsevier.
[4] Jichong, An. “Soil Behavior under Blast Loading,” University of Nebraska.
[5] Wang, Z., Hao, H., and Lu, Y. (2004) “A Three-Phase Soil Model for Simulating Stress Wave