Optimal Power Flow of the Multi-type FACTS
Controllers using Genetic Algorithm
M.Bindu Priya1, M.Srijan Kumar2
Assistant Professor, Dept of E.E.E , GITAM UNIVERSITY, Hyderabad, Telangana, India1 PG Student [PS&A], Dept of E.E.E, GITAM UNIVERSITY, Hyderabad, Telangana, India2
ABSTRACT:In the present power system we mostly concentrate on reduction of losses in the transmission lines. For detection of faults we mainly use FACTS devices to reduce the losses in the transmission line. The role of the FACTS devices is to control the power flow. The ultimate goal is to improve the stability of power system as well as to reduce the generation cost, transmission loss by improving the voltage profile and by introducing FACTS devices at the effective region. FACTS devices are solid state converters that have the capability of control of various electrical parameters in the transmission circuits. These are the FACTS devices like TCSC, TCPAR and SVC are used for the control of power. By using genetic algorithm technique we control the power flow by adding FACTS devices at the most effective region in the transmission line. Genetic algorithm is a parallel and global search technique which generates solutions to optimize problems using natural evaluation.
KEYWORDS: FACTS devices, Genetic Algorithm (GA), Optimal Power Flow (OPF), Improved load ability, Load Flow.
.
I.INTRODUCTION
In recent years, deregulation of electricity has emerged for its huge demand. Due to the deregulation of the electricity market, study regarding this matter has become imperative. Various initiatives are taken to overcome that, but utilization of FACTS device attracts everyone’s attention. FACTS devices are being played vital role for better utilization of the existing power system with the increased demanded [1],[2].On the other hand, transmission and distribution orientation has become more severe due to the lack of proper arrangement.
The major power loss occurs for system loss which is increasing day by day around the world and has emerged as a challenge for the developing countries to run with limited resources. To minimize this transmission power losses and ensure optimal power flow, FACTS is introduced in power system. Different parameters and variables of the transmission line such as line impedance, terminal voltages and voltage angle can be controlled by FACTS devices in a fast and effective way [3].
The need for more efficient electricity systems management has given rise to innovative Technologies in power generation and transmission. The combined cycle power station Is a good example of a new development in power generation and flexible AC transmission systems, FACTS as they are generally known, are new devices that improve transmissionsystems. Worldwide transmission systems are undergoing continuous changes and restructuring. They are becoming more heavily loaded and are being operated in ways not originally envisioned. Transmission systems must be flexible to react to more diverse generation and load patterns. In addition, the economical utilization of transmission system assets is of vital importance to enable utilities in industrialized countries to remain competitive and to survive. In developing countries, the optimized use of transmission systems investments is also important to support industry, create employment and utilize efficiently scarce economic resources.
Various types of FACTS devices such as Thyristor Controlled Series Compensations (TCSC), Thyristor controlled phase angle Regulators (TCPR), Unified Power Flow Controllers (UPFC) and Static Var Compensator (SVC) etc, are used to control the power flow in the network. These increase the flow in heavily loaded lines, there by resulting in increase load ability, lowering system losses, improved stability of network and reduced cost of production [4]. Although FACTS device has an great impact on power system for optimal power flow, but it requires optimal allocation for proper stabilization and localization. For that reason, many researches were made on the optimal location of FACTS devices with many different ways. We use GA technique to search the optimal localization
The objective of this paper is to develop an algorithm to simultaneously find the real power allocation of generators and to find the type, rating and best location of FACTS controllers such that overall system cost, which includes the generation cost of power plants and investment cost of FACTS are minimized using genetic algorithm &power flow analysis. The Genetic Algorithm tool (GA-tool) of MATLAB is implied to solve the problem.
II .RELATED WORK
Power flow calculations are performed in power systems for planning, operational planning, and operation/control. Flexible AC transmission system (FACTS) controllers are able to change the network parameters in a fast and effective way in order to achieve better system performance. These controllers are used for enhancing dynamic performance of power systems in terms of voltage/angle stability while improving the power transfer capability and voltage profile in steady state. The objective of the paper is to develop a power flow model for a power system with multiple FACTS– controllers and a procedure using Genetic Algorithm and this total test is performed on IEEE30 bus system.
III. STATIC MODEL OF FACT CONTROLLERS
A. FACTS Devices
In this paper typical FACTS devices have been considered, Different types of FACTS devices are used for power transmission and distribution such as SVC (Static VarCompensators), Fixed Series Capacitors (SC), Thyristor-ControlledSeriesCompensator(TCSC),ThyristorControlledPhaseAngleRegulator(TCPAR),UnifiedPowerFlowControlle r(UPFC),STATCOMetc.Powerquality,availability,systemstabilitytransmission capability can be improved using FACTS as well as it minimizes transmission and distribution losses. Here just TCSC,TCPAR and SVC are used for the optimal power flow analysis. The power flow through the transmission line − is a function of line impedance the voltage magnitude , and the phase angle between the sending and receiving end voltages −
= −
B. Choice and Modelling
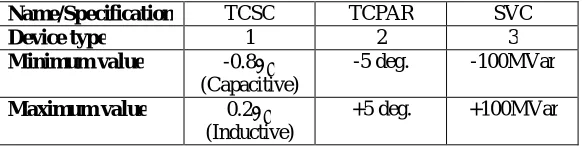
Three different types of FACTS devices have been chosen for the controlling of power flow. These are TCSC,TCPAR ,and SVC. TCSC is used to modify the reactance of the transmission line . For controlling the phase angle the TCPAR is used. The SVC is used to absorb or inject reactive power which is connected in shunt with the line. Both the TCSC and TCPAR are connected in series with the line. Each FACTS device is represented with fixed discrete values for mathematical analysis, where it has two possible characteristics, capacitive or inductive accordingly in order to decrease or increase the line reactance, phase angle, reactive power in line using TCSC, TCPAR and SVC respectively. Maximum and minimum value of each FACTS device is fixed and type of each device is also specified. TABLE I represents the specification of FACTS devices. Fig. shows the connection model of FACTS devices.
Table Specification of FACTS Devices
Name/Specification TCSC TCPAR SVC
Device type 1 2 3
Minimum value -0.8
(Capacitive)
-5 deg. -100MVar
Maximum value 0.2
(Inductive)
Connection models of FACTS devices. (a) TCSC (b) TCPAR (c)SVC
The real value of the FACTS device [1] is calculated with their location according to the model of the FACTS by
= + ( − )
The detailed model of FACTS devices are discussed below: 1)Static Var Compensator (SVC):
The SVC may have two characters: inductive or capacitive. In the first case it absorbs reactive power while in the second one the reactive power is injected. The SVC is modelled with two ideal switched elements in parallel: a capacitance and an inductance.
It may take values characterized by the reactive power injected or absorbed at the voltage of 1p.u.The values are between - 100 MVar and +100 MVar.
Schematic diagram of SVC
Only one FACTS device per line may be allowed. For the TCSC, TCPST and TCVR, the devices are directly integrated into the model of the line. They are inserted in series with the resistance and the reactance of the line. For the SVC, the line is split into two equal parts and the device is inserted in the middle.
2) Thyristor Controlled Series compensator (TCSC):
They are an extension of conventional series capacitors through adding a thyristor-controlled reactor. Placing a controlled reactor in parallel with a series capacitor enables a continuous and rapidly variable series compensation system.
The main benefits of TCSCs are increased energy transfer, dampening of power oscillations, dampening of sub synchronous resonance’s, and control of line power flow.
C
L
Line
Schematic diagram of TCSC Let the capacitive reactance of capacitor bank
= 1
And reactance of Thyristor controlled shunts are is given by
=
( ) =
−2 −sin( )
=− ( )
( )−
Where
= reactance of the inductor. = firing angle of Thyristor
( )=reactance of the thyristor controlled inductor arm. = Supply frequency.
From above eqn. we see that,
If ( )> , then TCSC shows capacitive characteristics If ( )< , then TCSC shows inductive characteristics
If ( )= , then the impedance of the TCSC will be infinite and in this region operation of TCSC is not allowed. The
TCSC must operate either in capacitive region or in inductive region. Normally it operates in capacitive region.
3) Thyristor controlled phase angle regulator (TCPAR):
Flexible AC Transmission System (FACTS) controllers such as TCPAR play an important role in increasing load ability of the existing system and controlling the congestion in the network.
IV. GENETIC ALGORITHM
A. GA overview
Genetic algorithms operate on a population of individuals. Each individual is a potential solution to a given problem and is typically encoded as a fixed-length binary string (other representations have also been used, including character-based and real-valued encoding, etc.), which is an analogy with an actual chromosome. After an initial population is randomly or heuristically generated, the algorithm evolves the population through sequential and iterative application of three operators: selection, crossover and mutation. A new generation is formed at the end of each iteration. For large-scale optimization problems, the initial population can incorporate prior knowledge about solutions. This procedure should not drastically restrict the population diversity, otherwise premature convergence could occur. Typical population sizes vary between 30 and 200. The population size is usually set as a function of the chromosome length. The execution of GA iteration is basically a two-stage process. It starts with the current population. Selection is applied to create an intermediate population (mating pool). Then, crossover and mutation are applied to the intermediate population to create the next generation of potential solutions. Although a lot of emphasis has been placed on the three above-mentioned operators, the coding scheme and the fitness function are the most important aspects of any GA, because they are problem dependent. The main objective of the optimization is to find the best location for a given number of FACTS devices in the power system based on defined criterion. Three parameters are
utilized for encoding individual these are the location, type of device and rated value. Each individual is represented by number of three strings, where is the number of FACTS devices installed in the power system. TABLE2 shows the individual format. Individual is made in three stages, first a setoff branches are randomly selected and is put in the first-string. In the second string type is also randomly selected. In the third string device setting value is randomly selected. This approach is repeated for obtaining desired population. Then the entire population is computed with respect to objective function which is the measure of obtaining best location for the FACTS device.
TABLE.2. INDIVIDUAL FORMAT FOR GA Location FACTS Type Normalized value
2 1 0.3
5 3 0.6
11 1 0.2
22 2 0.9
26 1 0.5
18 3 0.1
New individual is generated based on the results obtained from the old generation. For this 1st GA operator selection is used. In this case Proportional Roulette Wheel Selection technique is used. In proportional roulette wheel, individuals are selected with a probability that is directly proportional to their fitness values i.e. an individual selection corresponds to apportion of a roulette wheel. Let be the fitness value and be the selection probability, then
= ∑
Based on the selection probability Pi, individual is randomly selected by roulette wheel. After that 2nd GA uniform crossover is applied [5]. Uniform crossover with some probability knows as the mixing ratio. The crossover operator allows the parent chromosomes to be mixed at the gene level. Consider the two parents selected for crossover. If the mixing ratio is about 0.5, then half of the genes in the offspring will come from parent 1and rest from parent 2. Then boundary mutation is applied.
Flow chart of the optimization strategy
V. OPTIMIZATION AND RESULT
Objective function
The aim of the optimization is to find the best locations for the given number of FACTS devices within the defined constrains for the best utilization of the existing system. We want to minimize the power generation costs and reduce the transmission and distribution losses. So the objective function is based on the minimization of cost which can be expressed as
= ( ) + ( ) + ( )
Where, , ( ), ( ), ( ) are the total cost of objective function, average installation costs of FACTS devices at each observation per hour, total generation costs and cost of power transmission losses respectively.
The cost functions for SVC, TCSC and TCPAR are developed on the basis of the Siemens AG Database The cost function for SVC and TCSC are:
= 0.0003 −0.3051 + 127.38(US$/ K var)
= 0.001 −0.713 + 153.75(US$/ K var)
Where S is the operating range of the FACTS controllers in kVar. Depending on the instalment cost, the cost function of TCPAR can be expressed as
= 140.5(US$/ K var)
( ) = ( )
(8760 × 3)(US$/Hour)
The generation cost function is represented by a quadratic polynomial as follows:
(PG)=α0+α1PG+α2(PG)2
Where PG is the output of the generator (MW), andα0,α1
andα2are cost coefficients.
The cost function for power loss is represented as
(PL)= PL*Eloss*dt
N
i=1
Where, N, PL, Eloss and dt are denotes the number of used FACTS devices, transmission losses, cost of the losses in per hour and FACTS devices utilization time respectively.
Now the fitness function for the genetic algorithm is found as
= 1
IEEE 30 bus system
IEEE 30 bus system contains 6 generator buses, 24 load buses and 41 transmission lines. The generated outputs are 70MW 5MW 35MW 25MW 40MW respectively.
Voltage (v)
1.0500 1.0000 1.0000 1.0000 1.0000 1.0000 1.0338 1.0000 1.0883 1.0000 1.0000
1.0000 23.0000 1.0000 1.0000 1.0000 1.0000 1.0000 1.0000 1.0000 1.0000 1.0058 1.0000 1.0000 1.0000 1.0000 1.0000 1.0913 1.0000 1.0000 1.0000
Voltage (v1)
Voltage (v2)
1.0338 1.0000 1.0000 1.0000 1.0000 1.0000 1.0000 1.0000 1.0000 1.0000 1.0000 1.0000 1.0000 1.0000 1.0000 1.0000 1.0913 1.0000 1.0000 1.0000 1.0000 1.0000 1.0000 1.0000 1.0000 1.0000 1.0000 1.0000 1.0058 23.0000 1.0883 1.0000 1.0000 1.0000 1.0000 1.0000 1.0000 1.0000 1.0000 1.0000 1.0000
Real power
12.4687 -23.9321 4.2981 5.4203 0.4706 3.7350 -1.5916 4.3923 -5.8844 186.9266 -5.2044 -1.1044 3.3250 -1.2046 2.4485 3.5151 87.6532 -4.1822 10.4079 -1.4942 -1.4563 26.2208 -23.1978 6.3857 4.0300 6.4194 -0.9022 -0.5126 4.9118 98.8554 4.6213 5.8249 35.4911 -2.1859 -15.2649 -5.0397 1.6079 2.0921 8.3411 3.6547 2.2576
Reactive power
-94.9340 99.9997 100.0000 100.0000 100.0000 -94.3612 99.9997 100.0000 100.0000 100.0000 -92.2085 99.9999 100.0000 100.0000 100.0000 -90.3670 99.9999 100.0000 100.0000 100.0000 100.0000 99.9999 100.0000 100.0000 100.0000 4.4584 100.0000 100.0000 100.0000 100.0000 99.9997 100.0000 99.9999 100.0000 100.0000 100.0000 100.0000 99.9999 100.0000 100.0000 100.0000 100.0000 99.9999 100.0000 100.0000 100.0000 100.0000 99.9999 100.0000 100.0000 99.9994 100.0000 99.9999 100.0000 100.0000 99.9996 100.0000 99.9999 100.0000 100.0000 99.9996 100.0000 99.9999 100.0000 100.0000 99.9996 100.0000 100.0000 100.0000 100.0000 99.9995 100.0000 99.9999 100.0000 100.0000 100.0000 100.0000 100.0000 100.0000 100.0000 100.0000 100.0000 100.0000 100.0000 100.0000 100.0000 100.0000 100.0000 100.0000 100.0000 99.9998 99.9999 100.0000 100.0000 100.0000 99.9997 100.0000 100.0000 100.0000 100.0000
Theta
-2.0290 -2.0290 -2.0290 -2.0290 -2.0290 -2.0290 -2.0290 -2.0290 -2.0290 -2.0290 -2.0290 -2.0290 -2.0290 -2.0290 -2.0290 -2.0290 -2.0290 -2.0290 -2.0290 -2.0290 -2.0290 -2.0290 -2.0290 -2.0290 -2.0290 -2.0290 -2.0290 -2.0290 -2.0290 -2.0290 -2.0290 -2.0290 -2.0290 -2.0290 -2.0290 -2.0290 -2.0290 -2.0290 -2.0290 -2.0290
The generators outputs are 70MW, 70MW, 5MW, 35MW, 25MW, 40MW respectively. Xbest=0.4000 ,Teta best=-2.0290, Q best=100.0000
Fitness Function Curve With Generating
Optimization Of Minimum Cost CT Using Genetic Algorithm
VI. CONCLUSION
In this paper a genetic algorithm based approach is proposed to determine the suitable type of FACTS controllers, its optimal location and rating of the devices in power systems and also to simultaneously determine the active power generation for different loading condition .The overall system cost which includes generation cost of power plants and the investment cost of FACT controllers are employed to evaluate the system performance. The proposed algorithm is an effective and practical method for the allocation of FACTS controllers. We have presented a genetic algorithm to optimally locate multi-type FACTS devices in a power system. Three types of controllers were chosen and modeled for steady-state studies. Optimizations were performed on three parameters: the locations of the devices, their types, and their values. The system load ability was employed as measure of power system performance. The results are shown for IEEE 30-bus system.
0 10 20 30 40 50 60 70 80 90 100 2.5301 2.5301 2.5301 2.5301 2.5301 2.5301 2.5301x 10
-4 FITNESS FUNCTION CURVE WITH GENERATIONS
Number of Iterations
C o s t (R s )
0 20 40 60 80 100
3952.3728 3952.3729 3952.3729 3952.373 3952.373
Optimization of Minimum Cost Ct Using GENETIC ALGORITHM
Number of Iterations
REFERENCES
[1] S. Gerbex, R. Cherkaoui and A. J. Germond, "Optimal location of multi-type FACTS devices in a power system by means of genetic algorithms,"
IEEE Trans. Power Systems, vol. 16, pp. 537-544, August. 2001.
[2] K. Ghoshand and V. C.Ramesh, “An option model for electric power markets,” Electrical Power and Energy Systems, vol.19, no.2, 1997 [3] F. D. Galiana, K. Almeida, M. Toussaint, J. Griffin and D. Atanackovic, “Assessment and control of the impact of FACTS devices on power system performance" IEEE Trans. Power Systems, vol. 11, no. 4, Nov.1996.
[4] D. J. Gotham and G. T. Heydt, “Power flow control and power flow Studies for systems with FACTS devices,” IEEETrans. Power
Systems,vol.13, no.1, Feb.1998.
[5]R.C.Chakrabarty.FundamentalofGeneticAlgorithmsAIcourse,Lecture39[Online],Availale:http//www.myreaders.info/html/artificial_intelligence.ht ml.
[6] D. J. Gotham and G. T. Heydt, “Power flow control and power flow studies for systems with FACTS devices,” IEEE Trans. Power Systems, vol. 13, no. 1, Feb. 1998.
[7] J. Griffin, D. Atanackovic, and F. D. Galiana, “A study of the impact of FACTS on the secure-economic operation of power systems,” in 12th
Power Systems Computation Conference, Dresden, Aug. 19–23, 1996.
[8] F. D. Galiana, K. Almeida, M. Toussaint, J. Griffin, and D. Atanackovic, “Assessment and control of the impact of FACTS devices on power system performance,” IEEE Trans. Power Systems, vol. 11, no. 4, Nov. 1996.
[9] S. Gerbex, R. Cherkaoui, and A. J. Germond, “Optimal location of FACTS devices in a power system using genetic algorithms,” in Proceedings
of the 13th Power Systems Computation Conference, 1999, pp. 1252–1259. 544 IEEE TRANSACTIONS ON POWER SYSTEMS, VOL. 16, NO. 3,
AUGUST 2001
[10] S. M. Sait and H. Youssef, Iterative Computer Algorithms with Application
in Engineering: Solving Combinatorial Optimization Problems: IEEE Computer Society, 1999.
[11] D. E. Goldberg, Genetic Algorithms in Search Optimization and Machine Learning: Addison-Wesley Publishing Company, Inc., 1989. [12] F. Glover, “Tabu Search,” University of Colorado, Boulder, CAAI Report 88-3, 1988.