Western University Western University
Scholarship@Western
Scholarship@Western
Electronic Thesis and Dissertation Repository
12-5-2013 12:00 AM
Electrochemical and Surface Compositional Studies on Uranium
Electrochemical and Surface Compositional Studies on Uranium
Dioxide
Dioxide
Mayuri Razdan
The University of Western Ontario
Supervisor
Dr. David W. Shoesmith
The University of Western Ontario Graduate Program in Chemistry
A thesis submitted in partial fulfillment of the requirements for the degree in Doctor of Philosophy
© Mayuri Razdan 2013
Follow this and additional works at: https://ir.lib.uwo.ca/etd
Part of the Analytical Chemistry Commons, and the Ceramic Materials Commons
Recommended Citation Recommended Citation
Razdan, Mayuri, "Electrochemical and Surface Compositional Studies on Uranium Dioxide" (2013). Electronic Thesis and Dissertation Repository. 1740.
https://ir.lib.uwo.ca/etd/1740
This Dissertation/Thesis is brought to you for free and open access by Scholarship@Western. It has been accepted for inclusion in Electronic Thesis and Dissertation Repository by an authorized administrator of
Electrochemical and Surface Compositional Studies on Uranium
Dioxide
(Thesis format: Integrated Article)
by
Mayuri Razdan
Graduate Program in
Chemistry
A thesis submitted in partial fulfillment of the requirements for the degree of
Doctor of Philosophy
The School of Graduate and Postdoctoral Studies The University of Western Ontario
London, Ontario, Canada
© Mayuri Razdan 2013
ABSTRACT
This thesis describes electrochemical and surface compositional studies
performed on a number of simulated nuclear fuel (SIMFUEL) materials under conditions
relevant to permanent disposal of spent nuclear fuel in a geologic repository. This is
important since a number of critical issues have been identified in the event of waste
container failure. The research performed was mainly focused in three areas: (i) the
influence of low pH on the surface chemistry of UO2, since acidity could develop within
corrosion product deposits and flaws in the fuel; (ii) the combined influence of dissolved
H2 and H2O2 (H2 and H2O2 are key reducing and oxidizing agents) in the presence of
HCO32-/ CO32- (the key ground water species) on the fuel corrosion process (iii) the
influence of rare earth (REIII) fission product doping on the fuel corrosion process (since
matrix doping process with REIII influences the fuel bulk properties, it is expected to
influence both anodic and cathodic kinetics under natural corrosion conditions).
The influence of H2O2 on 1.5 at% SIMFUEL in acidic (pH 1-4) conditions was
studied voltammetrically using a rotating disk electrode (RDE), X-ray photoelectron
spectroscopy (XPS) and scanning electron microscopy (SEM) to determine the
composition and morphology of the oxidized UO2 surface. The H2O2 reduction
mechanism is shown to occur on either a UV-containing surface layer of composition
UIV1−2xUV2xO2+x or on an adsorbed UV surface intermediate, depending on the surface
composition which is determined by solution pH and H2O2 concentration. The
UIV1−2xUV2xO2+x catalytic surface lattice layer, if formed is more stable and supports H2O2
intermediate is unstable which prevents significant H2O2 reduction. The simultaneous
occurrence of both reduction mechanisms demonstrates the influence of locally
established surface compositions and the switch from one to the other appears to be
controlled by the diffusive transport conditions at the electrode surface.
In addition to H2O2, the influence of the dominant reducing species, H2,
anticipated inside a failed waste container was investigated at different [H2O2] in the
presence of the key ground water species (HCO3-/CO32-). Their combined influence on
the redox behavior of UO2 was followed using open circuit corrosion potential
measurements (ECORR), cathodic stripping voltammetry (CSV) and XPS. The presence of
HCO3-/CO32- in solution inhibits UO2 oxidation at lower [H2O2]. The influence of
dissolved H2 in suppressing surface oxidation under ambient conditions depends
primarily on chemically added [H2O2] and was evident in the presence of carbonate for
H2O2 concentrations ≤ 10-5 mol L-1.
A second goal of the thesis was to study the effect of fission products (metallic
particles and rare earth (RE3+)) on UO2 oxidation. These studies were conducted on 0.3
wt% Yttrium-doped UO2 (Y-UO2), 6 wt% Gadolinium doped UO2 (Gd-UO2), 12.9 wt%
Dysprosium doped UO2 (Dy-UO2) and 1 wt% Palladium-doped UO2 (Pd-UO2) electrodes.
The electrodes were characterized using Raman Spectroscopy and SEM/EDX and their
anodic oxidation studied electrochemically and by XPS.
Voltammetric experiments on Y-doped UO2 electrodes containing noble metal
particles showed the presence of a current at sub-thermodynamic potentials consistent
with a lattice containing a mixture of stoichiometric and non-stoichiometric domains.
on homogeneously REIII doped electrodes demonstrated a clear doping influence on both
stages of the anodic oxidation process; i.e., on the initial matrix oxidization step (UO2 →
UO2+x) and on its further oxidation to soluble UVI (as UO22+). Doping appears to
influence the kinetics of the second step more than that of first step. Raman spectroscopy
shows that an increase in doping level leads to the formation of REIII-Oxygen vacancy
(OV) clusters which decreases the number of the OV sites required for oxidation.
The influence of carbonate/bicarbonate (the key groundwater constituents likely
to influence fuel dissolution) on the electrochemical oxidation process of RE-doped UO2
(Gd-UO2) was examined using CV, potentiostatic polarization and XPS. While CV scans
show that carbonate has a significant catalytic effect on the oxidative dissolution of UO2,
a stable surface layer (UO2+x)is present irrespective of carbonate concentration.
Potentiostatic experiments in the potential range -0.5 to 0.5V also show that the
oxidation/dissolution currents are increased in the presence of carbonate. XPS analyses
showed the electrode to be free of UVI species. This indicates that the slow step in the
overall anodic dissolution process is the electrochemical formation of UVI not its
chemical dissolution.
Keywords: Uranium dioxide, Hydrogen peroxide, Reduction mechanism, Corrosion
CO-AUTHORSHIP STATEMENT
This thesis includes published data (Chapter 4). For the published results I was the
ACKNOWLEDGEMENTS
First and foremost, I would like to express my deep and sincere gratitude to my
advisor Professor David Shoesmith whose expertise and understanding added
considerably to my graduate experience. His open-door policy and willingness to discuss
on any matter was invaluable to me. He patiently provided the encouragement and advice
necessary for me to proceed through the doctoral program and complete my dissertation.
I am grateful to him for carefully reading and commenting on countless revisions of this
thesis.
Besides my advisor, I am thankful to the rest of my thesis committee members,
Dr. Zhifeng Ding, Dr. Keith Griffiths, Dr. Michael Freund and Dr. Denis O'Carroll for
their time and co-operation.
Special thanks to Dr. Mark Biesenger from Surface Science Western (SSW) for
providing training and assistance on a surface analytical instrument used in this research,
which helped me collecting worth of data. I would also like to thank Ms. Heather
Bloomfield, Mr. Brad Kobe and Ms. Mary Jane Walzak from SSW for assistance with
other analytical instruments when needed.
I appreciate and extend my thanks to Dr. Jiju Joseph for helping me in conducting
hydrogen peroxide analysis in the Radiolysis laboratory at Western.
I would also like to thank my fellow lab-mates, both past and present at Western
for making my graduate school experience memorable.
A huge thank to my husband, Ajit. His constant support, practical advice and
Most importantly, I wish to thank my parents for their endless support and
encouragement in all aspects of my life. I know that I would not have made it this far
TABLE OF CONTENTS
ABSTRACT...ii
CO-AUTHORSHIP STATEMENT...v
ACKNOWLEDGEMENTS...vi
TABLE OF CONTENTS...viii
LIST OF TABLES...xvi
LIST OF FIGURES...xvi
SYMBOLS AND ACRONYMS...xxvi
Chapter 1: Introduction...1
1.1 Project Background………...1
1.2 UO2 Fuel Composition...5
1.2.1 Spent Fuel...5
1.2.2 SIMFUEL...7
1.3 Fuel Properties...8
1.3.1 Structural/Solid State Properties...8
1.3.2 Electrical Properties...11
1.3.3 Thermodynamic Properties...13
1.4 Redox Chemistry of Uranium Dioxide...15
1.5 Previous Approaches and Modelling- The Mixed Potential Model (MPM)...19
1.6 Research Goal...21
Chapter 2: Literature Review...26
2.1 UO2 Fuel Corrosion...26
2.1.1 Factors affecting UO2 Corrosion………...26
2.1.1.1 Effect of α-radiolysis...27
2.1.1.2 Effect of β/γ-Radiolysis Products...29
2.1.1.3 Effect of Environmental Oxidant (O2)...30
2.1.1.4 Effect of pH...30
2.1.1.5 Effect of Groundwater Species...31
2.1.1.6 Effect of Dopants in the UO2 Matrix...33
2.1.2 Surface Composition and Presence of Deposits...34
2.2 Influence of H2 on UO2 (SIMFUEL) corrosion...37
2.3 Influence of Rare-earth Doping on UO2 ...42
2.4 Defects...46
2.4.1 Point Defects...47
2.4.1.1 Intrinsic defects: Schottky and Frenkel defects...48
- The Schottky Defect...49
- The Frenkel Defect...49
2.4.1.2 Extrinsic defects...50
2.4.2 Point Defects in UO2...50
2.4.3 Association of Point Defects...52
2.4.4 Defect clusters in UO2...52
2.5 Defect Structures: The Cuboctahedral Cluster (U4O9 / U3O7)...54
2.6 References...59
Chapter 3: ExperimentalTechniques and Details...67
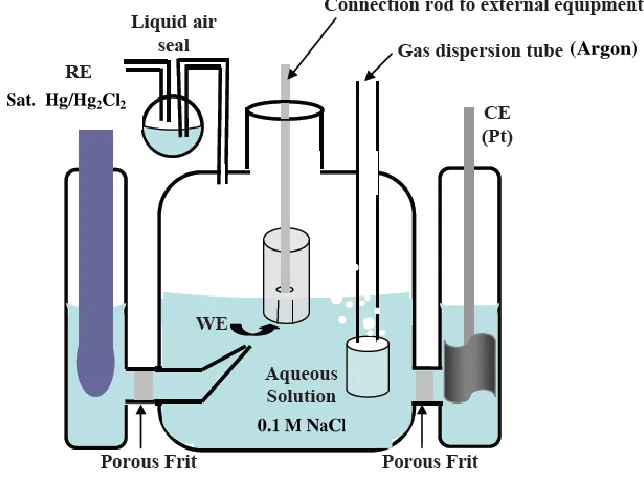
3.1 Electrochemical Details...67
3.1.1 Experimental Cell and Equipment...67
3.1.2 Electrode Material and Preparation...69
3.1.3 Solution Preparation...71
3.2 Electrochemical Experimental Techniques...71
3.2.1 Corrosion Potential (ECORR) Measurements...71
3.2.2 Rotating Disc Electrode (RDE) Technique...76
3.2.3 Electrochemical Polarization Techniques...79
3.2.3.1 Potentiostatic Polarization...79
3.2.3.2 Cyclic Voltammetry (CV) ...79
3.2.3.3 Cathodic Stripping Voltammogram (CSV) ...81
3.2.4 Linear Polarization Resistance Measurements...83
3.3 X-Ray Photoelectron Spectroscopy (XPS) ...85
3.3.1 Principles of XPS...85
3.3.2 XPS Experimental Details...90
3.4 Scanning Electron Microscopy (SEM)/Energy Dispersive X-ray (EDX) Spectroscopy 3.4.1 Principles of SEM/EDX...92
3.4.2 SEM/EDX Experimental Details...95
3.5 Raman Spectroscopy ...95
3.5.2 Raman Experimental Details...98
3.6 UV-vis Spectrophotometry...99
3.6.1 Principles of UV-vis Spectrophotometry...99
3.6.2 UV-vis Experimental Details...102
3.7 References...104
Chapter 4: Electrochemical Reduction of Hydrogen Peroxide on SIMFUEL (UO2) in Acidic pH Conditions...106
4.1 Introduction...106
4.2 Experimental Details...109
4.2.1 Electrode Materials...109
4.2.2 Electrochemical Cell and Equipment...109
4.2.3 Electrode Polishing and Solution Preparation...110
4.2.4 UV-vis Spectrophotometry...111
4.2.5 Scanning Electron Microscopy (SEM) ...111
4.2.6 X-ray Photoelectron Spectroscopy (XPS) Analyses...112
4.3 Results and Discussion...114
4.3.1 Voltammetry...114
4.3.2 XPS Analyses...127
4.3.3 Scanning Electron Microscopy (SEM) ...131
4.3.4 Summary...133
Chapter 5: Influence of Carbonate on the Surface Oxidation of SIMFUEL (UO2) in
the Presence of Dissolved Ar or 5% H2/95%Ar...139
5.1 Introduction...139
5.2 Experimental Details...142
5.2.1 Electrode Materials...142
5.2.2 Electrochemical Cell and Equipment...142
5.2.3 Electrode Polishing and Solution Preparation...143
5.2.4 Experimental Procedure...144
5.2.5 UV-vis Spectrophotometry...145
5.2.6 XPS Surface Analysis...145
5.3 Results and Discussion...146
5.4 Summary...165
5.5 References...167
Chapter 6: Surface and Electrochemical Characterization of Rare-Earth Oxide (Y2O3)/Metal Particle (Pd) Doped Uranium Dioxide...170
6.1 Introduction...170
6.2 Experimental...176
6.2.1 Fuel specimens and electrode preparation...176
6.2.2 Solutions ...177
6.2.3 Electrochemical Measurements...177
6.2.4 Experimental Procedure...178
6.2.5.1 Scanning Electron Microscopy (SEM)/ Energy Dispersive X-ray
(EDX) Analyses...179
6.2.5.2 Raman spectroscopy...179
6.2.5.3 X-ray Photoelectron Spectroscopy (XPS) Analyses...180
6.3 Results...181
6.3.1 Voltammetric behavior...181
6.3.2 Surface characterization...187
6.3.2.1 SEM/EDX analysis...187
6.3.2.2 Raman analysis...192
6.3.2.3 XPS analysis...195
6.3.3 Corrosion Potential (ECORR) and Linear Polarization Resistance (Rp) Measurements in H2O2 Solutions...198
6.4 Discussion and Conclusions...201
6.5 References...205
Chapter 7: Influence of Trivalent-Dopants on Electrochemical and Structural Property of Uranium Dioxide (UO2)...210
7.1 Introduction...210
7.2 Experimental...213
7.2.1 Electrode Material and Preparation...213
7.2.2 Electrochemical Procedure...214
7.2.3 Solution Preparation...214
7.2.5 SEM/EDX Measurements...215
7.2.6 Raman Analysis...216
7.3 Results...216
7.3.1 SEM/EDX Analysis...216
7.3.2 Surface Electrochemistry...219
7.3.3 Raman Analyses...225
7.3.3.1 SIMFUEL...227
7.3.3.2 Gd-UO2...230
7.3.3.3 Dy-UO2...230
7.3.3.4 General Raman features...231
7.4 Discussion...232
7.5 Conclusions...236
7.6 References...238
Chapter 8: Influence of Carbonate on the Electrochemical Reactivity of 6.0 wt% Gd-doped UO2...241
8.1 Introduction...241
8.2 Experimental...243
8.2.1 Electrode Material and Preparation...243
8.2.2 Electrochemical cell and Equipment...244
8.2.3 Solutions...244
8.2.4 Electrochemical Techniques...245
8.2.5 Surface Characterization...245
ray (EDX) Analysis...245
8.2.5.2 X-ray Photoelectron Spectroscopy...246
8.2.5.3 Raman Spectroscopy...247
8.3 Results and Discussion...247
8.3.1 Surface Characterization...247
8.3.2 Voltammetry...251
8.3.3 Potentiostatic Oxidation...254
8.3.4 XPS Analysis...261
8.3.5 Cathodic Stripping Voltammetry...270
8.4 Summary and Conclusions...274
8.5 References...275
Chapter 9: Summary and Future Work...277
9.1 Project Summary...277
9.2 Future Work...282
LIST OF TABLES
Table 4.1 Peak binding energies used for U (4f7/2) and satellite peak
positions associated with U (4f7/2)... 113
LIST OF FIGURES
Figure 1.1 Illustration of the deep geological repository concept showing the container, emplacement room, and tunnel layout... 2
Figure 1.2 Solubility of uranium dioxide (UO2) and schoepite (UO3.2H2O) as
a function of pH at 25°... 3
Figure 1.3 Alpha, beta, and gamma radiation dose rates with respect to time for water in contact with a CANDU fuel bundle with a burn up of 721 GJ kg−1 U... 4
Figure 1.4 Schematic illustrating the key changes induced by in-reactor
fission showing the three general categories of radionuclides... 6
Figure 1.5 An illustration of the UO2 lattice. Dark solid spheres are U atoms,
white hollow spheres are O atoms, and white rectangles are empty interstitial lattice sites... 9
Figure 1.6 Illustration showing the 2:2:2 cluster in UO2+x, with relation to the
parent fluorite lattice... 10
Figure 1.7 Illustration showing the 4:3:2 cluster in UO2+x... 11
Figure 1.8 Band structure diagram for UO2, and its relationship to important
energy scales (from electrochemical and spectroscopic data)... 12
Figure 1.9 Potential-pH diagram for the uranium/water system at T 25ºC.
Uranium concentration is 10-9 mol L-1... 14
Figure 1.10 Isosolubility lines for the uranium/water system with various
uranium concentrations, at 25ºC... 15
Figure 1.11 Composition and corrosion behavior of UO2 as a function of the
UO2 corrosion potential... 16
Figure 1.12 Illustration of possible electrochemical/chemical interactions
Figure 2.1 Schematic illustration of the major processes involved at the fuel/water interface in the radiolytic dissolution of spent fuel. First,
-radiolysis of water (1) produces oxidants which subsequently oxidize U in the spent nuclear fuel matrix (2). Then, uranium is released to solution aided by complexation through aqueous ligands, and finally (3) the U can re-precipitate on the fuel surface as a secondary phase... 28
Figure 2.2 Illustrations showing the development of acidity within pores in a corrosion product deposit. The left panel shows that acidity can develop at the anodic dissolution site if it is separated spatially from the cathodic site. The right panel shows that if the two sites are not separated spatially, then the alkalinity produced by H2O2
reduction should be, at least partially, neutralized by the acidity
created due to UO22+ hydrolysis... 36
Figure 2.3 A proposed mechanism for the possible reactions between H2 and
potential oxidants on the fuel surface... 39
Figure 2.4 Schematic of the galvanic coupling between the fuel matrix and noble metal (ε) particles leading to the suppression of fuel
corrosion by H2 oxidation... 40
Figure 2.5 Oxidation of Gd2O3 doped UO2 at 350 °C... 43
Figure 2.6 Thermogravimetric measurements on powdered (U1-yGdy)O2
showing gradients of weight gain by O (O/(U+Gd)) as a function of temperature from 50 to 540 οC at a heating rate of 1 οC.min-1. The value of the O/U ratio (2.25) at the first plateau corresponds to U4O9 and the value at the second plateau (2.67) corresponds to
U3O8... 44
Figure 2.7 Types of point defects in an elemental crystal... 47
Figure 2.8 Schottky (left) and Frenkel (right) defects in a MX-type ionic
crystal, where the square denotes a vacancy... 48
Figure 2.9 Point defect formation energies in UO2... 51
Figure 3.1 Schematic diagram of the standard three-compartment
electrochemical cell used... 68
Figure 3.2 Schematic of the (a) experimental arrangement employed to electroplate Cu onto one face of UO2 electrode; and (b) the
prepared electrode... 70
Figure 3.3 Current-potential relationships for the UO2 dissolution and the
oxidant reduction reactions illustrating their coupling at the
corrosion potential (ECORR) to yield the corrosion current (iCORR).... 73
Figure 3.4 Evans diagram for the corrosion process... 75
Figure 3.5 Diagram of the concentration gradients (dc/dx) near an electrode/solution interface as the electrode rotation rate (ω) changes. The δ’s represent the Nernst diffusion layer thickness for these values of ω... 77
Figure 3.6 Potential-time profile for a CV in which the potential is scanned
twice from Ec (-1.2 V) to Ea (0.4 V), and then back to Ec... 80
Figure 3.7 Potential-time profile for a typical CSV when the potential is
scanned from EApp’d or ECORR to Ec... 81
Figure 3.8 Schematic of a CV showing the integrated areas Qa and Qc. The
lower limit of integration when determining Qc is the threshold for
the onset of water reduction... 82
Figure 3.9 Schematic of a linear polarization curve showing the linear
potential used to measure the polarization resistance... 84
Figure 3.10 Schematic representation of photoelectron creation by excitation
of a core-level (1s) electron using XPS... 85
Figure 3.11 Illustration of the Fermi-level alignment of a metallic sample and the spectrometer... 86
Figure 3.12 Schematic diagram of an XPS instrument... 87
Figure 3.13 Survey spectrum on a polished Pt-doped UO2 electrode as an
example of an XPS spectrum with U lines. The most prominent
lines are indicated on the graph... 89
Figure 3.14 Schematic diagram of a Scanning Electron Microscope... 93
Figure 3.16 Energy level diagram showing the states involved in a Raman signal. The line thickness is roughly proportional to the signal
strength from the different transitions... 97
Figure 3.17 Characteristic Raman spectrum obtained on a polished 1.5 at%
SIMFUEL electrode... 98
Figure 3.18 Illustration of a diode array UV-Vis spectrophotometer... 100
Figure 3.19 Possible electronic transitions of σ, π and n electrons... 101
Figure 3.20 UV-Vis spectra for H2O2 over the concentration range 10-7 to 10-3
mol.L-1. The inset shows a calibration plot... 102
Figure 4.1 Voltammograms recorded on a 1.5 at.% SIMFUEL at 10 mV s-1 at an electrode rotation rate of 16.7 Hz in 0.1 mol L-1 NaCl
containing 5 x 10⁻³ mol L-1 H2O2 at different pH values. The scans
are offset by 15 mA cm-2... 115
Figure 4.2 Voltammograms recorded on a 1.5 at.% SIMFUEL at 10 mV s-1 at an electrode rotation rate of 16.7 Hz in 0.1 mol L-1 NaCl at pH 2.6 containing H2O2: (A) 0 molL-1; (B) 1.5 x 10⁻³ molL-1 and (C) 5 x
10-3 molL-1. The arrows indicate scan direction... 116
Figure 4.3 Voltammograms recorded on a 1.5 at.% SIMFUEL RDE at 10 mV s-1 in Ar-purged 0.1mol L-1 NaCl solution at pH 4 in solutions containing H2O2 (a) 6.5 x 10⁻⁴ mol L-1 and (b) 4.9 x 10⁻⁴ molL-1.
The currents have been corrected for the background current recorded in the absence of H2O2. The arrows indicate scan
direction... 118
Figure 4.4 Levich plots for H2O2 reduction currents recorded on a 1.5 at.%
SIMFUEL RDE in Ar-purged 0.1mol L-1 NaCl solution at pH 4 in solutions containing H2O2 (a) 6.5 x 10⁻⁴ molL-1 and (b) 4.9 x 10⁻⁴
molL-1. The currents have been corrected for the background
current recorded in the absence of H2O2... 119
Figure 4.5 The ratio of the background corrected currents (∆i) to the
theoretical diffusion limiting current (iL) recorded as a function of
electrode rotation rates at -0.8 V in 0.1 mol L-1 NaCl solutions for (a) pH 4; [H2O2] = 6.5 x 10⁻⁴ molL-1 (B) pH 4; [H2O2] = 4.9 x 10⁻⁴
Figure 4.6 (a) Voltammograms and (b) Levich plot for H2O2 reduction
current recorded on a 1.5 at % SIMFUEL RDE in Ar-purged 0.1 molL-1 NaCl solutions at pH 3 containing 8.3 x 10⁻⁴ molL-1 H2O2.
The currents have been corrected for the background current recorded in the absence of H2O2.The arrows indicate scan
direction... 122
Figure 4.7 Voltammograms for H2O2 reduction currents recorded on a 1.5 at
% SIMFUEL RDE in Ar-purged 0.1M NaCl solutions at pH 3.5 containing H2O2 (a) 7.7 x 10⁻⁴ mol L-1 and (b) 4.4 x 10⁻⁴ molL-1.
The currents have been corrected for the background current recorded in the absence of H2O2.The arrows indicate scan
direction... 124
Figure 4.8 Voltammograms to various anodic potential limits for H2O2
reduction currents recorded on a 1.5at% SIMFUEL RDE in Ar-purged 0.1M NaCl at pH 3.5 containing 7.7 x 10⁻⁴ mol L-1 H2O2
(a) 300 rpm (b) 1500 rpm. The currents have been corrected for the background current recorded in the absence of H2O2.The
arrows indicate scan direction... 125
Figure 4.9 The ratio of the background corrected currents (∆i) to the
theoretical diffusion limiting current (iL) as a function of [H2O2] at
-0.8 V in 0.1 mol L-1 NaCl solutions at 3 ≤ pH ≤ 4. The lines in
the figure are not fits to the data points... 126
Figure 4.10 Background corrected H2O2 reduction currents (∆i) as a function
of [H2O2] at pH 3.5 after applying a constant potential of -0.2 V
for 1 hour... 128
Figure 4.11 Representative U 4f XPS spectra recorded on a 1.5 at% SIMFUEL electrode in pH 3.5 solution under constant potential at -0.2V for 1 h: (a) without H2O2 (b) with 2x10⁻³ molL-1 and (c) 8x10⁻³ mol L-1
H2O2. The arrows indicate the separation between satellites and the
U 4f5/2 peak... 130
Figure 4.12 Relative percentages of the three U oxidation states as a function [H2O2] in 0.1 mol L-1 NaCl solutions at pH 3.5 at a potential of
-0.2 V for 1 hour... 131
Figure 4.13 SEM images collected at a magnification of 1000x on a 1.5 at.% SIMFUEL after a 1 h potentiostatic treatment in 0.1 mol L-1 NaCl solution at pH 3.5 containing [H2O2] (a) freshly polished surface
Figure 4.14 Proposed mechanism for the reduction of H2O2 with UO2 surfaces
in acidic solutions (a) [H2O2] [H+] (b) [H2O2] < [H+]... 134
Figure 5.1 ECORR as a function of time for different [H2O2] obtained on a 1.5
at. % SIMFUEL electrode in Ar-purged 0.1 mol L-1 NaCl (pH ~ 9) (a) without and (b) with 0.05 mol L-1 HCO3- /CO32... 147
Figure 5.2 ECORR as a function of time for different [H2O2] recorded on a 1.5
at. % SIMFUEL electrode in 0.1 mol L-1 NaCl (a) without carbonate (stirred solution); (b) with 0.01 mol L-1 HCO3- /CO3
2-(unstirred solution) (pH ~ 9.5). These experiments were conducted in an anaerobic chamber... 149
Figure 5.3 ECORR as a function of [H2O2] recorded on a 1.5 at % SIMFUEL in
Ar-purged 0.1M NaCl solution at pH~9.5 (red) with 0.01 mol L-1
carbonate and (black) without carbonate... 151
Figure 5.4 Rp values as a function of [H2O2] recorded on a 1.5 at %
SIMFUEL in Ar-purged 0.1M NaCl solution at pH~9.5 with 0.01
mol L-1 carbonate (red) and (black) without carbonate... 151
Figure 5.5 SEM micrographs obtained on completion of the ECORR
measurements (shown in Fig. 5.2) (a) freshly polished surface; (b) after the experiment without carbonate; (c) after the experiment
with carbonate... 154
Figure 5.6 ECORR as a function of time for different [H2O2] obtained on a 1.5
at. % SIMFUEL electrode in 5% H2/95% Ar-purged 0.1 mol L-1
NaCl (pH ~ 9) (a) without and (b) with 0.05 mol L-1 HCO3- /CO32.. 155
Figure 5.7 Steady state ECORR values for various [H2O2] obtained on a 1.5 at%
SIMFUEL electrode (from Figs. 5.1 and 5.6) in either Ar or 5% H2/95% Ar-purged solutions with (open data points) and without
carbonate (closed data points)... 157
Figure 5.8 CSVs recorded on a 1.5 atom % SIMFUEL electrode after the final ECORR measurement in the experiments shown in Figs. 5.1
and 5.6 (a) Ar-purged solution with/without carbonate (b) 5%
H2/95% Ar-purged solution with/without carbonate... 159
Figure 5.9 ECORR recorded on a 1.5 atom % SIMFUEL electrode before and
after H2O2 addition and prior to XPS analyses in (a, b) Ar and (c,
d) 5% H2/95% Ar-purged solution. The time at which H2O2 was
Figure 5.10 Comparison of steady-state ECORR values measured on a 1.5 at%
SIMFUEL electrode at various [H2O2] from Figs. 5.1 and 5.6: (a)
Ar or (b) 5% H2/95% Ar-purged with (triangular data points) and
without carbonate (squared data points) in solution ... 162
Figure 5.11 Comparison of final steady-state ECORR values recorded on a 1.5
at% SIMFUEL electrode at various [H2O2] prior to XPS
analyses... 163
Figure 5.12 Stoichiometry of the 1.5 at% SIMFUEL evolved as a function of [H2O2]in (a) Ar and (b) 5% H2/95% Ar-purged with (open data
points) and without carbonate (closed data points) in solution... 164
Figure 6.1 CV’s to various anodic limiting potentials recorded on the (a) UO2, (b) UO2-Y2O3,(c) UO2-Y2O3-Pd, (d) UO2-Pd electrodes in
Ar-purged 0.1 mol L-1 NaCl solution buffered with sodium borate
(0.05 mol.L-1) at pH~9.2. The scan rate=5 mV s-1…... 182
Figure 6.2 Anodic currents taken from the CV’s (Fig. 6.1) recorded on all four electrodes in Ar-purged 0.1molL-1 NaCl solution buffered
with sodium borate (0.05 mol L-1) at pH ~9.2... 184
Figure 6.3 Potentiostatic current-time curves recorded on a 1.5 at% SIMFUEL, and the four electrodes at +0.4 V for 30 min in Ar purged 0.1mol.L-1 NaCl buffered with sodium borate (0.025 mol
L-1 ) at pH~ 9.2... 185
Figure 6.4 SEM micrographs at magnifications of 2500X and 10000X on (a)
UO2, (b) UO2-Y2O3 (c) UO2- Y2O3-Pd and (d) UO2 -Pd electrodes.. 188
Figure 6.5 SEM micrographs recorded on a UO2-Y2O3 electrode at a
magnification of 500X and the corresponding EDX maps for U, Y and O. An EDX spectrum recorded on the particle is also
shown... 189
Figure 6.6 SEM micrographs recorded on the UO2-Y2O3-Pd electrode at a
magnification of 500X and the corresponding EDX maps for U, Y, Pd and O... 190
Figure 6.7 SEM micrograph on a UO2-Pd at a magnification of 500X and
corresponding EDX maps after polishing on a 1200 grit SiC paper. 191
Figure 6.8 Raman spectra recorded on the four polished electrodes... 193
Figure 6.9 Fitted and deconvoluted Raman bands for the wavenumber range
Figure 6.10 Fitted and deconvoluted XPS spectra for the U-4f region recorded on the four electrodes; (b) Relative fractions of all three oxidation
states obtained from the XPS curve fitting... 197
Figure 6.11 ECORR recorded as a function of time before and after the addition
of H2O2 (2 mmolL-1) to an Ar -purged 0.1molL-1 NaCl solution
containing 10mmolL-1 NaHCO3 at pH ~9.0: the sudden increases
in ECORR occur immediately on H2O2 addition... 199
Figure 6.12 Polarization resistance (Rp) values recorded at various times before
and after the addition of 2mmolL-1 of H2O2 to an Ar-purged
0.1molL-1 NaCl solution containing 10mmolL-1 NaHCO3 at pH
~9.0. The Rp values are normalized to ejected time which is four
hours prior to H2O2 addition... 200
Figure 7.1 SEM micrographs recorded on (a) Dy-doped UO2 (b) Gd-doped
UO2 and (c) 1.5 at% SIMFUEL electrode at 1000 and 5000X... 217
Figure 7.2 EDX maps recorded on a Dy-doped UO2 at a magnification of
2000X... 218
Figure 7.3 EDX maps recorded on a Gd-doped UO2 at a magnification of
2000X... 219
Figure 7.4 CVs recorded on Dy-doped UO2, Gd-doped UO2 and 1.5 at%
SIMFUEL electrodes in an Ar-purged 0.1M NaCl solution (pH = 9.5): (a) scans are offset by1 mA cm-2 and (b) individual scans.
The scan rate=5 mV/s... 220
Figure 7.5 Anodic currents recorded at 0 and 0.3 V on three UO2 electrodes
in Ar-purged 0.1M NaCl solution ( pH=9.5)... 223
Figure 7.6 Raman spectra recorded on three freshly prepared UO2 electrodes.. 226
Figure 7.7 Raman spectra recorded on three UO2 electrodes deconvoluted
into contributions from bands at ~450, 540, 570 and 640 cm-1... 228
Figure 7.8 The area ratio of the Raman peaks recorded ~ 445 cm-1 and 540
cm-1 (A445/A540: Fig. 7.7) as a function of doping level... 232
Figure 8.1 (a) SEM micrographs at various magnifications (100- 5000X) and
(b) EDX maps recorded on a Gd-UO2 electrode at 1000X... 248
Figure 8.2 (a) An optical image of a polished Gd-UO2 surface and, (b) the
corresponding Raman spectra recorded at the two different
Figure 8.3 A fitted and background-corrected high resolution U4f XPS
spectrum recorded on a polished Gd-UO2 electrode... 250
Figure 8.4 CVs recorded on a freshly polished Gd-UO2 electrode in an
Ar-purged 0.1 mol.L-1 NaCl, pH 9 (a) [CO32-] = 0 to 5x10⁻² mol.L-1 (b)
Repeated scans in a solution containing [CO32-] = 5x10⁻² mol.L-1
and on a rotating disk electrode at 16.67 Hz... 252
Figure 8.5 Potentiostatic current-time curves recorded for 1 h in Ar-purged 0.1 mol.L-1 NaCl, pH 9 in the range -0.5 to 0.5 V without (a, c, e) and with (b, d, f) carbonate ([CO32-] = 0.05 mol.L-1). Curve
recorded at -0.5V in carbonate solution (b) switched from anodic to cathodic current after 100 s. The final currents established at all potentials ≤ 0 V were also negative but this is not shown for
clarity. Regions A, B and C are discussed in the text... 258
Figure 8.6 Tafel plots for the anodic oxidation/dissolution of a Gd-doped UO2
electrode in 0.1 mol.L-1 NaCl, pH 9, Ar-purged solution with ([CO32-] =0.05 mol.L-1) and without carbonate. Data recorded on a
1.5 at% SIMFUEL in the carbonate solution is also included... 260
Figure 8.7 Representative U 4f XPS spectra resolved into contributions from UIV, UV and UVI recorded on a Gd-doped UO2 electrode in 0.1
mol.L-1 NaCl, pH 9 and Ar-purged solution at a series of applied
potentials -0.5, -0.1, 0 and 0.2V... 262
Figure 8.8 Representative U 4f XPS spectra resolved into contributions from UIV, UV and UVI recorded on a Gd-doped UO2 electrode in 0.1
mol.L-1 NaCl, pH 9, Ar-purged solution containing [CO32-] =0.05
mol.L-1 at a series of applied potentials -0.5, -0.1, 0 and 0.2V... 263
Figure 8.9 Relative fractions of all three U oxidation states as a function of applied potential in 0.1 mol.L-1 NaCl, pH 9, Ar-purged solution (a) without (from Fig. 8.7) and (b) with (from Fig. 8.8) carbonate
([CO32-] = 0.05 mol.L-1) in solution... 264
Figure 8.10 Fraction in the surface of Gd-UO2 and SIMFUEL as a function of
applied potential in 0.1 mol.L-1 NaCl, pH 9, Ar-purged solution
with and without carbonate... 266
Figure 8.11 Representative O (1s) XPS spectra resolved into contributions from O2-, OH-, and H2O recorded on a Gd-doped UO2 electrode in
0.1 mol.L-1 NaCl, pH 9, Ar-purged solution at various constant
Figure 8.12 Representative O (1s) XPS spectra resolved into contributions from O2-, OH-, and H2O recorded on a Gd-doped UO2 electrode in
0.1 mol.L-1 NaCl, pH 9, Ar-purged solution with [CO32-] =0.05
mol.L-1 at various applied potentials... 269
Figure 8.13 Cathodic stripping voltammograms (CSVs) recorded on a Gd-doped UO2 electrode after potentiostatic treatments (1 hour) at
various potentials in a 0.1 mol.L-1 NaCl, pH 9, Ar-purged solution (a) without and (b) with carbonate ([CO32-] = 0.05 mol.L-1) at
electrode rotation rate of 16.67 Hz... 271
Figure 8.14 Total cathodic charge obtained by integration of the reduction
SYMBOLS AND ACRONYMS
Ag Silver
Am Americium
Ar Argon
Ba Barium
Ce Cerium
Cu Copper
Dy Dysprosium
Gd Gadolinium
H2 Hydrogen
Hg Mercury
La Lanthanum
Mo Molybdenum
Nd Neodymium
Np Neptunium
Pt Platinum
Pu Plutonium
Rh Rhodium
Ru Ruthenium
Pd Palladium
Sr Strontium
Tc Technetium
Th Thorium
U Uranium
Y Yttrium
Zr Zirconium
Alpha
β Beta
γ Gamma
ν Frequency (Hz or s-1)
O' , O" Oxygen Interstitials
Oh Octahedral
CuSO4 Copper Sulfate
SHE Standard Hydrogen Electrode
Chapter 1
Introduction
1.1. Project Background
Nuclear power represents a low-cost, clean and safe form of energy generation
and many countries rely on electricity produced from this resource. However, with the
use of nuclear power, comes the responsibility for dealing with radioactive waste
disposal. The main form of high level nuclear waste available for disposal in Canada is
the used fuel bundle discharged from reactor [1]. These bundles which consist mainly of
uranium dioxide (UO2) need to be disposed in a way which safeguards human health and
minimizes the impact on the environment.
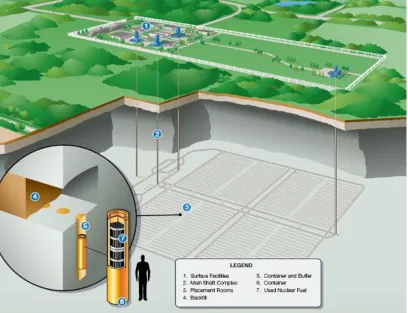
A deep geological repository is one of the approaches being considered for
long-term management of nuclear fuel waste in Canada [2]. In this approach, the engineered
repository would be a network of horizontal tunnels and emplacement rooms constructed
500 m to 1000 m deep in the stable crystalline rock of the Canadian Shield (Fig. 1.1).
Used nuclear fuel in the form of CANDU (CANada Deuterium Uranium) fuel bundles
would be sealed in a steel vessel with a corrosion resistant copper shell, surrounded by a
compacted buffer material i.e. bentonite clay which swells as it comes in contact with
water to fill any spaces or gaps retarding water migration around container. Each room
from access tunnels would be sealed with clay/crushed rock backfill material. Copper is
anoxic environment, anticipated in the repository, while the steel provides strength and
rigidity.
Figure 1.1 Illustration of the deep geological repository concept showing the container,
emplacement room, and tunnel layout. Image source: www.curriculum.cna.ca
While the prospects for containment with waste containers are good, exposure of
the used fuel to ground water in the event of failure would have a significant impact on
the safety assessment of the repository [3]. Since, the majority of the radionuclides in
used fuel (UO2) are located within the oxide grains, their release rate to the environment
investigate the surface reactivity of the UO2 in order to understand fuel dissolution
mechanisms and to determine its ability to retain individual radionuclides. The most
important parameter in determining the fuel corrosion rate is the redox condition inside a
failed waste container. The solubility of UO2 is extremely limited under reducing
conditions, but increases greatly under oxidizing conditions as shown in Fig. 1.2 [4].
Figure 1.2 Solubility of uranium dioxide (UO2) and schoepite (UO3.2H2O) as a function
of pH at 25°[4]
Generally, reducing conditions can be expected under granitic conditions (in
repositories under consideration in Canada, Sweden, and Finland) in a nuclear waste
repository, since environmental oxidants (i.e. dissolved O2 trapped in the porous sealing
materials) will be relatively rapidly consumed by waste container (Cu) corrosion and
mineral/biochemical oxidation processes in the clay and backfill materials. Therefore, the
major source of oxidants to drive fuel corrosion will be water radiolysis.
Figure 1.3 shows the alpha, beta, gamma dose rates calculated at the surface of a
fuel bundle of average burn-up. The gamma and beta radiation fields decay markedly
over the first 500 years: however, alpha radiation fields will remain significant for
periods of ~105 years [5].
Figure 1.3 Alpha, beta, and gamma radiation dose rates with respect to time for water in
contact with a CANDU fuel bundle with a burn up of 721 GJ kg−1 U [5]
1.E+00 1.E+01 1.E+02 1.E+03 1.E+04 1.E+05 1.E+06 1.E+07
10 100 1,000 10,000 100,000 1,000,000 10,000,000
D o s e r a te a t fu e l s u rf a c e ( G y /a )
Time since discharge (a)
Alpha
Beta
Hence, if the container fails, the UO2 surfaces could be subject to an oxidizing
environment for long periods of time. Radiolytic decomposition of water will generate
various oxidants (e.g. O2, O2-, OH and H2O2) near the surface of the fuel. Since the only
source of water is the groundwater, the onset of fuel corrosion will be determined by the
performance of the waste container. Canadian waste containers are expected to survive
until radiation fields can no longer produce significant oxidizing conditions [6, 7].
However, safety assessments conservatively assume that some containers will be
emplaced with undetected defects and the possibility of failure exists. So, it is judicious
to assume that containment will not be perfect and that some containers will fail before
alpha radiation fields become insignificant. Therefore, considerable effort has been
devoted to understanding the influence of alpha radiolysis on the corrosion of UO2 [8-11]
and a number of models have been proposed to predict its influence on radionuclide
release [12-17].
1.2 UO2 Fuel Composition
1.2.1 Spent Fuel
The fuel (used in CANDU power plants) is fabricated using un-enriched UO2
(235U = 0.71 %) by sintering pressed compacts pellets of fine-grained powders at
~1700 ºC in a reducing atmosphere [18]. The fuel density is upto 92-99% of the
theoretical value (10.96 g cm-3), with grain sizes of 2-15 µm and an O/M ratio close to
stoichiometric (~ 2.001) [3]. These pellets are sealed inside zirconium-tin (Zircaloy-4)
This fuel assembly weighs 23.9 kg, of which 21.7 kg is UO2 and 2.2 kg is Zircaloy [19].
The typical burnup range for CANDU fuel is ~ 120 to 320 MWh kg-1 U, and a reference
value of 220 MWh kg-1 U has been used for repository studies.
Figure 1.4 Schematic illustrating the key changes induced by in-reactor fission showing
the three general categories of radionuclides [1]
Unlike new unirradiated fuel bundles, spent fuel contains a variety of fission
products and actinides (~2% by mass) created due to in-reactor irradiation. These fission
products differ widely in their compatibilities with the fluorite structure of UO2 due to
(1) Some fission products have very limited solubility in the lattice (e.g; 85Kr, 4He,
39
Ar, 99Tc, 129I, 14C, 135Cs, 125Sn, 79Se) and are volatile at reactor operating
temperatures, and migrate to the fuel/sheath gap during reactor operation.
(2) Other fission products are non-volatile and migrate to grain boundaries, and reside
in fission gas bubbles, or separate into solid phases such as perovskites ((Ba, Sr)
ZrO3) and metallic alloy phases (-particles: Mo, Ru, Rh, Pd, Tc).
(3) The majority of fission products and actinides/lanthanides (e.g; 238Pu, 241Am and
239
Np) are retained within the UO2 fuel matrix.
1.2.2 SIMFUEL
SIMFUEL is a chemically simulated fuel, produced by doping the UO2 lattice
with up to11 non-radioactive elements (Ba, Ce, La, Nd, Sr, Y, Zr, Mo, Pd, Rh, Ru) in
order to mimic the chemical effects caused by in-reactor irradiation of CANDU nuclear
fuel [21, 22]. SIMFUELs are ideal for laboratory experiments, since it simulates key fuel
properties without the associated radiation levels. The microstructure of SIMFUEL is
virtually identical to that of typical CANDU fuel pellets with grain sizes of the order
8-15 µm and a density greater than 95% of the theoretical value. Small, spherical (0.5-1.5
µm in diameter) metallic alloy particles are dispersed uniformly throughout the matrix
with an average composition of 28 at. % Mo, 47 at. % Ru, 3 at. % Rh and 22 at. % Pd as
obtained from EDX/WDX analyses [21]. Perovskite (Ba, Sr)ZrO3 phases (~0.1 µm) are
also present as submicron particleson grain boundaries and the additives Y, Ce, Nd, La
The SIMFUEL used in this study replicates spent nuclear fuel with a 1.5 at. %
burnup (a little low for typical used CANDU fuel). To investigate the effects of dopant
concentration for simulated fuels containing 0.1 wt% Y, 1 wt% Pd, 6.0 wt% Gd or
12.9 wt% Dy were also investigated.
1.3 Fuel Properties
1.3.1 Structural Properties
UO2 is isostructural with other actinide dioxides with a fluorite crystal structure
(CaF2). The unit cell parameter a = 5.470 Å, and the ionic radii are ru4+ = 0.97 Å and rO2-
= 1.40 Å [18]. Figure 1.5 shows a UO2 lattice, with a U atom in each unit cell coordinated
to eight neighboring O atoms. This structure is very flexible and capable of generating
derivatives due to its ability to accommodate additional O atoms on cubically coordinated
interstitial sites without significant distortion. Oxidation of UO2 to UO2+x proceeds by the
injection of O2- at interstitial sites followed by oxidation of UIV to UV to maintain overall
electroneutrality. The fluorite structure can accommodate oxide ions up to a limiting
composition of UO2.33 which has a tetragonally distorted fluorite structure [23]. Further
oxidation would require structural rearrangement from the fluorite to a more open,
Figure 1.5 An illustration of the UO2 lattice. Dark solid spheres are U atoms, white
hollow spheres are O atoms, and white rectangles are empty interstitial lattice sites [26]
Neutron diffraction and X-ray photoelectron spectroscopic studies have shown
that when UO2 is extensively oxidized (UO2.13 to UO2.25), the interstitial sites become
displaced [23, 25, 27-31]. Oxygen occupies a newly identified interstitial positions,
termed O' and O", displaced from the cubically coordinated sites by ~ 1 Å in the (110)
and (111) directions with no apparent effect on the U sublattice. Figure 1.6 shows the
positions of these interstitial sites in relation to the main UO2 lattice. The occupation
numbers of the O' and O" sites, as well as the O vacancies are approximately the same,
Figure 1.6 Illustration showing the 2:2:2 cluster in UO2+x, with relation to the parent
fluorite lattice [25]
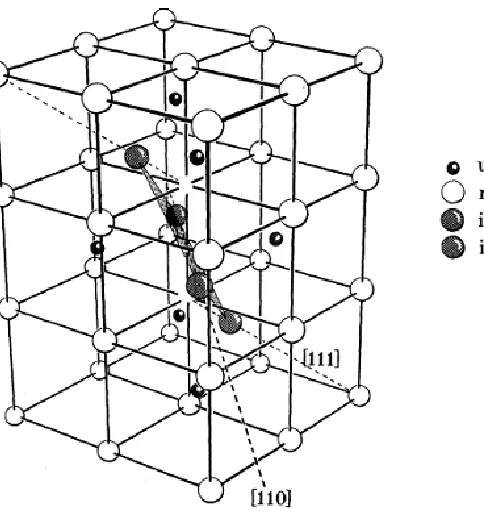
It has been claimed that the configuration of the defect complex in UO2.13, is a
2:2:2 cluster which contains two O' atoms, two O vacancies and two O" atoms. As the O
content increases to U4O9 (UO2.25), an alternative 4:3:2 cluster, (Fig. 1.7) was proposed
comprised of four O' atoms, three O vacancies and two O" atoms [32]. At this oxygen
Figure 1.7 Illustration showing the 4:3:2 cluster in UO2+x [25]
1.3.2 Electrical Properties
Uranium dioxide can be considered as a Mott-Hubbard insulator [33-37], due to
its partly filled cationic shell, which has a sufficiently narrow energy bandwidth that the
mobility of the electrons is restricted by their mutual Coulomb interaction. However,
electronic conductivity can still result by a small polaron hopping activated process, in
which the normally localized electrons can be transferred from one cation to the next by a
Figure 1.8 shows a schematic energy level diagram for UO2 where a narrow U 5f
band, containing 2 electrons per U atom lies in the gap between the filled valence band
and the empty conduction band. The valence band consists predominantly of O 2p states,
with some contribution from U 6d and 5f orbitals (filled U 5f level). The conduction band
is a mixture of overlapping U 7s, 6d and 5f states (empty U 5f level). The respective
Figure 1.8 Band structure diagram for UO2, and its relationship to important energy
occupied and unoccupied U 5f levels are termed as the lower and upper Hubbard bands.
For stoichiometric UO2, electronic conductivity requires promotion of an electron from
the lower to the upper Hubbard band, a process with a low probability at room
temperature (EA ~ 1.1 eV) [37]. However, fabricated UO2 pellets possess a slight excess
of O present as interstitial O2- ions, and charge balance is maintained by ionization of UIV
ions to the UV and/or UVI valence state [33, 35, 39, 40]. This oxidation process creates
holes in the occupied U 5f Hubbard band, which then migrate by the polaron hopping
mechanism with a lower activation energy of ~ 0.2 eV [33, 35, 39, 40]. Thus,
hyperstoichiometric UO2 can be treated as a p-type semiconductor which is able to
conduct an electric current for electrochemical reactions occurring at its surface [41].
While SIMFUEL is expected to be very close to stoichiometric, its conductivity is
enhanced by the REIII dopants in the UO2 matrix.
1.3.3 Thermodynamic Properties
The predominant soluble uranium species as a function of potential and pH for a
solution with uranium concentration of 10-9 mol L-1 are shown in Fig. 1.9, demonstrating,
rich aqueous electrochemistry of UO2. Though a range of U oxide phases are
thermodynamically possible within the water stability region, only UO2 and U4O9 are
stable.At this U concentration (10-9 mol L-1), which is close to the solubility of UO2 in
neutral solutions, U4O9 would be thermodynamically stable on the surface of UO2 over
the pH range 6 < pH < 9. As dissolved U concentration increases this stability range
expected within a geological disposal site, UO2 would be highly insoluble as U4+ (Fig.
1.2). However, in oxidizing conditions its solubility would increase by many orders of
magnitudes, and UO22+ (soluble form of U4+) would be the dominant soluble form for pH
< 6 [4, 42-44].
Figure 1.9 Potential-pH diagram for the uranium/water system at T 25ºC. Uranium
concentration is 10-9 mol L-1 [44]
Both these ions UO22+ and U4+ are extensively hydrolyzed in aqueous solutions to
form species such as Ux(OH)y(4x-y)+ for U4+ at pH > 1, and (UO2)x(OH)y(2x-y)+ for UO22+ at
pH > 4 [4, 42, 44]. Stabilization of these soluble U species can be achieved in aqueous
Cl-, SO42-, HPO42- and HCO3-/CO32- [4, 42-45]. Complexation constants for these ions
indicate that the solubility of UO22+ increases significantly when carbonate and phosphate
anions are present, while the solubility of U4+ is influenced much less by these species,
and would remain preferentially hydrolyzed [45].
Figure 1.10 Isosolubility lines for the uranium/water system with various uranium
concentrations, at 25ºC [44]
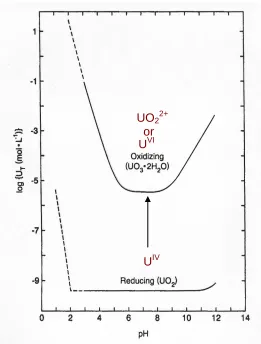
1.4Redox Chemistry of Uranium Dioxide
Figure 1.11 shows the composition of a UO2 surface as a function of surface redox
predicted by the Mixed Potential Model (described in the subsequent section) is indicated
by an arrow A. The association between composition and potential shown in this figure
has been determined by a combination of electrochemical and surface analytical
experiments (voltammetry, photothermal deflection spectroscopy, photocurrent
spectroscopy, and X-ray photoelectron spectroscopy) [3, 46]. The vertical dashed line
shown at -0.4 V (vs. SCE), represents the threshold for the onset of fuel corrosion.
Figure 1.11 Composition and corrosion behavior of UO2 as a function of the UO2
corrosion potential [3, 46]
For potentials greater than the threshold value fuel corrosion occurs at a rate
controlled by the concentration of radiolytically produced oxidants and below this
the solubility of UO2 in the groundwater conditions (in a deep geological repository) is
extremely low ~ 10-9 mol·L-1 (Fig. 1.2) [47-49], the only mechanism for significant
release of radionuclides is via corrosion. Figure 1.11 also shows the potential ranges for
the important electrochemical surface oxidation and dissolution processes on UO2.
The corrosion of the fuel can be influenced by factors which affect the redox
conditions developed at the fuel surface. In an anaerobic environment, the steel liner will
corrode on contact with groundwater. Therefore, two corrosion fronts exist within a failed
waste container, one at the spent fuel surface and the other at the steel surface. The
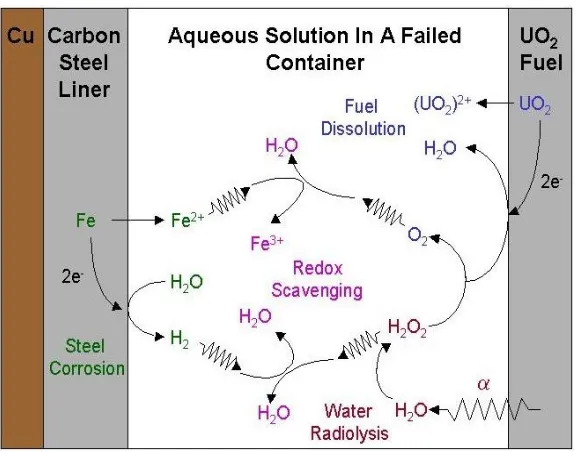
essential electrochemical reactions expected within a failed waste container are illustrated
in Fig. 1.12.
Figure 1.12 Illustration of possible electrochemical/chemical interactions within a failed
The difference in corrosion potential, which is the driving force between these
two fronts, can be 0.9 V. Local oxidizing conditions at the fuel surface leading to
corrosion will be maintained due to the -radiolysis of water producing H2O2 and O2.
Radiolytic oxidants produced in the near-field within ~ 25 m of the fuel surface, will
actively drive the corrosion/dissolution of the UO2 surface. Among the several oxidants
produced, H2O2 is considered the most likely to cause fuel corrosion and the potential
effects of this oxidant have been studied in detail [2, 3, 12, 50-56]. H2O2 reduction on
UO2 surfaces occurs via a coupled chemical-electrochemical process in which UIV–UV
donor–acceptor sites are first chemically created on the UO2 surface by H2O2 and
subsequently destroyed electrochemically,
2UIV + H2O2 → 2UV + 2OH− (1.1)
2UV + 2e− → 2UIV (1.2)
Under natural corrosion conditions, reaction (1.2) is coupled to the oxidation and
dissolution of UO2 as UO22+
UO2 → UO22+ + 2e− (1.3)
although it could also lead to the oxidation of H2O2
H2O2 → O2 + 2H+ + 2e− (1.4)
resulting in its overall decomposition. On the other front, the key reactions involved in
the anaerobic corrosion of carbon steel will be
Fe + 2H2O Fe2+ + 2OH- + H2 (1.5)
The low concentration of Fe2+ produced is expected to have only a small
influence on preventing oxidation of the UO2 surface via reaction with radiolytic H2O2
oxygen [16]. However, in sealed repositories, hydrogen gas generation may result in
significant pressures, leading to dissolved hydrogen concentrations in the range of 10-2 to
10-1 mol.L-1 [57]. Experimental studies have shown that the H2 produced by the corrosion
of steel scavenges the H2O2 generated by -radiolysis of water at the fuel surface and
produces H2O. Consequently, H2 is expected to have a significant effect on the corrosion
of spent fuel, thereby delaying radionuclide release.
However, redox conditions at the fuel surface are expected to change over the
repository lifetime considering many environmental factors like temperature, dissolved
O concentration, pH and groundwater species. The composition of the fuel surface
should, therefore, evolve with the accumulation of corrosion/dissolution product deposits.
This accumulation could have a number of distinct effects: (i) it could block the fuel
surface reducing the area exposed to the solution thereby suppressing fuel corrosion;
(ii) it could restrict the diffusion of solution species to (e.g. Fe2+, H2) and from (e.g.,
H2O2, UO2(OH)y(2-y)+) the reacting surface leading to the accumulation of H2O2 within
the pores of the deposits creating local acidity; (iii) it could also trap α-emitting
radionuclides which would modify the yield and distribution of α-radiolysis products.
1.5 Previous Approaches and Modelling----The Mixed Potential Model (MPM)
Presently, a world wide effort is underway to develop performance assessment
this effort, Shoesmith et al developed a Mixed Potential Model (MPM) which is presently
used in the Canadian Nuclear Waste Management program to guide experimental
programs [58]. A range of different processes are included in this model:
adsorption/desorption, precipitation/dissolution, and homogeneous redox reactions
involving various species in the groundwater. The model consists of corrosion fronts on
the fuel and steel liner surfaces, interconnected by diffusion processes in the groundwater
assumed to flood the container on failure.
A number of critical issues were identified and need to be investigated for the
development of this, and other, PA models. These include; (i) the reactivity of the fuel
surface; (ii) the composition of the fuel surface as a function of redox conditions; (iii) the
influence of corrosion product deposits on the fuel surface; (iv) the kinetics of hydrogen
peroxide reduction in support of fuel corrosion; (v) the scavenging of radiolytic oxidants
(H2O2, O2), and/or the inhibition of their reaction with the fuel, by the products of steel
corrosion (Fe2+/H2). With these concerns in mind, we have focused our studies on issues
such as the influence of corrosion product deposits on the corrosion of fuel surface since
this would directly impact the expected radionuclide release. In addition, the effect of
rare-earth fission products on the fuel oxidation process and how it is influenced in the
presence of carbonate complexing agent (the key groundwater constituent expected to
1.6Research Goal
The overall goal of this project is to develop the mechanistic understanding required
to understand radionuclide release from fuel inside a failed waste container. Thus, the
specific goals of this research are:
(1) To study the kinetics of H2O2 reduction in low pH conditions, since there is a
possibility of forming acidic conditions within surface flaws in the fuel and/or pores
in corrosion product deposits. This is important since the dissolution rate of the fuel is
very dependent on pH for values ≤ 5.
(2) To determine the influence of rare-earth (REIII) lattice doping on the overall
reactivity of UO2 specimens.
(3) To investigate the effect of trivalent rare earth doping on the electrochemical
reactivity of UO2 in carbonate.
1.7 References
1. J. McMurry, D. A. Dixon, J. D. Garroni, B. M. Ikeda, S. Stroes-Gascoyne, P. Baumgartner and T. W. Melnyk, Ontario Power Generation Report No: 06819-REP-01200-10092-R00, in Evolution of a Canadian deep geologic repository: base scenario, 2003.
2. Nuclear Waste Management Organization (NWMO), Choosing a Way Forward: The Future Management of Canada’s Used Nuclear Fuel, November 2005. 3. D. W. Shoesmith, Fuel corrosion processes under waste disposal conditions.
Journal of Nuclear Materials, 2000, 282 p. 1-31.
4. I. Grenthe, J. Fuger, R. J. Konings, R. J. Lemire, A. B. Muller, C. Nguyen-Trung and H. Wanne, Chemical Thermodynamics of Uranium, North Holland,
Amsterdam, 1992.
5. F. Garisto, D. H. Barber, E. Chen, A. Inglot and C. A. Morrison, Alpha, beta and gamma dose rates in water in contact with used CANDU fuel, Nuclear Waste Management Organization, 2009.
6. F. King, M. J. Quinn and N. H. Miller, The effect of hydrogen and gamma
radiation on the oxidation of UO2 in 0.1 mol.dm-3 NaCl solution, Swedish Nuclear
Fuel and Waste Management Co: Stockholm, Sweden, 1999.
7. L. H. Johnson, D. M. LeNeveu, D. W. Shoesmith, D. W. Oscarson, M. N. Gray, R. J. Lemire and N. C. Garisto, The disposal of Canada's nuclear fuel waste: the vault model for postclosure assessment, Atomic Energy of Canada Limited Report, 1994.
8. V. V. Rondinella, H. Matzke and T. Wiss, Leaching behaviour of UO2 containing
α-emitting actinide, Radiochimica Acta, 2000 88 p. 527-531.
9. S. Sunder, G. D. Boyer and N. H. Miller, XPS studies of UO2 oxidation by alpha
radiolysis of water at 100 ºC, Journal of Nuclear Materials, 1990 175. 10. S. Sunder, D. W. Shoesmith and N. H. Miller, Oxidation and dissolution of
nuclear fuel (UO2) by the products of the alpha radiolysis of water, Journal of
Nuclear Materials, 1997 244 p. 66-74.
11. W. J. Gray, Effect of surface oxidation, alpha radiolysis, and salt brine composition on spent fuel and UO2 leaching performance: Salt Repository
Project, Pacific Northwest Laboratory: Richland, Washington, USA, 1988. 12. H. Christensen and S. Sunder, Current state of knowledge of water radiolysis
effects on spent nuclear fuel corrosion, Nuclear Technology, 2000 131 p. 102-123.
13. H. Christensen, S. Sunder and D. W. Shoesmith, Final disposal of spent nuclear fuel: importance of the bedrock for safety, Studsvik Material AB: Nykoping, Sweden, 1992.
14. D. W. Shoesmith and L. H. Johnson, Ontario Hydro, 1997. 15. D. W. Shoesmith and F. King, Ontario Hydro, 1998.
16. F. King and M. Kolar, Prediction of the effects of alpha-radiolysis, precipitation and redox reactions with Fe and Fe(II) on the dissolution of UO2 using the
17. J. C. Wren, S. Sunder and D. W. Shoesmith, A finite element model to predict the concentration of radiolysis products in narrow gaps, Ontario Power Generation, 1999.
18. D. Vollath, Production of uranium dioxide pellets and other shapes, 8th ed. gmelin handbook of inorganic chemistry, Vol. C4, New York: Springer-Verlag, 1984.
19. J. C. Tait, H. Roman and C. A. Morrison, Characteristics and radionuclide inventories of used fuel from opg nuclear generating stations, Ontario Power Generation, 2000.
20. L. H. Johnson and D. W. Shoesmith, In radioactive waste forms for the future, ed. W. Lutze and R. Ewing, Amsterdam: Elsevier, 1988.
21. P. G. Lucuta, R. A. Verrall, H. Matzke, B. J. Palmer, Microstructural features of SIMFUEL - simulated high-burnup UO2-based nuclear fuel, Journal of Nuclear
Materials, 1991 178 p. 48-60.
22. A. F. Gerwing, F. E. Doern and W. H. Hocking, X-ray photoelectron
spectroscopy on radioactive materials using a McPherson ESCA-36 equipped with an SSL position-sensitive detector, Surface and Interface Analysis, 1989 14 p. 559-566.
23. B. T. M. Willis, Crystallographic studies of anion-excess Uranium oxides, Journal of the Chemical Society, Faraday Transactions 2, 1987 83 p. 1073-1081.
24. D. K. Smith, B. E. Scheetz, C. A. F. Anderson and K. L. Smith, Phase relations in the uranium-oxygen-water system and its significance on the stability of nuclear waste forms, Uranium, 1982 1 p. 79-110.
25. G. C. Allen and P. A. Tempest, Ordered defects in the oxides of uranium, Proceedings of the Royal Society of London A, 1986 406 p. 325-344.
26. K. Govers, S. Lemehov, M. Hou and M. Verwerft, Comparison of interatomic potentials for UO2 Part I: Static calculations, Journal of Nuclear Materials, 2007
366 p. 161-177.
27. B. T. M. Willis, The defect structure of hyper-stoichiometric uranium dioxide,
Acta Crystallographica, 1978 A34 p. 88-90.
28. B. T. M. Willis, Positions of the oxygen atoms in UO2.13, Nature, 1963 197 p.
755-756.
29. G. C. Allen, P. A. Tempest and J.W. Tyler, Coordination model for the defect structure of hyperstoichiometric UO2+x and U4O9, Nature, 1982 295 p. 48-49.
30. G. C. Allen and P. A. Tempest, Linear ordering of oxygen clusters in hyperstoicheiometric uranium dioxide, Journal of Chemical Society Dalton Transaction, 1982 1982 p. 2169-2173.
31. G. C. Allen and P. A. Tempest, The accommodation of oxygen clusters in
hyperstoicheiometric uranium dioxide and its effects on crystal structure, Journal
of Chemical Society Dalton Transaction, 1983 p. 2673-2677.
32. C. R. A Catlow, Point defect and electronic properties of uranium dioxide, Proceeding of Royal Society London, 1977 A353 p. 533-561.
33. P. W. Winter, The electronic transport properties of UO2, Journal of Nuclear
Materials, 1989 161 p. 38-43.
35. G. J. Hyland and J. Ralph, Electronic contributions to the high-temperature thermophysical properties of UO2+x: a critical analysis, High Temperatures-High
Pressures, 1983 15 p. 179-190.
36. J. M. Casado, J. H. Harding and G. J. Hyland, Small-polaron hopping in Mott-insulating UO2, Journal of Physics: Condensed Matter, 1994 6 p. 4685-4698.
37. P. Ruello, K. D. Becker, K. Ullrich, L. Desgranges, C. Petot and G. Petot-Ervas, Thermal variation of the optical absorption of UO2 determination of the small
polaron self-energy, Journal of Nuclear Materials, 2004 328 p. 46-54. 38. J. Schoenes, Electronic transitions, crystal field effects and phonons in UO2,
Physics Reports, 1980 63 p. 301-336.
39. W. H. Hocking, D. W. Shoesmith and J. S. Betteridge, Reactivity effects in the oxidative dissolution of UO2 nuclear fuel, Journal of Nuclear Materials, 1992 190
p. 36-45.
40. S. Aronson, J. E. Rulli and B. E. Schaner, Electrical properties of
nonstoichiometric uranium dioxide, The Journal of Chemical Physics, 1961 35 p. 1382-1388.
41. D. W. Shoesmith, S. Sunder and W. H. Hocking, Electrochemistry of novel materials, ed. J. Lipkowski and P. N. Ross. Vol. 297, 1994, New York: VCH. 42. T. R. Mueller and M. Petrek, Encyclopedia of electrochemistry of the elements,
ed. A.J. Bard. Vol. IX. 1986, NY: Dekker.
43. R. J. Lemire and P. R. Tremaine, Uranium and plutonium equilibria in aqueous solutions to 200°C, Journal of Chemical Engineering Data, 1980 25 p. 361-370. 44. J. Paquette and R. J. Lemire, A description of the chemistry of aqueous solutions
of uranium and plutonium to 200ºC using potential pH diagrams, Nuclear Science and Engineering, 1981 79.
45. R. J. Lemire and F. Garisto, Atomic Energy of Canada Limited, AECL-10009 1989.
46. B. G. Santos, H. W. Nesbitt, J. J. Noel and D. W. Shoesmith, X-ray photoelectron spectroscopy study of anodically oxidized SIMFUEL surfaces, Electrochimica Acta, 2004 49, p. 1863-1873.
47. G. A. Parks and D. C. Pohl, Hydrothermal solubility of uraninite, Geochimica
Cosmochimica Acta, 1988 52 p. 863-875.
48. D. Rai, A. R. Felmy and J. L. Ryan, Uranium (VI) Hydrolysis constants and solubility products of UO2.xH2O(am), Inorganic Chemistry, 1990 29 p. 260-264.
49. D. Rai, M. Yui and D. A. Moore, Solubility and solubility product at 22°C of UO2(c) precipitated from aqueous U(IV) solutions, Journal of Solution Chemistry,
2003 32 p. 1-17.
50. S. Sunder, N. H. Miller and D. W. Shoesmith, Corrosion of uranium dioxide in hydrogen peroxide solutions, Corrosion Science, 2004 46 p. 1095-1111. 51. J. S. Goldik, H. W. Nesbitt, J. J. Noël and D. W. Shoesmith, Surface
electrochemistry of UO2 in dilute alkaline hydrogen peroxide solutions,
Electrochimica Acta, 2004 49 p. 1699-1709.
52. P. G. Keech, J. J. Noël and D. W. Shoesmith, The electrochemical reduction of hydrogen peroxide on uranium dioxide under intermediate pH to acidic
53. J. C. Wren, D. W. Shoesmith and S. Sunder, Corrosion behaviour of uranium dioxide in alpha radiolytically-decomposed water, Journal of Electrochemical Society, 2005 152 p.B470-B481.
54. D. W. Shoesmith, J. J. Noël and F. Garisto, An experimental basis for a mixed potential model for nuclear fuel corrosion within a failed waste container, Material Research Society Society Symposium: Scientific Basis for Nuclear Waste Management, 2004 824.
55. J. de Pablo, I. Casas, J. Gimenez, V. Marti and M. E. Torrero, Solid surface evolution model to predict uranium release from unirradiated UO2 and nuclear
spent fuel dissolution under oxidizing conditions, Journal of Nuclear Materials, 1996 232 p. 138-145.
56. C. Corbel, G. Sattonnay, S. Guilbert, F. Garrido, M. -F. Barthe, C. Jegou, Addition versus radiolytic production effects of hydrogen peroxide on aqueous corrosion of UO2, Journal of Nuclear Materials, 2006 348 p. 1-17.
57. P. Carbol, J Cobos-Sabate, J-P Glatz, C. Ronchi, V. Rondinella, D. H. Wegen and T. Wiss, The effect of dissolved hydrogen on the dissolution of 233U doped UO2(s), high burn-up spent fuel and MOX fuel, Swedish Nuclear Fuel and Waste
Management Co: Stockholm, Sweden, 2005.
Chapter 2
Literature Survey
2.1 UO2 Fuel Corrosion
The expected conditions for the Canadian repository will only be oxidizing for a
short period (upto a few hundred years) after it has been sealed. Consequently by the time
container failure is predicted to occur, the groundwater entering the container, and
contacting the fuel, will be anoxic. Under these conditions, the driving force for fuel
dissolution would be proportional to the solubility of UO2 in the ground water, and its
rate of dissolution controlled by the conditions established inside the failed container.
2.1.1 Factors Affecting UO2 Corrosion/Dissolution
Numerous factors such as water radiolysis (particularly α-radiolysis), pH,
temperature, groundwater composition and the fission product content of the fuel could
influence its corrosion/dissolution [1-6]. The radiation fields emanating from the fuel
surface can produce oxidants. The influence of these on UO2 corrosion have been
reviewed in detail elsewhere [1] and will only be briefly discussed here. Figure 2.1


![Figure 1.7 Illustration showing the 4:3:2 cluster in UO2+x [25]](https://thumb-us.123doks.com/thumbv2/123dok_us/7793195.1292047/39.612.130.507.101.387/figure-illustration-showing-cluster-uo-x.webp)