International Journal of Research (IJR)
e-ISSN: 2348-6848, p- ISSN: 2348-795X Volume 2, Issue 07, July 2015Available at http://internationaljournalofresearch.org
A PSO Based Merge Algorithm for Color Image
Segmentation
Komal Mittal & Anuradha Panjeta
CSE & Kurukshetra University
[email protected]; [email protected]
Abstract –
This paper proposes an improved method of image segmentation by using particle swarm optimization (PSO) based merge. The PSO algorithm is used to find optimum number of clusters which will be used as a limiting value in merge algorithm. The performance of algorithm is measured using a validity index which is measured division of intra-cluster distance whose minimum value is desired and inter-cluster distance for which a maximum value is required. Once optimum number of cluster is found then PSO clustering algorithm is again applied to generate large number of clusters, then from these large numbers of clusters, pair of clusters with most similar characteristics are merged iteratively until numbers of clusters are reduced up to optimum number of clusters. The similarity measure is taken as Davies-Bouldin Index. The proposed merge algorithm is performing better than simple PSO algorithm.
Keywords— Particle Swarm Optimization
(PSO); Clustering; Image segmentation
I. INTRODUCTION
Image processing is among rapidly growing technologies today, with its applications in various aspects of a business. Image Processing forms core research area within engineering and computer science disciplines too. Image processing basically includes the following three steps.
Importing the image with optical
scanner or by digital photography.
Analyzing and manipulating the image
which includes data compression and image enhancement and spotting patterns that are not to human eyes like satellite photographs.
Output is the last stage in which result can be altered image or report that is based on image analysis.
International Journal of Research (IJR)
e-ISSN: 2348-6848, p- ISSN: 2348-795X Volume 2, Issue 07, July 2015Available at http://internationaljournalofresearch.org
become a same color level. Needless to say, the number of the partitioned subspaces which is the same as the number of the color levels is kept small enough to guarantee the bound of space and time complexities.
Segmentation procedures partition an image into its constituent parts or objects. In general, autonomous segmentation is one of the most difficult tasks in digital image processing. A rugged segmentation procedure brings the process a long way toward successful solution of imaging problems that require objects to be identified individually.Image segmentation is the process of partitioning a digital image into
disjoined, meaningful regions. The
meaningful regions may represent objects in an image of three-dimensional scene, regions corresponding to industrial, residential, agricultural, or natural terrain in an aerial recognizance application, and so on. A region is a connected set of pixels and the objects are considered either four-connected, if only laterally adjacent pixels are considered, or they can be eight-connected, if diagonally adjacent pixels are also considered to be connected. Image segmentation is an efficient and natural process for humans. A human eye (or rather, mind) sees not a complex scene, but rather a collection of objects. In contrast, image segmentation is not an easy task in digital image processing, and it may become a serious problem if the number of objects is large or unknown or if the boundaries between objects are not clear.
II. RELATED WORKS:
Image segmentation is the first step in image analysis and pattern recognition. It is a critical and essential component of image analysis system, is one of the most difficult tasks in image processing, and determines the quality of the final result of analysis. Image segmentation is the process of dividing an
image into different regions such that each region is homogeneous. In recent years, plenty of efforts have been focusing on the segmentation process. Numbers of different segmentation techniques are viewed in the literature, but there is not even a one single method to be considered as a best method for different kind of images, only suitable for one specific type of images. The objective of segmentation is dividing an input image into different regions or edges with similar properties. Many methods have been developed to segment the color images, many of them are based on the basic two properties [2]. Discontinuity based and Similarity based, In discontinuity based partition and sub-division is carried out based on abrupt changes in intensity levels or grey levels of an image, in this method our interest mainly focus on identification of isolated points, lines and edges. In similarity based group those pixels which are similar in some sense, it includes approaches like thresholding, region growing, region splitting and merging [4].
Patil et. al. [7] suggests to use K-means image segmenattion provided the number of clusters is estimated in accurate manner. Cui et. al. [8] proposed an edge based auto threshold select method to generate multi-scale image segmentation. MST and Edge based Threshold
method is used to perform image
segmentation and Band weight and
Normalized Difference Vegetation Index is used to calculate edge weight. Anna Fabijańska [9] introduced a new method which uses Variance Filter for edge detection in image segmentation process. Their method found the edge position using Variance Filter. Sobel Gradient filter with K-means. is also used to extract the edges and compared with the proposed technique. Yucheng et. al. [11] proposed a new fuzzy morphological based
International Journal of Research (IJR)
e-ISSN: 2348-6848, p- ISSN: 2348-795X Volume 2, Issue 07, July 2015Available at http://internationaljournalofresearch.org
Algorithm has used morphological opening and closing operations to smooth the image and then perform the gradient operations on the resultant image.
Kobashi et. al. [12] used scale based fuzzy connected image segmentation and fuzzy object model to segment the cerebral parenchyma region of new born brain MRI image. Refik Samet [13] proposed a new Fuzzy Rule based image segmentation technique to segment the rock thin segment images. They take RGB image of rock thin segment as input and give segmented mineral image as output. Fuzzy C Means is also applied on rock thin images and results are compared of both techniques. Muhammad Rizwan Khokher [14] presented a new method of image segmentation using Fuzzy Rule based system and Graph Cuts. Authors have firstly segmented the gray scale, color, and texture images using Graph Cuts. Weights are assigned to the features of image using Fuzzy Rules. Shiping Zhu [18] proposed a new threshold based edge detection and image segmentation algorithm. They calculate the threshold of each pixel in the image on the basis of its neighboring pixels. They also find the edges of image with the help of proposed algorithm. Wu Kaihua and Ban Tao [17] have
presented a new optimal threshold
segmentation method based on entropy criteria and Genetic algorithm in order to improve the image acquisition process in computer vision. The factors taken by them are illumination, light, reflection of light, CCD exposure time and some properties of image histogram. They compare their proposed technique with Otsu algorithm and found that their algorithm is efficient in searching and in finding threshold based segmentation of an image.
Frank Jiang [16] proposed a new multilevel
Threshold-based segmentation technique
using PSO and Wavelet mutation. D. Barbosa [15] proposed a new image segmentation technique which joins the edge and region based information with spectral method using Morphological Watershed algorithms. Gang Chen [10] found that fast extraction of object information from a given image is still a problem for real time image processing. They also found that region based methods are also time consuming and not give effective segmentation. They proposed a new region based method based on Least Square method in order to detect objects sharply. Zhen Hua, Yewei Li [6] proposed a new image segmentation method based on improved visual attention and region growing approach. The gray values and edges of input image are extracted using Gabor filter and Guass-Laplace filters. Then ANN methods are used to extract the region of interest. Experiments are conducted on natural scene images, and it is found that their algorithm not only segmented the image perfectly but also found the salience edges which others can’t.
III. PROBLEM FORMULATION
International Journal of Research (IJR)
e-ISSN: 2348-6848, p- ISSN: 2348-795X Volume 2, Issue 07, July 2015Available at http://internationaljournalofresearch.org
heavily depend on the number of clusters specified. It is necessary to provide educated guidance for determining the number of clusters in order to achieve appropriate clustering results. At the current stage of research, none of the existing methods of choosing the optimal estimate of the number of clusters is completely satisfactory. The gap method was recently proposed by Tibshirani
et al[3].The main idea of the gap method is to compare the within cluster dispersions in the observed data to the expected within cluster dispersions assuming that the data came from an appropriate null reference distribution. Simulation results reported by [3] indicated that the gap method is a potentially powerful approach in estimating the number of clusters for a data set. However, recent studies have shown that there are situation where the gap method may perform poorly. For example, when the data contain clusters which consist of objects from well separated exponential populations. The correct choice of k is often ambiguous, with interpretations depending on the shape and scale of the distribution of points in a data set and the desired clustering
resolution of the user. In addition, increasing k
without penalty will always reduce the amount of error in the resulting clustering, to the extreme case of zero error if each data point is
considered its own cluster (i.e., when k equals
the number of data points, n). Intuitively then,
the optimal choice of k will strike a balance between maximum compression of the data using a single cluster, and maximum accuracy by assigning each data point to its own cluster. If an appropriate value of k is not apparent from prior knowledge of the properties of the data set, it must be chosen somehow. There are several methods of finding the optimal number of clusters such as Davies Bouldin Index, Dunn’s Index and many other Validity Measures based on similarity and dissimilarity
concept. In this paper objectives are to enhance the existing K-means Clustering Algorithm for Color Image Segmentation. We need to find the method to find the optimal number of cluster for K-means clustering then validate the validity of the clusters, after that we need to find the criteria through which we can merge the similar cluster which can be similar in terms of the variance or the distance measure. We have to assume each pixel of the input image as a data point, hence there will be n data points or we can say n patterns x1, x2, x3,…., xn generated from the input image which can have n number of pixels. After that we need to apply K-means clustering algorithm to the whole set of patterns so that we can generate the large number of clusters, where each cluster contains the similar type of data points, then we need to find the method to select the two clusters from these large number of clusters for merging . The merging will be based on some similarity between each of the existing cluster pairs, to find the similarity between the existing cluster we need to consider the variance of each individual clusters and also the distance between the two cluster centers. We need to develop an algorithm which can merge the similar looking clusters based on similarity criteria.
IV. RESEARCH METHODOLOGY
International Journal of Research (IJR)
e-ISSN: 2348-6848, p- ISSN: 2348-795X Volume 2, Issue 07, July 2015Available at http://internationaljournalofresearch.org
is the best clustering by finding the minimum value for our measure. Validity measure is simply the ratio of intra cluster distance measure to the inter cluster distance, intra cluster distance is defined as the distance between a point and its cluster centre within a cluster whereas inter cluster distance is the distance between the two clusters. While performing the image segmentation for a given input image we first will regroup the pixels together to form a set of coherent image regions. After taking color image as input we first calculate the total number of pixels in the image. For the similarity of the pixels, we can measure it on the basis of different feature like intensity, color, texture, local entropy, etc. but here in the proposed algorithm we will take three color feature for the similarity of the pixels. Individual features or the combinations of them can be used to represent an image pixel. Hence we can associate a feature vector x to each of the pixel of input image. Clustering will be then performed on the set of feature vectors so as to group them. Finally clustering result will be mapped back to the original spatial domain to obtain the segmented image.
For image segmentation of image we have used an agglomerative bottom-up algorithm in which similar pixels are merged to one cluster. Colored images have three color-features; red green and blue. For image segmentation, first of all, the image is flattened in 2-dimensional array having columns representing three basic colors. Then flattened image is clustered using
some clustering algorithm such as
PSO.Although K-means is most used algorithm for image segmentation but the main disadvantage of the k-means algorithm is
that the number of clusters, K, must be
supplied as a parameter. There are several ways to find the optimal number of clusters like Davies-Bouldin index or some other
validity measure [1]. To find the optimal number of cluster we have used a validity measure which is based on intra-cluster and inter-cluster distance measures. An intra-cluster distance measure is the distance between a point and its cluster center. An inter-cluster distance is the distance between clusters’ center. Smallest of these inter-cluster distances is considered. A validity index is taken as
𝑉𝑎𝑙𝑖𝑑𝑖𝑡𝑦𝑖𝑛𝑑𝑒𝑥=
𝐴𝑣𝑔(𝐼𝑛𝑡𝑟𝑎 −𝑐𝑙𝑢𝑠𝑡𝑒𝑟 𝐷𝑖𝑠𝑡𝑎𝑛𝑐𝑒 𝑀𝑒𝑎𝑠𝑢𝑟𝑒𝑠)
𝑚𝑖𝑛(𝐼𝑛𝑡𝑒𝑟 −𝑐𝑙𝑢𝑠𝑡𝑒𝑟 𝐷𝑖𝑠𝑡𝑎𝑛𝑐𝑒 𝑀𝑒𝑎𝑠𝑢𝑟𝑒𝑠) (1)
Clustering which gives a min value for validity measure will give the ideal value of optimum number of clusters k. Once optimum number of clusters is selected then merge algorithm is followed in which first k number of clusters is formed using PSO. Now out of these k clusters two most similar clusters are selected and then merged reducing the total number of clusters to k-1. The similar procedure is formed till number of cluster reduces to optimum number which we have already found using PSO algorithm and validity index. The complete methodology can be explained in the following steps.
Step 1: First optimum number of clusters is
found using PSO algorithm and validity index. The number of cluster giving lowest value of validity index is optimum number of clusters.
Step2: Segment the image in large number of
clusters using k-means. If n is optimum number of cluster given by step1 then k>>n.
Step3: Then two clusters are selected for
International Journal of Research (IJR)
e-ISSN: 2348-6848, p- ISSN: 2348-795X Volume 2, Issue 07, July 2015Available at http://internationaljournalofresearch.org
cluster, the variance of the merged cluster and the distance between two cluster centers as given in the following section. It reduces the number of clusters to k-1.
Step4: Repeat step3 until k==n.
Davies–Bouldin index
The Davies–Bouldin index introduced by David L. Davies and Donald W. Bouldin in 1979 is a metric for evaluating clustering algorithms [1]. This is an internal evaluation scheme, where the validation of how well the clustering has been done is made using quantities and features inherent to the dataset. The Davies–Bouldin index can be calculated by the following formula:
Let C1 , C2 ……….Ck be the
cluster then DB measure is defined as
𝐷𝐵 =1
𝑘 𝑅𝑖
𝑘
𝑖=0 …
(2)
Where 𝑅𝑖 = max𝑖≠𝑗 𝑅𝑖𝑗 𝑎𝑛𝑑𝑗 = 1,2,…k
𝑅𝑖𝑗 = 𝜎𝑖
2+𝜎
𝑗2 𝑑𝑖𝑗2
(3)
Where 𝜎𝑖2 & 𝜎𝑗2 are the variance of cluster Ci and Cj .
Since algorithms that produce clusters with low intra-cluster distances (high intra-cluster similarity) and high inter-cluster distances (low inter-cluster similarity) will have a low
Davies–Bouldin index, the clustering
algorithm that produces a collection of clusters with the smallest Davies–Bouldin index is considered the best algorithm based on this criterion. This is value is considered as the validity index as explained in the previous section.
For finding similarity measures, first of all, we will find the variance of each cluster and then square distance between each point and cluster center. We also need to find the compound
variance (comp_mu), feature distance,
compound mean (comp_nu), compound cluster variance (comp_var). Now the similarity between two cluster (i and j) are the mod of cluster variance of i _ the cluster variance of j – the multiplication of compound variance of both cluster and the square distance between them divided by N, where N is the max of square distance between the two clusters.
Part i cl e S warm Optim i zat i on (PS O) based cl ust erin g
PSO is a population-based a biologically inspired algorithm which applies to concept of social interaction to problem solving where each individual is referred to as particle and represents a candidate solution. Each particle in PSO flies through the search space with an adaptable velocity that is dynamically modified according to its own flying experience and also flying experience of other particles using the following equations.
(4)
(5)
Where is a velocity vector at t+1 time for i
particle in dth dimension, position vector
at t+1 time for ith particle in d dimension, are random number generators. and are are learning rates governing the cognition
and social components. represents the
International Journal of Research (IJR)
e-ISSN: 2348-6848, p- ISSN: 2348-795X Volume 2, Issue 07, July 2015Available at http://internationaljournalofresearch.org
particles gradually focusing the PSO into a local search.
Following steps illustrate the overall optimization scheme of PSO.
STEP1: Initialize the particle population by
randomly assigning locations (X-vector for each particle) and velocities (V-vector with random or zero velocities- in our case it is initialized with zero vector)
STEP2: Evaluate the fitness of the individual
particle and record the best fitness Pbest for each particle till now and update P-vector related to each Pbest.
STEP3: Also find out the individuals’ highest
fitness Gbest and record corresponding position pg.
STEP4: Modify velocities based on Pbest and
Gbest position using eq4.
STEP5: Update the particles position using eq5.
STEP6: Terminate if the condition is met
STEP7: Go to Step 2
In equation (1) above, new velocity at t+1 is generated with the help of global fitness which all the particles have achieved till iteration t. In this equation, (given in bold) is position given by the global best fitness in dimension d. usually, global best fitness concept is expected to give a global search exploration possibilities in the search space.
V. RESULTS & ANALYSIS
For finding the performance & result analysis,
four jpeg images are selected for
demonstration. The original images are given in table 1. These images are selected due to their varying features such as background
image, number of colors etc. If an image which is represented with less number of colors should not be segmented in high number of clusters and an image which is made of high numbers of colors should be represented with sufficient number of clusters so that its outlines is visible clearly. The cartoon image is made of only few colors without any significant background. Car also has less colors but with a clearly visible and outlined background. The rose image is having large colors with less visible background image. The Lena image is most used in color processing.
In first step as explained in algorithm in the previous section, PSO is used with different k values. We have taken range of k from 3 to 20 in our experimentation. The affectivity of clustering is measured by a validity index. The least value of this is desired. At the end of this step these validity index is plotted and the k-value which is giving least k-value is taken as the optimum number of clusters. In the second steps k-value is taken very high. In our experimentation this value is fixed as 50. Higher the value of k is there better
segmentation can be achieved. This
International Journal of Research (IJR)
e-ISSN: 2348-6848, p- ISSN: 2348-795X Volume 2, Issue 07, July 2015Available at http://internationaljournalofresearch.org
Table 1: Experimentation Results
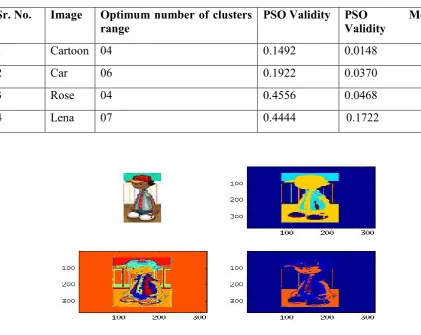
Figure 1. Experimentation Results of Cartoon image (a) Original Image (b)PSO clustering with
optimum cluster 4 with validity index 0.1492 (c) PSO clustering with cluster 30 (d) PSO merging based clustering with optimum cluster 5 with validity index 0.0148
If we analyze the result from table, we can easily find out that merge algorithm outperform simple PSO algorithm if validity index criterion is followed. First image, the cartoon is simplest one made of only few colors and is without any background. Both methods PSO as well as PSO based merge algorithm performs well but later outperform simple PSO in all ten experiments. For each figure we have experimented 10 times. Similar is the case with car image. In Rose image experiments, two times out of ten experiments, PSO performs better only when number of optimum cluster is more than eight. This may be due to unclear background in the image. In every experiment, merge based algorithm perform far better as compared to PSO algorithm. So, through our experiments we have found that merging based algorithm is better than PSO if we use a Davies-Bouldin Similarity measure.
Sr. No. Image Optimum number of clusters
range PSO Validity PSO Validity Merge
1 Cartoon 04 0.1492 0.0148
2 Car 06 0.1922 0.0370
3 Rose 04 0.4556 0.0468
International Journal of Research (IJR)
e-ISSN: 2348-6848, p- ISSN: 2348-795X Volume 2, Issue 07, July 2015Available at http://internationaljournalofresearch.org
Figure 2. Experimentation Results of Car image (a) Original Image (b) PSO clustering with
optimum cluster 6 with validity index 0.1922 (c) PSO clustering with cluster 50 (d) merging based clustering with optimum cluster 6 with validity index 0.0370
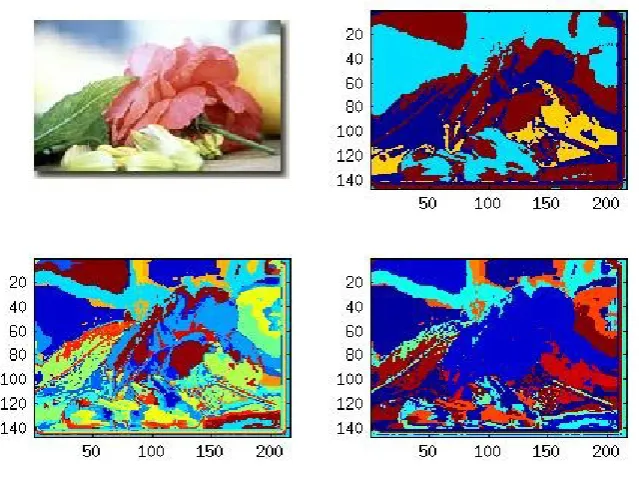
Figure 3. Experimentation Results of Rose image (a) Original Image (b) PSO clustering with
optimum cluster 4 with validity index 0.4556 (c) PSO clustering with cluster 30 (d) merging based clustering with optimum cluster 5 with validity index 0.0468
(a)
(c)
(b)
International Journal of Research (IJR)
e-ISSN: 2348-6848, p- ISSN: 2348-795X Volume 2, Issue 07, July 2015Available at http://internationaljournalofresearch.org
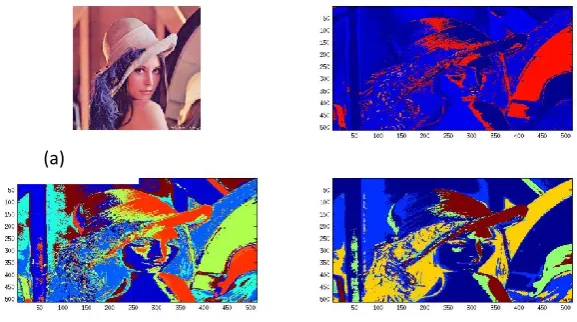
Figure 4. Experimentation Results of Lena image (a) Original Image (b) PSO clustering with
optimum cluster 7 with validity index 0.4444 (c) PSO clustering with cluster 50 (d) merging based clustering with optimum cluster 7 with validity index 0.1722
VI. CONCLUSION & FUTURE
SCOPE
The paper proposes an improved method of image segmentation by using PSO and merge algorithm of image segmentation where similarity measure is taken from Davies-Bouldin Index. The PSO algorithm is used to find optimum number of clusters and then this value is used as a limiting value in merge algorithm. The performance of algorithm is measured using a validity index which is measured by two factors. The first factor is intra-cluster distance whose minimum value is desired and another is inter-cluster distance for which a maximum value is required. Once optimum number of cluster is found then PSO clustering algorithm is again applied to generate large number of clusters, then from these large numbers of clusters, pair of clusters with most similar characteristics are merged iteratively until number of clusters are reduced up to optimum number of clusters.
Four images have been taken for
experimentations. More than 95% of times the proposed PSO based merge algorithm is performing better than simple PSO algorithm.
In future other similarity measures can be
tested for merge algorithm. Image
characteristics also need to be explored to find how its various characteristics effect segmentation. Another problem with PSO is that it is too slow so we need to employ other meta heuristic methods which are faster than PSO.
REFERENCES:
[1] Davies, David L.; Bouldin, Donald W.
(1979). "A Cluster Separation Measure". IEEE Transactions on Pattern Analysis and Machine Intelligence. PAMI-1 (2): 224–227. doi:10.1109/TPAMI.1979.4766909.
[2] S.K Somasundaram, P.Alli,‖ A
Review on Recent Research and
Implementation Methodologies on Medical Image Segmentation‖, Journal of Computer Science 8(1): 170-174, 2012.
[3] Robert Tibshirani, Guenther Walther
and Trevor Hastie, ―Estimating the Number of Data Clusters via the Gap Statistic‖ J.R. Statist. Soc. B (2001), 63, pp. 411—423
[4] Bo Peng, Lei Zhang , David Zhang,
―Automatic Image Segmentation by
Dynamic Region Merging‖, IEEE
International Journal of Research (IJR)
e-ISSN: 2348-6848, p- ISSN: 2348-795X Volume 2, Issue 07, July 2015Available at http://internationaljournalofresearch.org
Transactions on image processing,Vol.20, No. 12 December 2011.
[5] National Programme on Technology
Enhanced learning
http://nptel.iitm.ac.in/courses/106105032/38.
[6] F. C. Monteiro and A. Campilho,
"Watershed framework to region-based image segmentation," in Proc. International Conference on Pattern Recognition, ICPR 19th, pp. 1-4, 2008.
[7] R. Patil and K. Jondhale, "Edge based
technique to estimate number of clusters in k-means color image segmentation," in Proc. 3rd IEEE International Conference on
Computer Science and Information
Technology (ICCSIT), pp. 117-121, 2010.
[8] W. Cui and Y. Zhang, "Graph based
multispectral high resolution image
segmentation," in Proc. International
Conference on Multimedia Technology (ICMT), pp. 1-5, 2010.
[9] A. Fabijanska, "Variance filter for
edge detection and edge-based image
segmentation," in Proc. International
Conference on Perspective Technologies
and Methods in MEMS Design
(MEMSTECH), pp. 151-154, 2011.
[10] M. J. Islam, S. Basalamah, M.
Ahmadi, and M. A. S. hmed, "Capsule image segmentation in pharmaceutical applications using edge-based techniques,"
IEEE International Conference on
Electro/Information Technology (EIT), pp. 1-5, 2011.
[11] L. Yucheng and L. Yubin, "An
algorithm of image segmentation based on
fuzzy mathematical morphology," in
International Forum on Information
Technology and Applications, IFITA'09, pp. 517-520, 2009.
[12] S. Kobashi and J. K. Udupa, "Fuzzy
object model based fuzzy connectedness
image segmentation of newborn brain MR images," in Proc. IEEE International Conference on Systems, Man, and Cybernetics (SMC), pp. 1422-1427, 2012.
[13] R. Samet, S. E. Amrahov, and A. H.
Ziroglu, "Fuzzy rule-based image
segmentation technique for rock thin section images," in Proc. 3rd International Conference on Image Processing Theory, Tools and Applications (IPTA), pp. 402-406, 2012.
[14] M. R. Khokher, A. Ghafoor, and A. M.
Siddiqui, "Image segmentation using fuzzy rule based system and graph cuts," in Proc. 12th International Conference on Control Automation Robotics & Vision (ICARCV), pp. 1148-1153, 2012.
[15] A. Fabijanska, "Variance filter for
edge detection and edge-based image
segmentation," in Proc. International
Conference on Perspective Technologies
and Methods in MEMS Design
(MEMSTECH), pp. 151-154, 2011.
[16] J. Xiao, B. Yi, L. Xu, and H. Xie, "An
image segmentation algorithm based on level set using discontinue PDE," in Proc. First International Conference on Intelligent
Networks and Intelligent Systems,
ICINIS'08., pp. 503-506, 2008.
[17] F. Zhang, S. Guo, and X. Qian,
"Segmentation for finger vein image based on PDEs denoising," in Proc. 3rd International Conference on Biomedical Engineering and Informatics (BMEI), pp. 531-535, 2010.
[18] W. Zhao, J. Zhang, P. Li, and Y. Li,