Taxonomy Induction Using Hierarchical Random Graphs
Trevor FountainandMirella Lapata Institute for Language, Cognition and Computation
School of Informatics, University of Edinburgh 10 Crichton Street, Edinburgh EH8 9AB
[email protected], [email protected]
Abstract
This paper presents a novel approach for in-ducing lexical taxonomies automatically from text. We recast the learning problem as that of inferring a hierarchy from a graph whose nodes represent taxonomic terms and edges their degree of relatedness. Our model takes this graph representation as input and fits a taxonomy to it via combination of a maximum likelihood approach with a Monte Carlo Sampling algorithm. Essentially, the method works by sampling hierarchical struc-tures with probability proportional to the like-lihood with which they produce the input graph. We use our model to infer a taxonomy over 541 nouns and show that it outperforms popular flat and hierarchical clustering algo-rithms.
1 Introduction
The semantic knowledge encoded in lexical re-sources such as WordNet (Fellbaum, 1998) has been proven beneficial for several applications including question answering (Harabgiu et al., 2003), doc-ument classification (Hung et al., 2004), and tex-tual entailment (Geffet and Dagan, 2005). As the effort involved in creating such resources manu-ally is prohibitive (cost, consistency and coverage are often cited problems) and has to be repeated for new languages or domains, recent years have seen increased interest in automatic taxonomy in-duction. The task has assumed several guises, such as term extraction — finding the concepts of the taxonomy (Kozareva et al., 2008; Navigli et al., 2011), term relation discovery— learning whether any two terms stand in an semantic relation such as
IS-A, orPART-OF(Hearst, 1992; Berland and Char-niak, 1999), and taxonomy construction —- creat-ing the taxonomy proper by organizcreat-ing its terms hi-erarchically (Kozareva and Hovy, 2010; Navigli et al., 2011). Previous work has also focused on the complementary task of augmenting an existing tax-onomy with missing information (Snow et al., 2006; Yang and Callan, 2009).
In this paper we propose an unsupervised ap-proach to taxonomy induction. Given a corpus and a set of terms, our algorithm jointly induces their re-lations and their taxonomic organization. We view taxonomy learning as an instance of the problem of inferring a hierarchy from a network or graph. We create this graph from unstructured text simply by drawing an edge between distributionally sim-ilar terms. Next, we fit a Hierarchical Random Graph model (HRG; Clauset et al. (2008)) to the observed graph data based on maximum likelihood methods and Markov chain Monte Carlo sampling. The model essentially works by sampling hierarchi-cal structures with probability proportional to the likelihood with which they produce the input graph. This is advantageous as it allows us to consider the ensemble of random graphs that are statistically sim-ilar to the original graph, and through this to de-rive a consensus hierarchical structure from the en-semble of sampled models. The approach differs crucially fromhierarchical clusteringin that it ex-plicitly acknowledges that most real-world networks have many plausible hierarchical representations of roughly equal likelihood and does not seek a sin-glehierarchical representation for a given network. This feature also bodes well with the nature of lexi-cal taxonomies: there is no uniquely correct taxon-omy for a set of terms, rather different taxonomies
are likely to be appropriate for different tasks and different taxonomization criteria.
Our contributions in this paper are three-fold: we adapt the HRG model to the taxonomy induction task and show that its performance is superior to al-ternative methods based on either flat or hierarchi-cal clustering; we analyze the requirements of the algorithm with respect to the input graph and the semantic representation of its nodes; and introduce new ways of evaluating the fit of an automatically induced taxonomy against a gold-standard. In the following section we provide an overview of related work. Next, we describe our HRG model in more detail (Section 3) and present the resources and eval-uation methodology used in our experiments (Sec-tion 4). We conclude the paper by presenting and discussing our results (Sections 4.1–4.4).
2 Related Work
The bulk of previous work has focused on term re-lation discovery following essentially two method-ological paradigms, pattern-based bootstrapping and clustering. The former approach (Hearst, 1992; Roark and Charniak, 1998; Berland and Charniak, 1999; Girju et al., 2003; Etzioni et al., 2005; Kozareva et al., 2008) utilizes a few hand-crafted seed patterns representative of taxonomic relations (e.g., IS-A, PART-OF,SIBLING) to extract instances from corpora. These instances are then used to ex-tract new patterns which are in turn used to find new instances and so on. Clustering-based approaches have been mostly employed to discover IS-A and
SIBLINGrelations (Lin, 1998; Caraballo, 1999; Pan-tel and Ravichandran, 2004). A common assump-tion is that words are related if they occur in similar contexts and thus clustering algorithms group words together if they share contextual features. Most of these algorithms aim at inducing flat clusters rather than taxonomies, with the exception of Brown et al. (1992) whose method induces binary trees.
Contrary to the plethora of algorithms developed for relation discovery, methods dedicated to taxon-omy learning have been few and far between. Cara-ballo (1999) was the first to induce a taxonomy from a corpus using a combination of clustering and pattern-based methods. Specifically, nouns are orga-nized into a tree using a bottom-up clustering algo-rithm and internal nodes of the resulting tree are la-beled with hypernyms from the nouns clustered un-derneath using patterns such as “B is a kind of A”.
Kozareva et al. (2008) and Navigli et al. (2011) both develop systems that create taxonomies end-to-end, i.e., discover the terms, their relations, and how these are hierarchically organized. The two ap-proaches are conceptually similar: they both use the web and pattern-based methods for finding domain-specific terms. Additionally, in both approaches the acquired knowledge is represented as a graph from which a taxonomy is induced using task-specific al-gorithms such as graph pruning, edge weighting, and so on.
Our work also addresses taxonomy learning, how-ever, without the term discovery step — we assume we are given the terms for which to create a taxon-omy. Similarly to Kozareva et al. (2008) and Nav-igli et al. (2011), our model operates over a graph whose nodes represent terms and edges their rela-tionships. We construct this graph from a corpus simply by taking account of the distributional sim-ilarity of the terms in question. Our taxonomy in-duction algorithm is conceptually simpler and more general; it fits a taxonomy to the observed network data using the tools of statistical inference, combin-ing a maximum likelihood approach with a Monte Carlo Sampling algorithm. The technique allows us to sample hierarchical random graphs with probabil-ity proportional to the likelihood that they generate the observed network. The induction algorithm can operate over any kind of (undirected) graph, and thus does not have to be tuned specifically for different inputs. We should also point out that our formula-tion of the inference problem utilizes very little cor-pus external knowledge other than the set of input terms, and could thus be easily applied to domains or languages where lexical resources are scarce.
A B C
D E
F
(a) Input graph
1.00
1.00 C
A B
1.00
E F
0.11
0.50
D
(b) Binary tree
C A B
E F
D
(c) Hierarchy
A B
C D E F
[image:3.612.106.495.66.176.2](d) Clusters
Figure 1: Flow of information through the Hierarchical Random Graph algorithm. From a semantic net-work (1a), the model constructs a binary tree (1b). Edges in the semantic netnet-work are then used to compute theθparameters for internal nodes in the tree; the maximum-likelihood-estimatedθparameter for an internal node indicates the density of edges between its children. This tree is then resampled using theθparameters (1b) until the MCMC process converges, at which point it can be collapsed into an-ary hierarchy (1c). The same collapsing process can be also used to identify a flat clustering (1d).
A B C A
B C A
B
C
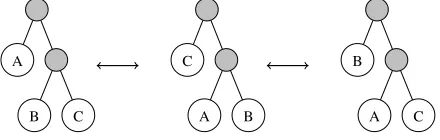
Figure 2: Any internal node with subtrees A, B and C can be permuted to one of two possible alter-nate configurations. Shaded nodes represent internal nodes which are unmodified by such permutation.
3 The Hierarchical Random Graph Model
A HRG consists of a binary tree and a set of likeli-hood parameters, and operates on input organized into a semantic network, an undirected graph in which nodes represent terms and edges between nodes indicate a relationship between pairs of terms (Figure 1a). From this representation, the model constructs a binary tree whose leaves correspond to nodes in the semantic network (Figure 1b); the model then employs a simple Markov chain Monte Carlo (MCMC) process in order to explore the space of possible binary trees and derives a consensus hi-erarchical structure from the ensemble of sampled models (Figure 1c).
3.1 Representing a Hierarchical Structure
Formally, we denote a semantic networkS= (V,E), whereV ={v1,v2. . .vn} is the set of vertices, one
per term, and E is the set of edges between terms in whichEa,b indicates the presence of an edge
be-tweenvaandvb.
Given a network S, we construct a binary treeD
whose n leaves correspond toV and whose n−1 internal nodes denote a hierarchy overV. Because the leaves remain constant for a givenS, we define
D as the set of internal nodes D={D1,D2. . .Dn}
and associate each edge Ea,b ∈E with an internal
nodeDibeing the lowest common parent ofa,b∈V.
The core assumption underlying the HRG model is that edges inShave a non-uniform and independent probability of existing. Each possible edgeEa,b∈E
exists with a probability θi, where θi is associated
with the corresponding internal nodeDi.
For a given internal nodeDi, letLi andRi be the
number of leaves inDi’s left and right subtrees,
re-spectively; letEibe the number of edges inE
asso-ciated withDi(colloquially, the number of edges in
Sbetween leaves inDi’s left and right subtrees). For
eachDi∈D, we can estimate the maximum
likeli-hood for the correspondingθi asθi=LEi
iRi. The
like-lihood
L
(D,θ|S) of a HRG over a given semantic networkSis then given by:L
(D,θ|S) =n−1
∏
i=1
(θi)Ei(1−θi)LiRi−Ei (1)
3.2 Markov Chain Monte Carlo Sampling
Given a representation for a HRG
H
(D,θ) and a method for estimating the likelihood of a given D [image:3.612.80.300.271.341.2]Algorithm 1: MCMC Sampling
Compute the likelihood
L
(D,θ)of the current1
binary tree.
Pick a random internal nodeDi∈D.
2
Randomly permuteDiaccording to Figure 2.
3
Compute the likelihood ˆ
L
(D,θ)of the modified4
binary tree.
if
L
ˆ(D,θ)>L
(D,θ)then5
accept the transition;
6
else
7
accept with probability ˆ
L
(D,θ)/L
(D,θ)8
(i.e., standard Metropolis acceptance). end
9
Repeat;
10
this process we randomly select a node within the tree and permute it according to Figure 2. If this permutation improves the overall likelihood of the dendrogram we accept it as a transition, otherwise it is accepted with a probability proportional to the de-gree to which it decreases the overall likelihood (i.e. standard Metropolis acceptance). This procedure is described in more detail in Algorithm 1.
3.3 Consensus Hierarchy
Once the MCMC process has converged, the model is left with a binary tree over the terms from the input semantic network. As in standard hierarchical clus-tering, however, this imposes an arbitrary structure which may or may not correspond to the observed data — the tree at convergence will be similar to an ideal tree given the graph, but may not be the most plausible structure. Indeed, for taxonomy induction it is quite unlikely that a binary tree will provide the most appropriate categorization.
To avoid encoding such bias we employ a model averaging technique to produce a consen-sus hierarchy. For a set of binary trees sam-pled after convergence, we first identify the set of possible clusters encoded in the tree, e.g., the binary tree in Figure 1b encodes the clusters
{AB,ABC,EF,D,DEF,ABCDEF}.As in Clauset et al. (2008), each cluster instance is then weighted according to the likelihood of the originating HRG (Equation 1); we then sum the weights for each dis-tinct cluster across all resampled trees and discard those whose aggregate weight is lower than 50% of the total observed weight. The remaining clusters are then used to reconstruct a hierarchy in which
Algorithm 2: Flat Clusters LetDkbe the root node ofD.
1
ifθk>θ¯ then
2
output the leaves of the subtree rooted atDk
3
as a cluster else
4
repeat 2 with left and right children ofDk.
5
end
6
each subtree appears in the majority of trees ob-served after the sampling process has reached con-vergence, hence the term consensus hierarchy.
3.4 Obtaining Flat Clusters
For evaluation purposes we may want to compare the groupings created by the HRG to a simpler non-hierarchical clustering algorithm (see Section 4 for details). We thus defined a method of converting the tree produced by the HRG into a flat (hard) clus-tering. This can be done in a relatively straightfor-ward, principled fashion using the HRG’sθ parame-ters. For a given
H
(D,θ)we identify internal nodes whoseθk likelihood is greater than the meanlikeli-hood and who possess no parent node whoseθk
like-lihood is also greater than the mean. Each such node is the root of a densely-connected subtree; each such subtree is then assumed to represent a single discrete cluster of related items, where ¯θ=mean(θ) (illus-trated in Figure 1c). This procedure is explained in greater detail in Algorithm 2.
4 Evaluation
Data We evaluated our taxonomy induction algo-rithm using McRae et al.’s (2005) dataset which consists of for 541 basic level nouns (e.g., DOG
andTABLE). Each noun is associated with features (e.g.,has-legs,is-flat, andmade-of-woodforTABLE) collected from human participants in multiple stud-ies over several years. The original norming study does not include class labels for these nouns, how-ever, we were able to exploit a clustering provided by Fountain and Lapata (2010), in which a set of on-line participants annotated each of the McRae et al. nouns with basic category labels.
-URALOBJECT>PHYSICALOBJECT>ENTITY(a
total of 493 concepts appear in both). These hyper-nym paths were then combined to yield a full tax-onomy over McRae et al.’s nouns; internal nodes having only a single child were recursively removed to produce a final, compact taxonomy1 containing 186 semantic classes (e.g., ANIMALS, WEAPONS, FRUITS) organized into varying levels of granular-ity (e.g.,SONGBIRDS>BIRDS>ANIMALS).
Evaluation measures Evaluation of taxonomi-cally organized information is notoriously hard (see Hovy (2002) for an extensive discussion on this topic). This is due to the nature of the task which is inherently subjective and application specific (e.g., a dolphin can be a Mammal to a biologist, but a Fish to a fisherman or someone visiting an aquarium). Nevertheless, we assessed the taxonomies produced by the HRG against the WordNet-like taxonomy de-scribed above using two measures, one that sim-ply evaluates the grouping of the nouns into classes without taking account of their position in the taxon-omy and one which evaluates the taxontaxon-omy directly. To evaluate a flat clustering into classes we use the F-score measure introduced in the SemEval 2007 task (Agirre and Soroa, 2007); it is the harmonic mean of precision and recall defined as the number of correct members of a cluster divided by the num-ber of items in the cluster and the numnum-ber of items in the gold-standard class, respectively. Although informative, evaluation based solely on F-score puts the HRG model at a comparative disadvantage as the task of taxonomy induction is significantly more dif-ficult than simple clustering. To overcome this dis-advantage we propose an automatic method of eval-uating taxonomies directly by first computing the walk distance between pairs of terms that share a gold-standard category label within a gold-standard and a candidate taxonomy, and then computing the pairwise correlation between distances in each tree (Lapointe, 1995). This captures the intuition that a ‘good’ hierarchy is one in which items appearing near one another in the gold taxonomy also appear near one another in the induced one. It is also con-ceptually similar to the task-based IS-A evaluation (Snow et al., 2006) which has been traditionally used to evaluate taxonomies.
Formally, letG={g0,1,g0,2. . .gn,n−1}, wherega,b
indicates the walk distance between terms a andb
1The taxonomy and flat cluster labels are available from http://homepages.inf.ed.ac.uk/s0897549/data.
in the gold standard hierarchy. Similarly, letC= {c0,1,c0,2. . .cn,n−1}, where ca,b is the distance
be-tweenaandbin the candidate hierarchy. The tree-height correlation betweenG andC is then given by Spearman’sρcorrelation coefficient between the two sets. All tree-height correlations reported in our experiments were computed using the WordNet-based gold-standard taxonomy over McRae et al.’s (2005) nouns.
Baselines We compared the HRG output against three baselines. The first is Chinese Whispers (CW; Biemann (2006)), a randomized graph-clustering al-gorithm which like the HRG also takes as input a graph with weighted edges. It produces a hard (flat) clustering over the nodes in the graph, where the number of clusters is determined automatically. Our second baseline is Brown et al.’s (1992) agglomer-ative clustering algorithm that induces a mapping from word types to classes. It starts withK classes for the K most frequent word types and then pro-ceeds by alternately adding the next most frequent word to the class set and merging the two classes which result in the least decrease in the mutual in-formation between class bigrams. The result is a class hierarchy with word types at the leaves. Ad-ditionally, we compare against standard agglomer-ative clustering (Sokal and Michener, 1958) which produces a binary dendrogram in a bottom-up fash-ion by recursively identifying concepts or clusters with the highest pairwise similarity.
In the following, we present our taxonomy induc-tion experiments (Secinduc-tions 4.1–4.3). Since HRGs provide a means of inducing a hierarchy over a graph-based representation, which may be con-structed in an arbitrary fashion, our experiments were designed to investigate how the topology and quality of the input graph influences the algorithm’s performance. We thus report results when the se-mantic network is created from data sources of vary-ing quality and granularity.
4.1 Experiment 1: Taxonomy Induction from Feature Norms
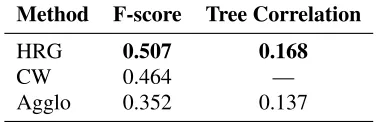
dimen-Method F-score Tree Correlation
HRG 0.507 0.168
CW 0.464 —
[image:6.612.91.279.59.120.2]Agglo 0.352 0.137
Table 1: Cluster F-score and tree-height correla-tion evaluacorrela-tion; a semantic network constructed over McRae et al.’s (2005) nouns and features is given as input to the algorithms.
sion was taken to be the frequency with which par-ticipants generated the corresponding feature when given the term. For each pair of terms an edge was added to the semantic network if the cosine similar-ity between their vector representations exceeded a fixed thresholdT (set to 0.15).
The resulting network was then provided as in-put to the HRG, which was resampled until con-vergence. The binary tree at convergence was col-lapsed into a hierarchy over clusters using the pro-cedure described in Section 3.4; this hierarchy was evaluated by computing the cluster F-score between its constituent clusters and those of a gold-standard (human-produced) clustering. The resulting consen-sus hierarchy was evaluated by computing the tree-height correlation between it and the gold-standard (WordNet-derived) hierarchy.
Results Our results are summarized in Table 1. We only give the tree correlation for the HRG and agglomerative methods (Agglo) as CW does not in-duce a hierarchical clustering. In addition, we do not compare against Brown et al. (1992) as the in-put to this algorithm is not vector-based. When evaluated using F-score, the HRG algorithm pro-duces better quality clusters compared to CW, in addition to being able to organize them hierarchi-cally. It also outperforms agglomerative clustering by a large margin. A similar pattern emerges when the HRG and Agglo are evaluated on tree correla-tion. The taxonomies produced by the HRG are a better fit against the WordNet-based gold standard; the difference in performance is statistically signif-icant (p<0.01) using at-test (Cohen and Cohen., 1983).
4.2 Experiment 2: Taxonomy Induction from the British National Corpus
Method The results of Experiment 1 can be con-sidered as an upper bound of what can be achieved by the HRG when the input graph is constructed
from highly accurate semantic information. Feature norms provide detailed knowledge about meaning which would be very difficult if not close to impos-sible to obtain from a corpus. Nevertheless, it is interesting to explore how well we can induce tax-onomies using a lower quality semantic network. We therefore constructed a network based on co-occurrence statistics computed from the British Na-tional Corpus (BNC, 2007) and provided the result-ing semantic network as input to the HRG, CW, and Agglo models; additionally, we employed the algorithm of Brown et al. (1992) to induce a hier-archy over the target terms directly from the cor-pus. Unfortunately, this algorithm requires the num-ber of desired output clusters to be specified in ad-vance; in all trials this parameter was set to the num-ber of clusters in the gold-standard clustering (41), thus providing the Brown-induced clusterings with a slight oracle advantage.
Again, nouns were represented as vectors in se-mantic space. We used a context window of five words on either side of the target word and 5,000 vector components corresponding to the most fre-quent non-stopwords in the BNC. Raw frequency counts were transformed using pointwise mutual in-formation (PMI). An edge was added to the seman-tic network between a pair of nouns if their simi-larity exceeded a predefined threshold (the same as in Experiment 1). The similarity of two nouns was defined as the cosine distance between their corre-sponding vectors.
The HRG algorithm was used to produce a tax-onomy from this network and was also compared against Brown et al. (1992). The latter induces a hi-erarchy from a corpus directly, without the interme-diate graph representation. All resulting taxonomies were evaluated against gold standard flat and hierar-chical clusterings, again as in Experiment 1.
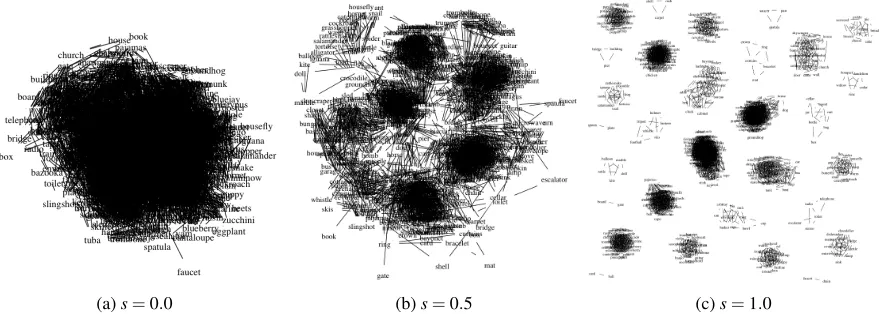
(a)s=0.0 (b)s=0.5 (c)s=1.0
Figure 3: The original semantic network as derived from the BNC (a) and the same network re-weighted using a flat clustering produced by CW (b). Assapproaches 1.0 the network exhibits an increasingly strong small-world property, eventually reconstructing the input clustering only (c).
Method F-score Tree Correlation
HRG 0.276 0.104
CW 0.274 —
[image:7.612.94.278.270.344.2]Brown 0.258 0.124 Agglo 0.122 0.077
Table 2: Cluster F-score and tree-height correla-tion evaluacorrela-tion for taxonomies inferred over McRae et al.’s (2005) nouns; all algorithms are run on the BNC.
Performance of the HRG is better when the se-mantic network is based on feature norms (compare Tables 1 and 2), both in terms of tree-height correla-tion and F-score. This suggests that the algorithm is highly dependent on the quality of the semantic net-work used as input. In particular, HRGs are known to be more appropriate for so-called small-world
networks, graphs composed of densely-connected subgraphs with relatively sparse connections be-tween (Klapaftis and Manandhar, 2010). Indeed, in-spection of the semantic network produced from the BNC (see Figure 3a) shows that our corpus-derived graph is emphaticallynot a small-world graph, yet the HRG is able to recover some taxonomic infor-mation from such a densely-connected network.
In the following experiments we first assess the difficulty of the taxonomy induction task to get a feel of how well the algorithms are performing in comparison to humans and then investigate ways of rendering the BNC-based graph more similar to a small-world network.
4.3 Experiment 3: Human Upper Bound
Method The previous experiments evaluated the performance of the HRG against a gold-standard hierarchy derived from WordNet. For any set of concepts there will exist multiple valid taxonomies, each representing an accurate if differing organiza-tion of identical concepts using different criteria; for the set of concepts used in Experiments 1–2 the WordNet hierarchy represents merely one of many valid hierarchies. Noting this, it is interesting to ex-plore how well the hierarchies output by the model fit within the set ofpossible, validtaxonomies over a given set of concepts.
We thus conducted an experiment in which hu-man participants were asked to organize words into arbitrary hierarchies. To render the task feasible, they were given a small subset of 12 words rather than the full set of 541 nouns over which the HRG operates. We first selected a sub-hierarchy of the WordNet tree (‘living things’) along with its subtrees (e.g., ‘animals’, ‘plants’), and chose target concepts from within these trees in order to produce a tax-onomy in which some items were differentiated at a high level (e.g., ‘python’ vs. ‘dog’) and others at a fine-grained level (e.g., ‘lion’ vs ‘tiger’). The ex-periment was conducted using Amazon Mechanical Turk2, and involved 41 participants, all self-reported native English speakers. No guidelines as to what features participants were to use when organizing these concepts were provided. Participants were pre-sented with a web-based, graphical, mouse-driven interface for constructing a taxonomy over the
Method Tree Correlation Min Max Std
[image:8.612.319.533.60.119.2]HRG 0.412 -0.039 0.799 0.166 Brown 0.181 0.006 0.510 0.121 Agglo 0.274 -0.056 0.603 0.121 Agreement 0.511 -0.109 1.000 0.267
Table 3: Model performance on a subset of the target words used in Experiments 1–2, applied to a subset of the semantic network used in Experi-ment 2. Instead of a WordNet-derived hierarchy, models were evaluated against hierarchies manually produced by participants in an online study. Tree correlation values are means; we also report the min-imum (Min), maxmin-imum (Max), and standard devia-tion (Std) of the mean.
sen set of concepts.
To evaluate the HRG, along with the baselines from Experiment 2, against the resulting hierarchies we constructed a semantic network over the subset of concepts using similarities derived from the BNC; this network was a subgraph of that used in Exper-iment 2. We computeinter-annotator agreementas the mean pairwise tree-height correlation between the hierarchies our participants produced. We also report for each model the mean tree-height corre-lation between the hierarchy it produced and those created by human annotators.
Results As shown in Table 3, participants achieve a mean pairwise tree correlation of 0.511. This in-dicates that there is a fair amount of agreement with respect to the taxonomic organization of the words in question. The HRG comes close achieving a mean tree correlation of 0.412, followed by Agglo, and Brown. In general, we observe that the HRG man-ages to produce hierarchies that resemble those gen-erated by humans to a larger extent than competing algorithms. The results in Table 3 also hint at the fact that the taxonomy induction task is relatively hard as participants do not achieve perfect agree-ment despite the fact that they are asked to taxon-omize only 12 words.
4.4 Experiment 4: Taxonomy Induction from a Small-world Network
Method In Experiment 2 we hypothesized that a small-world input graph would be more advanta-geous for the HRG. In order to explore this further, we imposed something of a small-world structure on
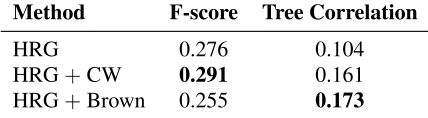
Method F-score Tree Correlation
HRG 0.276 0.104
HRG+CW 0.291 0.161 HRG+Brown 0.255 0.173
Table 4: Cluster F-score and tree-height correlation evaluation for taxonomies inferred by the HRG us-ing semantic network derived from the BNC and re-weighted using CW and Brown.
the BNC semantic network, using a combination of the baseline clustering methods evaluated in Exper-iment 2. Specifically, we first obtain a (flat) cluster-ing uscluster-ing either CW or Brown, which we then use to re-weight the BNC graph given as input to the HRG.3 Note that, as the clustering algorithms used are unsupervised this procedure does not introduce any outside supervision into the overall taxonomy induction task.
The modified weight WbA,B between a pair of
termsA,Bwas computed according to Equation (2), where s indicates the proportion of edge weight drawn from the clustering,WA,B is the edge weight
in the original (BNC) semantic network, andCA,Bis
a binary value indicating thatAandBbelong to the same cluster (i.e.,CA,B=1 ifAandBshare a cluster;
CA,B=0 otherwise).
b
WA,B= (1−s)WA,B+sCA,B (2)
The value of thesparameter was tuned empirically on held-out development data and set tos=0.4 for both CW and Brown algorithms. Each re-weighted network was then used as input to an HRG, and the resulting taxonomies were evaluated in the same manner as in Experiments 1 and 2.
Results Table 4 shows results for cluster F-score and tree-height correlation for the HRG when us-ing a graph derived from the BNC without any modifications, and two re-weighted versions using the CW and Brown clustering algorithms, respec-tively. As can been seen, re-weighting improves tree-height correlation substantially: HRG with CW and Brown is significantly better than HRG on its own (p<0.05). In the case of CW, cluster F-score also yields a slight improvement. Interestingly, the tree-height correlations obtained with CW and Brown are comparable to those attained by the HRG
3We omit agglomerative clustering as it performed poorly
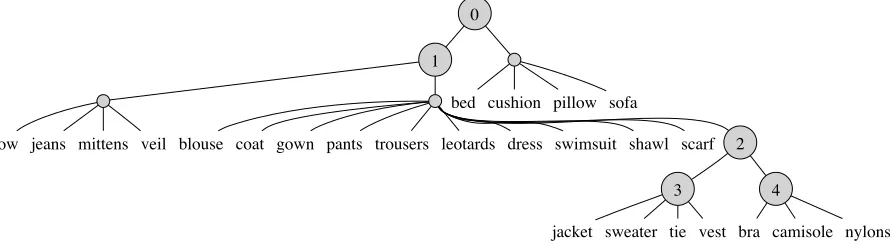
bed cushion pillow sofa
bow jeans mittens veil blouse coat gown pants trousers leotards dress swimsuit shawl scarf
jacket sweater tie vest bra camisole nylons 0
1
2
[image:9.612.86.531.53.176.2]3 4
Figure 4: An excerpt from a hierarchy induced by the HRG, using the BNC semantic network with Brown re-weighting. The HRG does not provide category labels for internal nodes of the hierarchy, but subtrees within this excerpt correspond roughly to (0) TEXTILES, (1)CLOTHING, (2) GENDERED CLOTHING, (3) MEN’SCLOTHING, and (4) WOMEN’SCLOTHING.
when using the human-produced feature norms (dif-ferences in correlations are not statistically signifi-cant). An excerpt of a HRG-induced taxonomy is shown in Figure 4.
5 Conclusions
In this paper we have presented a novel method for automatically inducing lexical taxonomies based on Hierarchical Random Graphs. The approach is con-ceptually simple, taking a graph representation as input and fitting a taxonomy via combination of a maximum likelihood approach with a Monte Carlo Sampling algorithm. Importantly, the approach does not operate on corpora directly, instead it relies on an abstract, interim representation (a semantic net-work) which we argue is advantageous, as it allows to easily encode additional information in the input. Furthermore, the model presented here is largely parameter-free, as both the input graph and the in-ferred taxonomy are derived empirically in an unsu-pervised manner (minimal tuning is required when graph re-weighting is employed, the parameters).
Our experiments have shown that both the input semantic network and the representation of its nodes influence the quality of the induced taxonomy. Rep-resenting the terms of the taxonomy as vectors in a human-produced feature space yields more coherent semantic classes compared to a corpus-based vector representation (see the F-score in Tables 1 and 4). This is not surprising, as feature norms provide more detailed and accurate knowledge about seman-tic representations than often noisy and approxi-mate corpus-based distributions.4 It may be
possi-4Note that as multiple participants are required to create a
representation for each word, norming studies typically involve
ble to obtain better performance when considering more elaborate representations. We have only ex-perimented with a simple semantic space, however variants that utilize syntactic information (e.g., Pad´o and Lapata (2007)) may be more appropriate for the taxonomy induction task. Our experiments have also shown that the topology of the input semantic net-work is critical for the success of the HRG. In partic-ular edge re-weighting plays an important role and generally improves performance. We have adopted a simple method based on flat clustering; it may be interesting to compare how this fares with more in-volved weighting schemes such as those described in Navigli et al. (2011). Finally, we have shown that naive participants are able to perform the taxonomy induction task relatively reliably and that the HRG approximates human performance on a small-scale experiment. We have evaluated model output using F-score and tree-height correlation which we argue are complementary and allow to assess hierarchical clustering more rigorously.
Avenues for future work are many and varied. Be-sides exploring the performance of our algorithm on more specialized domains (e.g., mathematics or ge-ography) we would also like to create an incremen-tal version that augments an existing taxonomy with missing information. Additionally, the taxonomies inferred with the HRG do not currently admit term ambiguity which we could remedy by modifying our technique for constructing a consensus hierarchy to reflect the sampled frequency of observed subtrees.
References
Eneko Agirre and Aitor Soroa. 2007. Semeval-2007 task 02: Evaluating word sense induction and discrimina-tion systems. InProceedings of the 4th International Workshop on Semantic Evaluations (SemEval-2007), pages 7–12, Prague, Czech Republic, June.
Matthew Berland and Eugene Charniak. 1999. Finding parts in very large corpora. InProceedings of the 37th Annual Meeting of the Association for Computational Linguistics, pages 57–64, College Park, Maryland. Chris Biemann. 2006. Chinese whispers - an efficient
graph clustering algorithm and its application to natu-ral language processing problems. InProceedings of TextGraphs: the 1st Workshop on Graph Based Meth-ods for Natural Language Processing, pages 73–80, New York City.
BNC. 2007. The British National Corpus, version 3 (BNC XML Edition). Distributed by Oxford Univer-sity Computing Services on behalf of the BNC Con-sortium.
Peter F. Brown, Vincent J. Della Pietra, Peter V. de Souza, Jenifer C. Lai, and Robert L. Mercer. 1992. Class-basedn-gram models of natural language. Computa-tional Linguistics, 18:467–479.
Sharon A. Caraballo. 1999. Automatic construction of a hypernym-labeled noun hierarchy from text. In Pro-ceedings of the 37th Annual Meeting of the Associ-ation for ComputAssoci-ational Linguistics, pages 120–126, College Park, Maryland.
Aaron Clauset, Christopher Moore, and M. E. J. New-man. 2008. Hierarchical structure and the prediction of missing links in networks. Nature, 453:98–101, February.
J. Cohen and P. Cohen. 1983. Applied Multiple Regres-sion/Correlation Analysis for the Behavioral Sciences. Erlbaum, Hillsdale, NJ.
Oren Etzioni, Michael Cafarella, Doug Downey, Ana-Maria Popescu, Tal Shaked, Stephen Soderland, Daniel S. Weld, and Alexander Yates. 2005. Unsuper-vised named-entity extraction from the web: An exper-imental study.Artificial Intelligence, 165(1):91–134. Christiane Fellbaum. 1998. WordNet: An Electronic
Lexical Database (Language, Speech, and Communi-cation). The MIT Press.
Trevor Fountain and Mirella Lapata. 2010. Meaning rep-resentation in natural language categorization. In Stel-lan Ohlsson and Richard Catrambone, editors, Pro-ceedings of the 31st Annual Conference of the Cogni-tive Science Society, pages 1916–1921, Portland, Ore-gon. Cognitive Science Society.
Maayan Geffet and Ido Dagan. 2005. The distributional inclusion hypotheses and lexical entailment. In Pro-ceedings of the 43rd Annual Meeting of the
Associ-ation for ComputAssoci-ational Linguistics, pages 107–114, Ann Arbor, Michigan.
Roxana Girju, Adriana Badulescu, and Dan Moldovan. 2003. Learning semantic constraints for the automatic discovery of part-whole relations. InProceedings of the 2003 Human Language Technology Conference of the North American Chapter of the Association for Computational Linguistics, pages 80–87, Edmonton, Canada.
Sanda M. Harabgiu, Steven J. Maiorano, and Marius A. Pas¸ca. 2003. Open-doman textual question answering techniques. Natural Language Engineering, 9(3):1– 38.
Marti A. Hearst. 1992. Automatic acquisition of hy-ponyms from large text corpora. InProceedings of the 14th conference on Computational linguistics, pages 539–545, Nantes, France.
Eduard Hovy. 2002. Comparing sets of semantic rela-tionships in ontologies. In Rebecca Green, Carol A. Bean, and Sun Hyon Myaeng, editors, The Seman-tics of Relationships: An Interdisciplinary Perspec-tive, pages 91–110. Kluwer Academic Publishers, The Netherlands.
Chihli Hung, Stefan Wermter, and Peter Smith. 2004. Hybrid neural document clustering using guided self-organization and wordnet. IEEE Intelligent Systems, 19(2):68–77.
Ioannis Klapaftis and Suresh Manandhar. 2010. Word sense induction and disambiguation using hierarchical random graphs. In Proceedings of the 2010 Confer-ence on Empirical Methods in Natural Language Pro-cessing, pages 745–755, Cambridge, MA.
Zornitsa Kozareva and Eduard Hovy. 2010. Learning arguments and supertypes of semantic relations using recursive patterns. InProceedings of the 48th Annual Meeting of the Association for Computational Linguis-tics, pages 1482–1491, Uppsala, Sweden, July. Zornitsa Kozareva, Ellen Riloff, and Eduard Hovy. 2008.
Semantic class learning from the web with hyponym pattern linkage graphs. In Proceedings of ACL-08: HLT, pages 1048–1056, Columbus, Ohio, June. Franc¸ois-Joseph Lapointe. 1995. Comparison tests for
dendrograms: A comparative evaluation. Journal of Classification 12:265-282, 12:265–282.
Dekang Lin. 1998. Automatic retrieval and clustering of similar words. InProceedings of the 36th Annual Meeting of the Association for Computational Linguis-tics and 17th International Conference on Computa-tional Linguistics, Volume 2, pages 768–774, Mon-treal, Quebec, Canada.
Behavioral Research Methods Instruments & Comput-ers, 37(4):547–559.
Roberto Navigli, Paola Velardi, and Stefano Faralli. 2011. A graph-based algorithm for inducing lexi-cal taxonomies from scratch. In Proceedings of the 22nd International Joint Conference on Artificial In-telligence, pages 1872–1877, Barcelona, Spain. Sebastian Pad´o and Mirella Lapata. 2007.
Dependency-based construction of semantic space models. Compu-tational Linguistics, 33(2):161–199.
Patrick Pantel and Deepak Ravichandran. 2004. Auto-matically labeling semantic classes. In Daniel Marcu Susan Dumais and Salim Roukos, editors, HLT-NAACL 2004: Main Proceedings, pages 321–328, Boston, Massachusetts.
Brian Roark and Eugene Charniak. 1998. Noun-phrase co-occurrence statistics for semi-automatic se-mantic lexicon construction. In Proceedings of the 36th Annual Meeting of the Association for Computa-tional Linguistics and 17th InternaComputa-tional Conference on Computational Linguistics, Volume 2, pages 1110– 1116, Montreal, Quebec.
Rion Snow, Daniel Jurafsky, and Andrew Y. Ng. 2006. Semantic taxonomy induction from heterogenous evi-dence. InProceedings of the 21st International Con-ference on Computational Linguistics and 44th Annual Meeting of the Association for Computational Linguis-tics, pages 801–808, Sydney, Australia.
Robert Sokal and Charles Michener. 1958. A statistical method for evaluating systematic relationships. Uni-versity of Kansas Science Bulletin, 38:1409–1438. Hui Yang and Jamie Callan. 2009. A metric-based