Volume 2010, Article ID 957916,15pages doi:10.1155/2010/957916
Research Article
A Three-Dimensional Range Migration Algorithm for
Downward-Looking 3D-SAR with Single-Transmitting and
Multiple-Receiving Linear Array Antennas
Lei Du,
1, 2, 3Yanping Wang,
1, 2Wen Hong,
1, 2Weixian Tan,
1, 2and Yirong Wu
1, 21The National Key Laboratory of Microwave Imaging Technology (MITL), P.O. Box 2702, Beijing 100190, China 2Institute of Electronics, Chinese Academy of Sciences (IECAS), P.O. Box 2702, Beijing 100190, China
3The Graduate University of Chinese Academy of Sciences (GUCAS), Beijing 100049, China
Correspondence should be addressed to Yanping Wang,[email protected]
Received 14 June 2009; Revised 29 October 2009; Accepted 16 December 2009 Academic Editor: Andreas Reigber
Copyright © 2010 Lei Du et al. This is an open access article distributed under the Creative Commons Attribution License, which permits unrestricted use, distribution, and reproduction in any medium, provided the original work is properly cited.
This paper presents a three-dimensional (3D) range migration algorithm (RMA) suitable for downward-looking 3D-SAR with single-transmitting and multiple-receiving linear array antennas (STMR-LAA). As the round-trip range equation in 3D-SAR with STMR-LAA is a dual square root, the signal spectrum in 3D wavenumber domain contains nonlinear phase terms besides constant and linear phase terms. In this paper, the approximate expression of the signal spectrum is derived by expanding the implicit phase term to its Taylor series. Then the constant and nonlinear phase terms are calculated and compensated by multiplying the wavenumber filters. Finally, a 3D wavenumber mapping is proposed to make the signal evenly sampled in 3D wavenumber domain. Some simulating results are presented to validate the correctness of the analysis and the feasibility of the algorithm. In addition, the required accuracy on the platform position is analyzed at the end of the paper.
1. Introduction
Synthetic aperture radar (SAR) is a well-developed technique for remote sensing. It can provide two-dimensional (2D) high-resolution radar images along azimuth and slant-range directions. However, since 2D radar images are obtained by projecting the three-dimensional (3D) distributed targets onto the 2D plane, they usually suffer from geometric distortions, such as foreshortening, layover, and so forth. Furthermore, conventional SAR system generally works at the side-looking mode and exhibits strong shadowing caused by buildings, hills, and valleys, which may result in the information loss of the explored area [1].
To overcome the disadvantages mentioned above, the concept of 3D-SAR imaging with linear array antennas (LAA) was proposed [1–3]. 3D-SAR with LAA combines the theories of real and synthetic aperture and can provide
high-resolution radar images in three dimensions: azimuth, ground-range, and elevation. In addition, 3D-SAR with LAA can alleviate shadowing effects by looking downwards.
of the algorithm is the range error caused by Fresnel approximation. Klare et al. [8,9] introduced the concept of virtual antenna elements formed by the mean positions of every single transmitting and receiving antenna element to transform bistatic configuration into monostatic configura-tion and proposed a 3D imaging algorithm for ARTINO with beamforming operation in cross-track direction. However, the positions of virtual antenna elements depend on target locations, especially for the near-field targets.
Meanwhile, Reigber [17] proposed a 3D range migration algorithm (RMA) for SAR tomography imaging. Lopez-Sanchez and Fortuny [18] and Fortuny [19] developed a 3D RMA for 2D planar scanning aperture in the near-field zone of the target. Tan et al. [20] proposed a 3D RMA for SAR tomography imaging with digital spotlight in the elevation direction. All of these 3D RMAs are suitable for the monostatic configuration, where the signal spectrum in 3D wavenumber domain only contains constant and linear phase terms. However, due to the dual square root in the bistatic configuration, the signal spectrum in 3D wavenumber domain contains nonlinear phase terms besides constant and linear phase terms. Therefore, the 3D RMAs [17–20] mentioned above cannot be applied to the bistatic configuration directly.
In this paper, we propose a 3D RMA which can be applied to downward-looking 3D-SAR with single-transmitting and multiple-receiving linear array antennas (STMR-LAA). Firstly, we derive the approximate expression of the signal spectrum by expanding the implicit phase term to its Taylor series, where quartic and higher-order phase terms are neglected because the phase error caused by these phase terms contributes little to the analysis. Secondly, after the removal of constant phase term, quadratic and cubic phase terms caused by the bistatic configuration are calculated and compensated by multiplying a wavenum-ber filter, where some approximations are considered to improve computational efficiency. Finally, a 3D wavenumber mapping is proposed according to the expression of the residual phase terms, and an interpolation is performed to make the signal evenly sampled in 3D wavenumber domain.
The paper is organized as follows. The imaging geometry is described inSection 2. The signal properties are analyzed, and a 3D RMA for downward-looking 3D-SAR with STMR-LAA is derived inSection 3, where the removal of constant phase term, the compensation of nonlinear phase terms, and the mapping and interpolation in 3D wavenumber domain are highlighted. Simulation results are shown in Section 4. The required accuracy on the platform position to generate the 3D images is discussed inSection 5, andSection 6gives conclusions of this paper.
2. Imaging Geometry
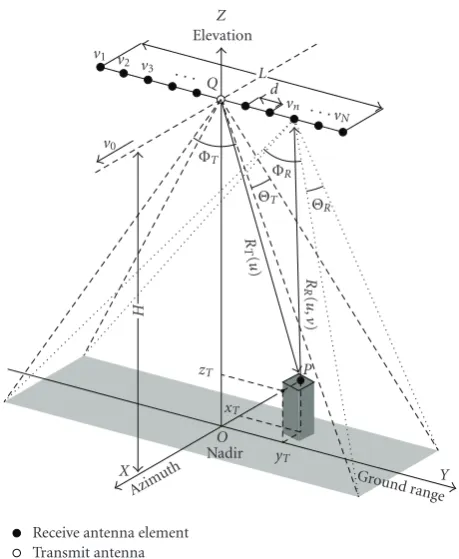
We consider the simplified imaging scenario in a 3D spatial domain OXYZ, and the coordinate axes are defined in Figure 1. The platform is supposed to fly at the altitudeH
v0
v1 v2
v3 · · ·
vn · · ·
vN
Z
Elevation
zT
Q
H
L d
O
Nadir
ΦT
ΦR
ΘT Θ R
R
T(
u)
R
R(
u
,
v
)
P
X
Azimut h
xT
Y Groundrange yT
Transmit antenna Receive antenna element
Figure1: Imaging geometry of downward-looking 3D-SAR with STMR-LAA, where x-axis,y-axis and z-axis denote the azimuth (along-track), ground-range (cross-track), and elevation directions respectively, andOindicates the origin of the Cartesian coordinates.
along the x-axis with the constant velocity v0. The illumi-nated scenario is located at the nadir area of the platform, and the origin of the coordinate system is located at the nadir point.
The STMR-LAAs of the 3D-SAR are composed of a transmitting antenna element (Tx) andNreceiving antenna elements (Rx) and distributed along the cross-track direc-tion. Tx is located at the center of the LAA (i.e., Q in Figure 1), and its position is{u, 0,H}, whereu=v0tm, and
tmindicates the slow time. The entire Rxs are evenly spaced
with distance d. Therefore, the length of LAA L equals to (N−1)d, and the position of thenth Rx is{u,v,H}, where
v= −L/2 + (n−1)dandn=1, 2, 3,. . .,N.
Let a point targetPlocate at{xT,yT,zT}with reflectivity
σ(xT,yT,zT). The distance from Tx to the targetPis given by
RT(u)=
(u−xT)2+yT2+ (H−zT)2 (1)
shown inFigure 1, and the distance fromPto thenth Rx is
RR(u,v)=
(u−xT)2+
v−yT
2
+ (H−zT)2. (2)
Therefore, the round-trip range equation can be written as
3. Formulation of the 3D RMA
Here, we use the geometric relations and symbols illustrated inFigure 1and assume that the transmitted signal p(t) is a chirp with the bandwidthB:
p(t)=rect
t T
exp
j2π
fct+
1 2μt
2
, (4)
wheretdenotes the fast time;Tindicates the pulse duration;
fcis the carrier frequency;μis the chirp rate; the transmitted
signal bandwidthB = μT; rect(·) is a rectangular window function, which means rect(t/T)=1 for|t| ≤T/2, and zero otherwise.
3.1. Signal Spectrum in 3D Wavenumber Domain. After coherent demodulation, the received signal can be written as
s0(t,u,v)=
σxT,yT,zT
rect
t−R(u,v)
c
/T
×exp
jπμ
t−R(u,v)
c
2
×exp
−j2π fcR(u,v)
c
dxTd yTdzT,
(5)
wherecis the speed of light. The antenna pattern and its type are not considered here since they contribute nothing to the essence of the analyzed themes.
The Fourier transform of the received signal s0(t,u,v) with respect to the fast-timetis
S0
ft,u,v
=
σxT,yT,zT
rect
ft
μT
exp
−jπf
2
t
μ
×exp
−j2π ftR
(u,v)
c
×exp
−j2π fcR
(u,v)
c
dxTd yTdzT,
(6)
whereftis the slant-range frequency domain fort, and|ft| ≤
B/2.
The range compression is performed via the slant-range frequency domain matched filter:
H1
ft
=rect
ft
μT
exp
jπf
2
t
μ
. (7)
After slant-range compression, the signal can be written as
S1
ft,u,v
=S0
ft,u,v
×H1
ft
=
σxT,yT,zT
×exp
−j2πft+ fc c R(u,v)
dxTd yTdzT.
(8)
Letk=2π(ft+ fc)/cdenote the wavenumber domain of
the transmitted signal, andk ∈ [kmin,kmax], wherekmin = 2π(fc−B/2)/c,kmax=2π(fc+B/2)/candkc=2π fc/c; then
(8) can be rewritten as
S1(k,u,v)=
σxT,yT,zT
exp−jkR(u,v)dxTd yTdzT
(9)
in the slant-range wavenumber domain.
The 2D Fourier transform of the signalS1(k,u,v) with respect to (u,v) is
S2(k,ku,kv)
=
S1(k,u,v) exp
−j(kuu+kvv)
du dv
=
σxT,yT,zT
×
exp−j[kR(u,v)+kuu+kvv]
du dv
dxTd yTdzT,
(10)
wherekuis the azimuth wavenumber domain foru, andkvis
the cross-track wavenumber domain forv. LetU =u−xT
andV=v−yT, then (10) can be rewritten as
S3(k,ku,kv)
=
σxT,yT,zT
exp−jkuxT+kvyT
×
exp−j[kR(U,V)+kuU+kvV]
dUdV
dxTd yTdzT,
(11)
whereR(U,V)=
U2+y2
T+(H−zT)2+
U2+V2+(H−z
T)2.
The principle of stationary phase (POSP) can be applied to solve the inner integral of (11). Here, we useΦ(U,V) to denote the negative phase term in (11), that is,
Φ(U,V)=kR(U,V) +kuU+kvV. (12)
Based on the POSP, the stationary pointsU0andV0should satisfy the equations set:
∂Φ(U,V)
∂U U=U
0,V=V0
=0,
∂Φ(U,V)
∂V
U=U0,V=V0
=0.
According to the definition ofΦ(U,V) in (12), (13) can be written as
k ⎡
⎣ U0
U2
0+yT2+ (H−zT)2
+ U0
U02+V02+ (H−zT)2
⎤ ⎦
+ku=0,
k V0
U2
0+V02+ (H−zT)2
+kv=0.
(14)
It is too complicated to obtain the analytic solutions of equations set (14), and so we cannot have the explicit expressions of the stationary points U0 and V0. However, bothU0andV0are the function ofk,ku,kv,yT, andzT, that
is,U0 = U0(k,ku,kv;yT,zT) andV0 = V0(k,ku,kv;yT,zT).
Therefore, the implicit expression of the signal spectrum in 3D wavenumber domain can be written as
S3(k,ku,kv)
=
σxT,yT,zT
×exp−jkuxT+kvyT+Φ(U0,V0)
dxTd yTdzT,
(15)
where unessential multiplicative complex constants are not represented in the formula, and
Φ(U0,V0)=kR(U0,V0) +kuU0+kvV0. (16)
Φ(U0,V0) is written asΦ0for notational simplicity hereafter. From (16), we can see thatΦ0is the function ofk,ku,kv,
yT, andzT. IfΦ0can be factorized to a combination of linear
phase terms with respect toyTandzT, that is,
Φ0=k1(k,ku,kv)yT+k2(k,ku,kv)zT, (17)
then (15) can be written as
S4
kx,ky,kz
=
σxT,yT,zT
×exp−jkxxT+kyyT+kzzT
dxTd yTdzT,
(18)
where
kx=ku,
ky=kv+k1(k,ku,kv),
kz=k2(k,ku,kv).
(19)
After the wavenumber interpolation and 3D IFFT operation, the 3D image in the spatial domainOXYZcan be generated. However, unlike the monostatic case [17–20], theΦ0in (16) contains nonlinear phase terms besides constant and linear
phase ones. Since precise 3D RMA does not exist in 3D-SAR with STMR-LAA, only an approximate solution can be found.
In this paper, we expand Φ0 to its Taylor series and compensate the phase terms except for the linear phase ones. The terms left in Φ0 can be expressed as (17), and the following steps are the same as the monostatic case. ExpandingΦ0 to its Taylor series at yT = 0,zT = 0 and
neglecting the quartic and higher-order terms, we have
Φ0≈Φconst+
yT ∂
∂yT +zT
∂ ∂zT
Φ0
yT=0,zT=0
+1 2
yT ∂
∂yT +zT
∂ ∂zT
2 Φ0
y
T=0,zT=0
+1 6
yT ∂
∂yT +zT
∂ ∂zT
3 Φ0
y
T=0,zT=0,
(20)
where the first term is constant and independent of the target location; the second term is the linear phase term, which contributes to focusing; the third and forth terms are the main nonlinear phase terms, which will cause defocusing without compensation. The effect of every term in (20) will be analyzed in detail as follows.
3.2. Analysis and Removal of Constant Phase Term. The constant phase termΦconstin (20) can be written as
Φconst=Φ0k,ku,kv; yT =0, zT=0
=kR(U00,V00) +kuU00+kvV00,
(21)
whereU00 =U0(k,ku,kv;yT = 0,zT = 0), V00 =V0(k,ku,
kv;yT =0, zT =0), and
R(U00,V00)=U2 00+H2+
U2
00+V002 +H2. (22)
Since U00 andV00 are the special cases ofU0andV0at
yT = 0,zT = 0, they can be considered as the particular
solutions of equations set (14). Thus, we have
k ⎛
⎝ U00
U2 00+H2
+ U00
U2
00+V002 +H2
⎞
⎠+ku=0,
k V00
U2
00+V002 +H2
+kv=0.
(23)
The analytic solutions of equations set (23) are
U00= − kuH
k+k2−k2
v
2
−k2
u
,
V00= − kv
k2−k2
v
k+k2−k2
v
H
k+k2−k2
v
2
−k2
u
.
ThusΦconstis equal to
Φconst=H k+k2−k2
v
2
−k2
u. (25)
The removal of constant phase term can be performed by multiplying the following filter in 3D wavenumber domain:
H2(k,ku,kv)=exp
⎧ ⎨
⎩jH k+
k2−k2
v
2
−k2
u
⎫ ⎬
⎭. (26)
3.3. Analysis and Compensation of Nonlinear Phase Terms.
The nonlinear phase terms do not exist in the monostatic case but emerge here due to the bistatic configuration of LAA. Thus, the compensation of nonlinear phase terms is the key point of the 3D RMA proposed in this paper. According to (20), the nonlinear phase terms Φnonline in Φ0 mainly include two parts, that is,
Φnonline=Φquad+Φcubic, (27)
whereΦquaddenotes the quadratic phase term,
Φquad=1
2
yT ∂
∂yT
+zT ∂
∂zT 2 Φ0
yT=0,zT=0
=1
2
⎡ ⎣∂2Φ0
∂y2
T
yT=0,zT=0
y2
T
+ 2 ∂ 2Φ0
∂yT∂zT
yT=0,zT=0
yTzT+∂
2Φ0
∂z2T
yT=0,zT=0
zT2
⎤ ⎦,
(28)
andΦcubicdenotes the cubic phase term,
Φcubic= 1
6
yT ∂
∂yT
+zT ∂
∂zT 3 Φ0
yT=0,zT=0
= 1
6
⎡ ⎣∂3Φ0
∂y3
T
yT=0,zT=0
y3T+ 3 ∂
3Φ0
∂y2
T∂zT
yT=0,zT=0
y2
TzT
+3 ∂ 3Φ0
∂yT∂z2T
yT=0,zT=0
yTz2T+
∂3Φ0
∂z3T
yT=0,zT=0
z3T
⎤ ⎦.
(29)
From (A.7) and (A.8) in Appendix A, the coefficients of Φquad associated with yT2, yTzT, andz2T in (28) can be,
respectively, calculated as follows:
∂2Φ0
∂y2
T
yT=0,zT=0
=k ⎧ ⎪ ⎨ ⎪ ⎩ 1 U2
0+yT2+ (H−zT)2
− y
2
T
(
U02+yT2+ (H−zT)2
)3/2
− U0yT
( U2
0+y2T+ (H−zT)2
)3/2
∂U0 ∂yT ⎫ ⎪ ⎬ ⎪ ⎭
yT=0,zT=0
=k
k+k2−k2
v
2
−k2
u
Hk+k2−k2
v
,
(30)
∂2Φ0
∂yT∂zT
yT=0,zT=0
=k yT
⎧ ⎪ ⎨ ⎪ ⎩
H−zT
( U2
0+y2T+ (H−zT)2
)3/2
− U0
(
U02+y2T+ (H−zT)2
)3/2
∂U0 ∂zT ⎫ ⎪ ⎬ ⎪ ⎭
yT=0,zT=0
=0,
(31)
∂2Φ0
∂z2
T
yT=0,zT=0
=
−ku
U0 −
ku(H−zT)
U2 0 ∂U0 ∂zT
yT=0,zT=0
= − ku
U00 −
kuH
U2 00
× ∂U0
∂zT
yT=0,zT=0
=0,
(32)
where ∂U0/∂zT|yT=0,zT=0 = −U00/H in (32) (see Appendix B). According to (30)–(32), there is only one term left in the quadratic phase termΦquad, that is,
Φquad=k
*
1−q
2H y
2
T, (33)
where
q= ku2
k+k2−k2
v
2. (34)
From (30)–(32), the coefficients ofΦcubicassociated with
y3T,z3T,yTz2T, andy2TzTin (29) can be, respectively, calculated
as follows:
∂3Φ0
∂y3
T
yT=0,zT=0
= − 2U00
U002 +H2
3 ×
∂U0
∂yT
yT=0,zT=0
=0,
(35)
∂3Φ0
∂z3
T
yT=0,zT=0
= −kuH
U2 00
× ∂2U0
∂z2
T
yT=0,zT=0
=0, (36)
∂3Φ0
∂yT∂z2T
yT=0,zT=0
=0, (37)
∂3Φ0
∂y2T∂zT
yT=0,zT=0
= k
H
U002 +H2
= k
H2
+ , , ,
-1− k2u
k+k2−k2
v
2, (38)
where∂U0/∂yT|yT=0,zT=0=0 in (35) (seeAppendix B), and
∂2U
0/∂zT2|yT=0,zT=0=0 in (36) (seeAppendix C). According
to (35)–(38), there is only one term left inΦcubic, that is,
Φcubic=k
*
1−q
2H2 y 2
TzT. (39)
Thus, the nonlinear phase termsΦnonline in Φ0 can be written as
Φnonline=k
*
1−q
2H2 y 2
T(H+zT). (40)
The compensation of Φnonline can be performed by multi-plying the following filter in 3D wavenumber domain (i.e., (k,ku,kv) domain):
H3
k,ku,kv;yT,zT
=expjΦnonline. (41)
From (34), (40), and (41), we know that the compensa-tion ofΦnonlineneeds to take 5 variables into account, which are the slant-range wavenumber k, azimuth wavenumber
ku, cross-track wavenumber kv, the location of target in
the ground-range direction yT, and elevation direction zT.
For the compensation of the nonlinear phase terms will require high computation time, some approximations will be considered to improve computational efficiency.
According to (9), the azimuth instantaneous wavenum-berkuis equal to
ku= ∂
∂u[−kR(u,v)]
= −k.sinθT
xT,yT,zT
+ sinθRn
xT,yT,zT
/ .
(42)
In (42), θT(xT,yT,zT) = arcsin{(u−xT)/RT(u)}, which
is the azimuth instantaneous aspect angle of the Tx to the
point targetP, and|θT(xT,yT,zT)| ≤ΘT/2, whereΘTis the
azimuth beamwidth of the Tx.θRn(xT,yT,zT)=arcsin{(u−
xT)/RR(u,v)}, which is the azimuth instantaneous aspect
angle of thenth Rx toP, and|θRn(xT,yT,zT)| ≤ΘR/2, where
ΘRis the azimuth beamwidth of the Rx. Here, it is assumed
that every Rx has the same azimuth beamwidth. Therefore, the maximum ofkufor a fixed slant-range wavenumberkis
kumax=k
sin
ΘT
2
+ sin
ΘR
2
. (43)
Similarly, the cross-track instantaneous wavenumber kv
is equal to
kv= ∂
∂v[−kR(u,v)]= −ksinφRn
xT,yT,zT
. (44)
In (44),φRn(xT,yT,zT)=arcsin{(v−yT)/RR(u,v)}, which
is the cross-track instantaneous aspect angle of thenth Rx to
P, and|φRn(xT,yT,zT)| ≤ΦR/2, whereΦRis the cross-track
beamwidth of the Rx and every Rx is assumed to have the same cross-track beamwidth. The maximum ofkvfor a fixed
slant-range wavenumberkis
kvmax=ksin
ΦR
2
. (45)
According to (43) and (45), the maximum ofqis
qmax= k
2
umax
k+k2−k2
vmax
2 =
sin(ΘT/2) + sin(ΘR/2)
1 + cos(ΦR/2)
2
.
(46)
If the parameters of 3D-SAR with STMR-LAA are chosen to satisfyqmax1, then the wavenumber filter shown in (41) can be approximated as
H3
k;yT,zT
≈exp
j k
2H2y 2
T(H+zT)
. (47)
After approximation, the wavenumber filter only depends on
k,yT, andzT, and the computational efficiency is improved.
The nonlinear phase compensation can be performed by multiplying (47) in the slant-range wavenumber domain before the 2D Fourier transform with respect to (u,v) (i.e., (k,u,v) domain). The phase error between (41) and (47) will be discussed inSection 4.
3.4. Mapping and Interpolation in 3D Wavenumber Domain.
After the removal of constant phase termΦconstand compen-sation of nonlinear phase termsΦnonline, the residual phase term inΦ0can be written as
Φline=
yT ∂
∂yT
+zT ∂
∂zT
Φ0
yT=0,zT=0
= ∂Φ0
∂yT
yT=0,zT=0
yT+ ∂Φ0
∂zT
yT=0,zT=0
zT
= −zT k+
k2−k2
v
2
−k2
u,
where the coefficients of the phase terms with respect toyT
and zT are derived in Appendix A. According to (48), the
residual phase term in Φ0 is composed of the linear phase terms with respect to yT and zT, and we can obtain that
k1(k,ku,kv)=0 andk2(k,ku,kv)= −
(k+k2−k2
v)
2
−k2
u
by comparing (48) with (17). Thus we can define a 3D wavenumber mapping:
kx=ku, (49a)
ky=kv, (49b)
kz= − k+
k2−k2
v
2
−k2
u, (49c)
which is used to transform the signal in the (k,ku,kv)
domain into the one in the (kx,ky,kz) domain. The 3D
wavenumber mapping used here is distinguished from the one used in the monostatic case [17–20]. It essentially replaces wavenumber in the direction of wave propagation by wavenumber observed in the azimuth, ground-range, and elevation directions. The reason for the negative sign in (49c) is that the defined direction between wave propagation and the elevation is opposite in this paper.
After the 3D wavenumber mapping shown in ((49a), (49b), (49c)), the available discrete evenly spaced samples of (t,u,v) are transformed into evenly spaced samples of (kx,ky) and unevenly spaced samples of the elevation
wavenumber kz. Thus an interpolation shown in (49c) is
performed to transform these unevenlyspaced samples into evenly spaced ones in thekzdomain.
Once the interpolation is done, we will obtain the expres-sion shown in (18). After the 3D inverse Fourier transform of the signal S4(kx,ky,kz) with respect to (kx,ky,kz), the
reconstructed target image in a 3D spatial domainOXYZcan be expressed as
s4
x,y,z=
σxT,yT,zT
sinc
BxT(x−xT)
2π
×sinc
ByT
y−yT
2π
×sinc
BzT(z−zT)
2π
dxTd yTdzT,
(50)
where the sinc function is defined as sinc(a)=sin(πa)/(πa);
BxT is the bandwidth of the targetP spectral support in the
kx domain, which determines the azimuth resolution; ByT
is the bandwidth of the targetP spectral support in theky
domain, which determines the ground-range resolution;BzT
is the bandwidth of the targetP spectral support in thekz
domain, which determines the elevation resolution.
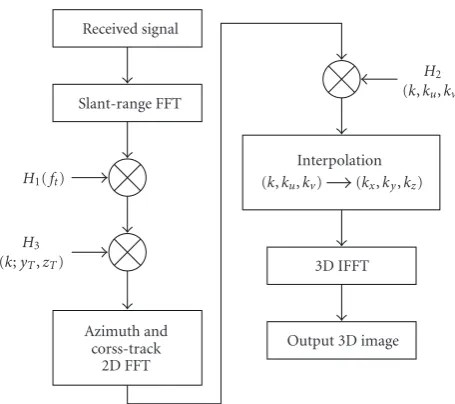
3.5. Summary of 3D RMA. So far, the 3D RMA for 3D-SAR with STMR-LAA has been deduced in 3D wavenumber domain. The block scheme of this algorithm is shown in Figure 2. The execution steps and some implementation details are explained as follows.
Received signal
Slant-range FFT
Azimuth and corss-track
2D FFT
Interpolation (k,ku,kv) (kx,ky,kz)
3D IFFT
Output 3D image
H1(ft)
H3 (k;yT,zT)
H2 (k,ku,kv)
Figure2: Block scheme of 3D RMA for 3D-SAR with STMR-LAA.
(a) Fourier transform along the slant-range direction is firstly applied to the received signal, and the slant-range compression is performed with the frequency domain matched filterH1(ft).
(b) The nonlinear phase terms are compensated by mul-tiplying the wavenumber domain filterH3(k;yT,zT),
where some approximations are adopted in this step to improve the computational efficiency.
(c) After the 2D Fourier transform along the azimuth and cross-track directions, constant phase term is removed by multiplying H2(k,ku,kv) in 3D
wavenumber domain.
(d) A 3D wavenumber mapping is proposed to transform the signal in the (k,ku,kv) domain into the one in
the (kx,ky,kz) domain, and an interpolation is done
to make the signal evenly sampled in the (kx,ky,kz)
domain. The interpolation can be separated into two steps, where the first step isk3=k+
k2−k2
vand the
following one iskz= −
k2
3−k2u.
(e) 3D inverse Fourier transform is performed to gener-ate the final 3D image in the spatial domainOXYZ.
4. Simulation Results
For evaluating the proposed algorithm, we carry out some simulations for 3D-SAR with STMR-LAA in the downward-looking mode. Simulation parameters are given inTable 1. The values of the platform parameters correspond to the characteristics of a small UAV.
Consider a 50 m×50 m×50 m (azimuth×ground−
25 20 15 10 5 0
−5
−8 −6
−4 −2 0 2
4 6
8 2 4
6 8
10 12 14 16
A
B
C
Ele
vation
(m)
Ground
range (m) Azimuth
(m)
(a)
−8 −6 −4 −2 0 2 4 6 8
2 4 6 8 10 12 14 16
Ground range (m)
Az
im
ut
h
(m
)
(b)
−8 −6 −4 −2 0 2 4 6 8
−5 0 5 10 15 20 25
Ground range (m)
Ele
vation
(m)
(c)
2 4 6 8 10 12 14 16
−5 0 5 10 15 20 25
Azimuth (m)
Ele
vation
(m)
(d)
Figure3: Point targets distribution. (a) the point targets in the 3D spatial domainOXYZ; (b) projections onto the 2DOXY plane; (c) projections onto the 2DOYZplane; (d) projections onto the 2DOXZplane.
According to (46) and simulation parameters inTable 1, we can obtain thatqmax = 1.9×10⁻⁵.Figure 4shows the nonlinear phase terms shown in (47) and the nonlinear phase error betweenH3(k,ku,kv;yT,zT) in (41) andH3(k;yT,zT)
in (47), where yT and zT are chosen at the borders of
the illuminated scenario. It can be seen that nonlinear phase errors are all smaller than π/4 radian at the three wavenumber pointskmin,kc, andkmaxand can be negligible compared with the corresponding nonlinear phase terms. Therefore, it will not deteriorate the focusing quality by the use of the approximate expression (47) to compensate the nonlinear phase terms.
With the 3D RMA proposed in this paper, the 3D imaging results of the 28 point targets are shown inFigure 5, where an oversampling factor of 8 has been used in 5(b)– 5(d) to enhance the intensity of the image display and no windowing is used in the processing. The 3D image is displayed at the threshold of−3 dB as shown inFigure 5(a), and the positions of the 28 point targets are consistent with the real situations inFigure 3(a). Figures5(b)and5(c)show
Table1: Simulation parameters.
Altitude (H) 1 km
Velocity (v0) 40 m/s
Carrier frequency (fc) 37.5 GHz
Bandwidth (B) 300 MHz
Pulse repetition frequency 200 Hz
Length of LAA (L) 16 m
Number of Rx (N) 256
Azimuth beamwidth of Tx and Rx (ΘTandΘR)
0.5◦ Cross-track beamwidth of Rx
(ΦR)
3◦ Theoretical resolution (azimuth
×ground−range×elevation) 0.5 m×0.5 m×0.5 m
1025.5 1025.46 1025.42 1025.38 1025.34 1025.3 60
40
20 0−20
−40−60
−30−20−10
0 10 20 30
N
o
nlinear
phase
(r
ad)
kv(rad/m)
ku(rad/m)
(a)
0.16 0.12 0.08 0.04 0 60
40
20 0−20
−40−60
−30−20−10
0 10 20 30
Phase
er
ror
(r
ad)
kv(rad/m)
ku(rad/m)
(b)
1030.82 1030.78 1030.74 1030.7 1030.66 1030.62 60
40
20 0−20
−40−60
−30−20−10
0 10 20 30
N
o
nlinear
phase
(r
ad)
kv(rad/m)
ku(rad/m)
(c)
0.16 0.12 0.08 0.04 0 60
40
20 0−20
−40−60
−30−20−10
0 10 20 30
Phase
er
ror
(r
ad)
kv(rad/m)
ku(rad/m)
(d)
1036.18 1036.14 1036.1 1036.06 1036.02 1035.98
60 40
20 0−20
−40
−60 −30−20−10
0 10 20 30
N
o
nlinear
phase
(r
ad)
kv(rad/m)
ku(rad/m)
(e)
0.16 0.12 0.08 0.04 0 60 40
20 0−20
−40
−60 −30−20−10
0 10 20 30
Phase
er
ror
(r
ad)
kv(rad/m)
ku(rad/m)
(f)
Figure4: The nonlinear phase terms shown in (41) and nonlinear phase error between (41) and (47). (a) nonlinear phase terms calculated atk =kmin; (b) nonlinear phase error calculated atk =kmin; (c) nonlinear phase terms calculated atk =kc; (d) nonlinear phase error
calculated atk=kc; (e) nonlinear phase terms calculated atk=kmax; (f) nonlinear phase error calculated atk=kmax.
Table2: Image quality parameters.
Point target Resolution (m) PSLR (dB) ISLR (dB)
X Y Z X Y Z X Y Z
A 0.51 0.52 0.53 −13.23 −13.15 −13.18 −10.40 −10.34 −10.33 B 0.52 0.51 0.53 −13.20 −13.17 −13.21 −10.41 −10.20 −10.51 C 0.51 0.51 0.52 −13.24 −13.23 −13.26 −10.25 −10.35 −10.30
Three point targets A, B and C shown inFigure 3(a)are chosen to verify the performance and focusing quality of the proposed 3D RMA, and the image quality parameters, including the resolution, the peak sidelobe ratio (PSLR) and the integrated sidelobe ratio (ISLR), are shown inTable 2. From the above simulation results, we can see that the point targets are all well focused after the removal of constant phase term and compensation of nonlinear phase terms, and the
expansion ofΦ0in (20) is effective without taking the quartic and higher-order terms into account.
5. Influence of Platform Deviations
25 20 15 10 5 0
−5
−8 −6
−4 −2 0 2
4 6
8 2 4
6 8 10 12
14 16
A
B
C
Ele
vation
(m)
Ground
range (m) Azimuth (m
)
(a)
−8 −6 −4 −2 0 2 4 6 8
16 14 12 10 8 6 4 2
Ground range (m)
Az
imut
h
(m
)
(b)
−8 −6 −4 −2 0 2 4 6 8
25 20 15 10 5 0
−5
Ground range (m)
Ele
vation
(m)
(c)
2 4 6 8 10 12 14 16
25 20 15 10 5 0
−5
Azimuth (m)
Ele
vation
(m)
(d)
Figure5: The imaging results. (a) the 3D imaging results, where the surfaces of the data are plotted at−3 dB; (b) the 2D imaging results on the 2DOXYplane, whereZ=0.5 m; (c) the 2D imaging results on the 2DOYZplane, whereX=4.5 m; (d) the 2D imaging results on the 2DOXZplane, whereY=4.5 m.
present 3D-SAR with STMR-LAA system is based on the ASTRO, which is a ground-based SAR platform developed at MITL-IECAS. It works in the anechoic chamber and on the ground, and positioning precision as well as control accuracy is high enough to satisfy the above assumption. However, when the system is mounted on the airplane or helicopter platform, trajectory deviations from the straight line, attitude disturbances and forward velocity variations are unavoidable due to atmospheric turbulence. Moreover, the wing oscillation during flying continuously changes the position of every antenna element. These will introduce motion errors to the received raw signal, and may severely impair the final 3D image quality. The impact of platform attitude disturbances on the 3D image quality is presented in Reference [14], and the 3D image quality analysis of the displacement of antenna elements caused by the wing oscillation is given in [12]. In this paper, we analyze the impact of platform trajectory deviations on the 3D image
quality, and present the required accuracy on the platform position to generate the 3D images.
The imaging geometry in the presence of trajectory deviations is shown in Figure 6, where the system axes coincide with the ideal trajectory case shown in Figure 1. The deviation vector b equals to bxi + byj + bzk in the
Cartesian coordinates, wherebx,byandbzare the deviation
components in thex-axis,y-axis andz-axis, respectively. An analysis on the effect of more complex motion deviation trajectories (pitch-, yaw-, and roll-angle variations) is out of the scope of the paper. The deviation component in the
x-axis is caused by the variable velocity which results in unevenly spaced samples in the azimuth direction, and can be compensated via a proper resampling of the received raw signal. Thus it is assumed in the following analysis that the platform trajectory deviation in thex-axis has been compensated and bx is null. Then the simplified imaging
Z
b
Ideal
traject
ory
Actua
l
traject
ory
O
P
X Y
Nadir
Figure6: Geometry in presence of trajectory deviations.
wherer0 is the distance from the Tx to the targetP in the case of ideal trajectory; r0 + δr0 is the distance from the Tx to the target Pin the case of actual trajectory;rnis the
distance from the targetPto thenth Rx in the case of ideal trajectory;rn+δrnis the distance from the targetPto thenth
Rx in the case of actual trajectory;β0denotes the look angle from the Tx to the targetP;βndenotes the look angle from
thenth Rx to the targetP. The deviation vectorbequals to
b(cosαj+ sinαk) in the polar coordinates.
According to the Cosine Theorem [21], we have
r0+δr0=
r2
0+b2−2r0bsin
β0−α
. (51)
When the value of the deviation is small compared with the slant range of the target, the range errorδr0in (51) can be approximately expressed as δr0 ≈ bsin(α−β0). Likewise, the range error δrn can be calculated as δrn ≈ bsin(α−
βn). According to (16), the phase error caused by trajectory
deviations can be expressed as
δΦ=k(δr0+δrn)≈2kcbsin
α−β0+βn
2
cos
β0−βn
2
.
(52)
The phase errorδΦvaries with the polar angleαwhen the polar radius b is constant. The absolute maximum of
δΦis obtained atα= ±π/2 + (β0+βn)/2, and the absolute
minimum, which equals to zero, is obtained atα=(β0+βn)/2
andα = π+ (β0+βn)/2. Therefore, the whole trajectory
deviations can be separate into the deviation component along the equivalent target look direction (i.e.,α= ±π/2 + (β0 + βn)/2) and the deviation component perpendicular
Z
Q
O Y
Q vn
b b
α α
vn
β0 βn
r0 rn
r
0+
δr 0
r
n +
δr
n
P
Elevation
Ground range
Figure7: Geometry on zero Doppler plane.
to the equivalent target look direction (i.e., α = (β0 +
βn)/2 and α = π + (β0 + βn)/2). The second deviation
component contributes nothing to the phase error, and the compensation of platform trajectory deviations only needs to take the first component into account.
The impact of platform trajectory deviations on the 3D image quality can be ignored when the magnitude of phase error caused by trajectory deviations is smaller thanπ/4 [22]. According to this principle, the range of required accuracy on the platform position should satisfy the following inequation to generate the 3D image:
bzcos
β0+βn
2
−bysin
β0+βn
2
≤16 cos.βλ0c−βn
/2/,
(53)
whereby=bcosαandbz=bsinα. It can be calculated with
the parameters given inTable 1 that the platform position should be known with accuracy up to the magnitude of millimeter. For platform deviations larger than that, the PSLR and ISLR will be increased drastically. It demonstrates that the platform position has to be measured or estimated very precisely in order to form high quality 3D images.
6. Conclusions
phase term and compensation of nonlinear phase terms, a 3D wavenumber mapping is proposed to replace the wavenumber in the direction of wave propagation by the wavenumber observed in 3D spatial domain OXYZ, and an interpolation is performed to transform these unevenly spaced samples into evenly spaced ones in 3D wavenumber domain. The simulation results about the imaging quality and the phase error analysis validate the feasibility of the imaging algorithm. Furthermore, the impact of platform trajectory deviations on the 3D image quality is discussed, and it concludes that the platform position has to be known precisely to form high quality 3D images.
Future work will extend the proposed 3D RMA to more complex bistatic configurations of downward-looking 3D-SAR with LAA, such as transmitting and multi-receiving case. In addition, this paper contains neither technological aspects about the realization of airborne 3D-SAR with LAA system nor the key techniques, including the motion compensation, wings oscillation compensation and relevant problems. These special problems have to be treated separately when the 3D-SAR with LAA system will be mounted on the airplane or helicopter platform in the future.
Appendices
A. Derivation of the First Partial Derivatives of
Φ
0with Respect To
y
Tand
z
TAccording to (16), the first partial derivative of Φ0 with respect toyTcan be written as
∂Φ0
∂yT =k
∂R(U0,V0)
∂yT
+ku∂U0
∂yT
+kv∂V0
∂yT
, (A.1)
where
R(U0,V0)=RT(U0) +RR(U0,V0), (A.2)
RT(U0)=
U02+yT2+ (H−zT)2, (A.3)
RR(U0,V0)=
U2
0+V02+ (H−zT)2. (A.4)
We can see from (A.2) thatR(U0,V0) are the function ofU0,
V0,yTandzT, and the stationary phase pointsU0andV0are the function ofyTandzT. Therefore,
∂R(U0,V0)
∂yT =RyT
(U0,V0) +RU0(U0,V0) ∂U0
∂yT
+RV0(U0,V0) ∂V0
∂yT
= yT
RT(U0)
+
U0
RT(U0)
+ U0
RR(U0,V0)
∂U0
∂yT
+ V0
RR(U0,V0)
∂V0
∂yT
,
(A.5)
whereRyT(U0,V0),RU0(U0,V0) andRV0(U0,V0) denote the
first derivatives ofR(U0,V0) with respect to yT,U0andV0. Inserting (A.5) into (A.1) yields
∂Φ0
∂yT =k
yT
U2
0+y2T+ (H−zT)2
+
⎡
⎣k V0
U2
0+V02+ (H−zT)2
+kv
⎤ ⎦∂V0
∂yT
+
⎡
⎣k U0
U2
0+yT2+ (H−zT)2
+k U0
U02+V02+ (H−zT)2
+ku
⎤ ⎦∂U0
∂yT.
(A.6)
According to equations set (14), the terms in the two square brackets of (A.6) are equal to zero. Therefore, (A.6) can be simplified to be
∂Φ0
∂yT =k
yT
U2
0+y2T+ (H−zT)2
. (A.7)
Likewise, the first partial derivative ofΦ0with respect to
zT can be calculated.
∂Φ0
∂zT
=k∂R(U0,V0) ∂zT
+ku∂U0
∂zT
+kv∂V0
∂zT
=k ⎧ ⎪ ⎨ ⎪ ⎩
zT−H
U02+y2T+ (H−zT)2
+ zT−H
U2
0+V02+ (H−zT)2
⎫ ⎪ ⎬ ⎪ ⎭
+
⎡
⎣k V0
U2
0+V02+ (H−zT)2
+kv
⎤ ⎦∂V0
∂zT
+
⎡
⎣k U0
U2
0+yT2+ (H−zT)2
+k U0
U2
0+V02+ (H−zT)2
+ku
⎤ ⎦∂U0
∂zT
=zT−H
U0
⎧ ⎪ ⎨ ⎪ ⎩k
U0
U02+yT2+ (H−zT)2
+k U0
U02+V02+ (H−zT)2
⎫ ⎪ ⎬ ⎪ ⎭
=kuH−zT
U0 .
B. Derivation of the First Partial Derivatives of
U
0and
V
0with Respect to
y
Tand
z
TEvaluated at
y
T=
0,
z
T=
0
The first partial derivatives of equations set (14) with respect toyT can be written as
k ∂ ∂yT
⎡
⎣ U0
U2
0+yT2+(H−zT)2
+ U0
U02+V02+(H−zT)2
⎤ ⎦=0,
k ∂
∂yT
⎡
⎣ V0
U02+V02+ (H−zT)2
⎤ ⎦=0.
(B.1)
Expanding (B.1), we have
− yTU0
R3
T(U0) +
0 y2
T+ (H−zT)2
R3
T(U0)
+V 2
0+ (H−zT)2
R3
R(U0,V0)
1 ∂U0
∂yT
− U0V0
R3
R(U0,V0)
∂V0
∂yT =
0,
− U0V0
R3
R(U0,V0)
∂U0
∂yT
+U 2
0+ (H−zT)2
R3
R(U0,V0)
∂V0
∂yT =
0.
(B.2)
Therefore, the first partial derivates ofU0andV0with respect toyTevaluated atyT=0,zT =0 can be calculated as follows:
⎡
⎣ H2
U2 00+H2
3/2 +
V2 00+H2
U2
00+V002 +H2
3/2
⎤ ⎦∂U0
∂yT
yT=0,zT=0
− U00V00
U2
00+V002 +H2
3/2
∂V0
∂yT
yT=0,zT=0
=0,
−U00V00∂U0
∂yT
yT=0,zT=0
+U2 00+H2
∂V0
∂yT
yT=0,zT=0
=0.
(B.3)
For the determinant of coefficient matrix in equations set (B.3) is unequal to zero, that is,
H2 U2 00+H2
3/2+
V2 00+H2
U2
00+V002 +H2 3/2
−U00V00
U2
00+V002 +H2 3/2
−U00V00 U002 +H2
= H2 U2
00+H2
+ H
2
U2
00+V002 +H2
/
=0,
(B.4)
the solution of equations set (B.3) is
∂U0
∂yT
yT=0,zT=0
=0, ∂V0 ∂yT
yT=0,zT=0
=0.
(B.5)
Likewise, the first partial derivatives of equations set (14) with respect tozTcan be written as
k ∂ ∂zT
⎡
⎣ U0
U2
0+yT2+(H−zT)2
+ U0
U2
0+V02+(H−zT)2
⎤ ⎦=0,
k ∂ ∂zT
⎡
⎣ V0
U2
0+V02+ (H−zT)2
⎤ ⎦=0.
(B.6)
Expanding (B.6), we have
U0(H−zT)
R3T(U0)
+U0(H−zT)
R3R(U0,V0)
+
0 y2
T+ (H−zT)2
R3
T(U0)
+V 2
0+ (H−zT)2
R3
R(U0,V0)
1 ∂U0
∂zT
− U0V0
R3
R(U0,V0)
∂V0
∂zT =
0,
V0(H−zT)
R3
R(U0,V0)
− U0V0
R3
R(U0,V0)
∂U0
∂zT
+U 2
0+ (H−zT)2
R3
R(U0,V0)
∂V0
∂zT =
0.
(B.7)
Therefore, the first partial derivates ofU0andV0with respect tozTevaluated atyT=0,zT=0 can be calculated as follows:
U00H
U2
00+H2
3/2 +
U00H
U2
00+V002 +H2
3/2
+
⎡
⎣ H2
U2 00+H2
3/2 +
V002+H2
U2
00+V002+H2
3/2
⎤ ⎦∂U0
∂zT
yT=0,zT=0
− U00V00
U2
00+V002 +H2
3/2
∂V0
∂zT
yT=0,zT=0
=0,
V00H−U00V00∂U0
∂zT
yT=0,zT=0
+U002 +H2
∂V0
∂zT
yT=0,zT=0
=0.
(B.8)
Solving the equations set (B.8), we obtain
∂U0
∂zT
yT=0,zT=0
= −U00
H ,
∂V0
∂zT
yT=0,zT=0
= −V00
H .
C. Derivation of the Second Partial Derivatives
of
U
0and
V
0with Respect to
z
TEvaluated at
y
T=
0,
z
T=
0
The first partial derivatives of equations set (B.7) with respect tozTcan be written as
∂ ∂zT
U0(H−zT)
R3T(U0)
+U0(H−zT)
R3R(U0,V0)
+
0 y2
T+ (H−zT)2
R3
T(U0)
+V 2
0+ (H−zT)2
R3
R(U0,V0)
1 ∂U0
∂zT
− U0V0
R3
R(U0,V0)
∂V0
∂zT
=0,
∂ ∂zT
V0(H−zT)
R3R(U0,V0)
− U0V0
R3R(U0,V0)
∂U0
∂zT
+ U 2
0+ (H−zT)2
R3
R(U0,V0)
∂V0
∂zT
=0.
(C.1)
Expanding (C.1) and inserting (B.9) into it, we can obtain that the second partial derivatives ofU0andV0with respect tozTevaluated atyT =0,zT =0 satisfy the following
equations set, that is,
⎡
⎣ H2
U002 +H2
3/2 +
V2 00+H2
U002 +V002 +H2
3/2
⎤ ⎦∂2U0
∂z2
T
yT=0,zT=0
− U00V00
U002 +V002 +H2
3/2
∂2V 0
∂z2
T
yT=0,zT=0
=0,
−U00V00∂ 2U
0
∂z2
T
yT=0,zT=0
+U2 00+H2
∂2V 0
∂z2
T
yT=0,zT=0
=0.
(C.2)
For equations set (C.2) have the same coefficient matrix with equations set (B.3), we can obtain the solution of equations set (C.2) as follows.
∂2U 0
∂zT2
yT=0,zT=0
=0,
∂2V 0
∂z2
T
yT=0,zT=0
=0.
(C.3)
Acknowledgments
This research was supported by Major Program of National Natural Science Foundation of China (Grant no. 60890070), National Natural Science Funds for Distinguished Young Scholar (Grant no. 60725103) and National High Technology Research and Development Program of China (Grant no. 2007AA12Z116). The authors would like to thank Dr.
Zheng-Shu ZHOU of Terrestrial Mapping and Monitoring Stream of CSIRO and Dr. Xiu-Feng SONG of University of Florida for helping improve the English of the manuscript. They also would like to thank the academic editor and anonymous reviewer(s) for their helpful comments which greatly improved the manuscript.
References
[1] B. R. Mahafza,Two- and three-dimensional synthetic aperture radar imaging using a linear array with transverse motion, Ph.D. dissertation, The University of Alabama in Huntsville, Huntsville, Ala, USA, 1989.
[2] C. H. Gierull, “On a concept for an airborne downward-looking imaging radar,”AEU-Archiv f¨ur Elektronik und Uber-tragungstechnik, vol. 53, no. 6, pp. 295–304, 1999.
[3] R. Giret, H. Jeuland, and P. Enert, “A study of a 3D-SAR concept for a millimeter-wave imaging radar onboard an UAV,” in Proceedings of the 1st European Radar Conference (EURAD ’04), pp. 201–204, Amsterdam, The Netherlands, October 2004.
[4] J. F. Nouvel, H. Jeuland, G. Bonin, S. Roques, O. du Plessis, and J. Peyret, “A Ka band imaging radar: DRIVE on board ONERA motorglider,” in Proceedings of the International Geoscience and Remote Sensing Symposium (IGARSS ’06), pp. 134–136, Denver, Colo, USA, August 2006.
[5] J. F. Nouvel, S. Roques, and O. Ruault du Plessis, “A low-cost imaging radar: DRIVE on board ONERA motorglider,” in
Proceedings of the International Geoscience and Remote Sensing Symposium (IGARSS ’07), pp. 5306–5309, Barcelona, Spain, July 2007.
[6] J. F. Nouvel, O. Ruault du Plessis, J. Svedin, and A. Gustafs-son, “ONERA DRIVE project,” in Proceedings of 7th Euro-pean Conference on Synthetic Aperture Radar (EUSAR ’08), Friedrichshafen, Germany, June 2008.
[7] J. F. Nouvel and O. Ruault du Plessis, “The ONERA compact SAR in Ka band,” inProceedings of 7th European Conference on Synthetic Aperture Radar (EUSAR ’08), Friedrichshafen, Germany, June 2008.
[8] J. Klare, A. R. Brenner, and J. H. G. Ender, “A new airborne radar for 3D imaging—image formation using the ARTINO principle,” in Proceedings of 6th European Conference on Synthetic Aperture Radar (EUSAR ’06), Dresden, Germany, May 2006.
[9] J. Klare, “A new airborne radar for 3D imaging—simulation study of ARTINO,” inProceedings of 6th European Conference on Synthetic Aperture Radar (EUSAR ’06), Dresden, Germany, May 2006.
[10] M. Weiß, J. Ender, O. Peters, and T. Espeter, “An airborne radar for three dimensional imaging and observation—technical realisation and status of ARTINO,” inProceedings of 6th Euro-pean Conference on Synthetic Aperture Radar (EUSAR ’06), Dresden, Germany, May 2006.
[11] J. Klare, M. Weiß, O. Peters, A. R. Brenner, and J. H. G. Ender, “ARTINO: a new high resolution 3D imaging radar system on an autonomous airborne platform,” inProceedings of the International Geoscience and Remote Sensing Symposium (IGARSS ’06), Denver, Colo, USA, August 2006.
[13] M. Weiß, O. Peters, and J. Ender, “A three dimensional SAR system on an UAV,” inProceedings of the IEEE International Geoscience and Remote Sensing Symposium (IGARSS ’07), pp. 5315–5318, Barcelona, Spain, July 2007.
[14] J. Klare, A. Brenner, and J. Ender, “Impact of platform attitude disturbances on the 3D imaging quality of the UAV ARTINO,” inProceedings of 7th European Conference on Synthetic Aperture Radar (EUSAR ’08), Friedrichshafen, Germany, June 2008. [15] M. Weiß, O. Peters, and J. Ender, “First flight trials with
ARTINO,” inProceedings of 7th European Conference on Syn-thetic Aperture Radar (EUSAR ’08), Friedrichshafen, Germany, June 2008.
[16] J. Klare, “Digital beamforming for a 3D MIMO SAR— improvements through frequency andwaveform diversity,” in
Proceedings of the International Geoscience and Remote Sensing Symposium (IGARSS ’08), vol. 5, pp. 17–20, Boston, Mass, USA, July 2008.
[17] A. Reigber, Airborne polarimetric SAR tomography, Ph.D. dissertation, University Stuttgart, Stuttgart, Germany, 2001. [18] J. M. Lopez-Sanchez and J. Fortuny, “3-D radar imaging using
range migration techniques,”IEEE Transactions on Antennas and Propagation, vol. 48, no. 5, pp. 728–737, 2000.
[19] J. Fortuny,Efficient algorithms for three-dimensional near-field synthetic aperture radar imaging, Ph.D. dissertation, University of Karlsruhe, Karlsruhe, Germany, 2001.
[20] W. Tan, W. Hong, Y. Wang, Y. Lin, and Y. Wu, “Synthetic aperture radar tomography sampling criteria and three-dimensional range migration algorithm with elevation digital spotlighting,”Science in China F, vol. 52, no. 1, pp. 100–114, 2009.
[21] Y. Qixiao and S. Yonghuan,Practical Mathematics Handbook, Science Press, Beijing, China, 2nd edition, 2006.