Title page
Five year trends (2008-2012) in cardiac implantable electrical device utilization in 5 European
nations: a case study in cross-country comparisons using administrative databases
List of authors:
Helen Banks,1 Aleksandra Torbica,1 Cinzia Valzania,2 Yauheniya Varabyova,3 Valentina Prevolnik Rupel,4 Rod S. Taylor,5 Theresa Hunger,6 Simon Walker7 Giuseppe Boriani,8 Giovanni Fattore,9,1 for the MedtecHTA group
1Centre for Research on Health and Social Care Management, Bocconi University, Milan, Italy 2Institute of Cardiology, Department of Experimental, Diagnostic and Specialty Medicine, University
of Bologna, S. Orsola-Malpighi University Hospital, Bologna, Italy
3Hamburg Center for Health Economics, Universität Hamburg, Hamburg, Germany 4Institute for Economic Research, Ljubljana, Slovenia
5Evidence Synthesis & Modelling for Health Improvement, Institute of Health Research, University of
Exeter Medical School, Exeter, UK
6The University for Health Sciences, Medical Informatics and Technology, Hall in Tyrol, Austria 7Centre for Health Economics, University of York, York, UK
8Cardiology Department, University of Modena and Reggio Emilia, Policlinico di Modena, Modena,
Italy.
9Department of Policy Analysis and Public Management, Bocconi University, Milan, Italy
Author Contributions
Conceived and designed the study: GF, AT, CV, GB, HB. Analyzed the data: HB GF. Drafted the paper: HB. Coordinated and supervised data collection and elaboration: HB, AT, YV, VPR, TH, SW.
Addresses:
Helen Banks, MA, Cergas, Università Bocconi, Via Roentgen, 1, 20136 Milan, Italy. E-mail [email protected], tel. +39 02 5836.5252
Alexandra Torbica, PhD, Cergas, Università Bocconi, Via Roentgen, 1, 20136 Milan, Italy. E-mail [email protected]
Cinzia Valzania, MD PhD, Cardiology Department, S.Orsola Malipighi Hospital, University of Bologna, Bologna, Italy, email [email protected]
Yauheniya Varabyova, MSc, Esplanade 36, 20354 Hamburg, Germany, Email: [email protected]
Valentina Prevolnik Rupel, PhD, Institute for Economic Research, Kardeljeva ploščad 17, 1000 Ljubljana, Slovenia. email [email protected]
Rod S. Taylor, PhD, Evidence Synthesis & Modelling for Health Improvement, Institute of Health Research, University of Exeter Medical School, St Luke's Campus, Heavitree Road, Exeter, EX1 2LU, United Kingdom [email protected]
Theresa Hunger, MPH, Dept. of Public Health, Health Services Research and Health Technology Assessment, UMIT - University for Health Sciences, Medical Informatics and Technology, Eduard Wallnoefer Center I, 6060 Hall i.T., AUSTRIA, [email protected]
Simon Walker, MSc, Centre for Health Economics, University of York, North Yorkshire, UK YO1 6EN, email: [email protected]
Giuseppe Boriani, MD, PhD, Cardiology Dept., AOU Policlinico di Modena, Via Del Pozzo 71, 41124 Modena, Italy, email: [email protected]
Giovanni Fattore, PhD, Cergas, Università Bocconi, Via Roentgen, 1, 20136 Milan, Italy. E-mail [email protected]
Abbreviations
AMI - acute myocardial infarction CCI - Charlson Comorbidity Index CRT - cardiac resynchronization therapy DRG - diagnosis-related group
EHRA - European Heart Rhythm Association HD - hospital discharge
HTA – Health Technology Assessment
ICD - automatic implantable cardioverter-defibrillator
ICD9-CM – International Classification of Disease-9th Revision-Clinical Modification ICD-10 - International Classification of Diseases, 10th Revision
MedtecHTA - Methods for Health Technology Assessment of Medical Devices PM - pacemaker
Introduction
With rates of cardiovascular disease rising rapidly worldwide, problems of prevention and treatment of common cardiovascular conditions will challenge all health care systems. Systems for monitoring health care intervention are needed to track outcome results, access to care and compliance with clinical recommendations as well as guide health policy and resource planning.1 An evidence-based approach to health care provision and planning requires access to information in a timely manner.2 “Big data” in the form of routinely collected real world data provides a solution.3 However, exemplar exploitation of such large datasets remains elusive, and few studies have tried to use common methodologies with analogous data sets in diverse countries to compare practices and outcomes for specific therapeutic areas and interventions.
in the field of electrophysiology from 2008-2012 in the five European nations involved in the project (Austria, England, Germany, Italy and Slovenia). The study builds on previous studies that have used real world data to measure outcomes and new technology adoption.4-5 We chose two classes of medical devices, pacemakers (PMs) and automatic implantable cardioverter-defibrillators (ICDs), with strong supporting evidence of efficacy,6-7 significant health expenditure outlays,8-9 and the potential to compare our results with an existing monitoring program conducted by the European Heart Rhythm Association (EHRA) of the European Society of Cardiology in 50 member nations.10
Previous studies of trends in PM and ICD implant rates,11-12 have considered device type,13-14 implants versus replacements,15 determinants of geographic variation,16-18 and international comparisons.19-20 However, heterogeneous data sources and measurement protocols in these studies make comparisons difficult, may bias or limit ongoing monitoring, and may preclude the application of “big data” sets for routine use in policy making. To our knowledge, no studies to date have used hospital discharge administrative data to compare implant rates and patient management measurements for PMs and ICDs across countries using a common methodology.
Methods
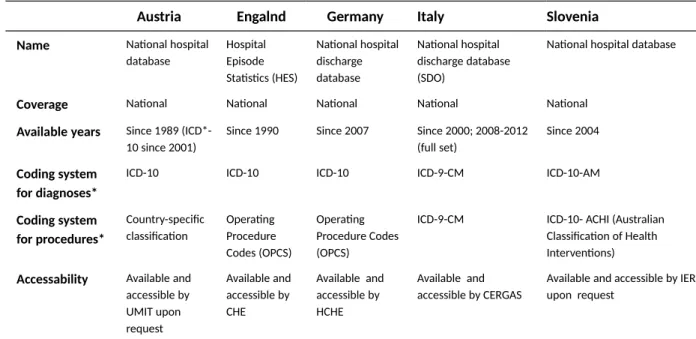
Coding systems for HD data in Austria, England, Germany, Italy and Slovenia, MedtecHTA partners, were described (Table 1); lists of procedural codes for PMs and ICDs were compared and cross-referenced, identifying 16 device categories – implants and replacements of single chamber, dual chamber, and biventricular or cardiac resynchronization therapy (CRT) devices plus an additional unspecified device category found in some of the coding systems (Table A1 in the supplementary material provides a list of all device variables and codes from the five countries). Codes regarding device removal or revisions or specifying only temporary or partial implantation (e.g., leads, loop recorders, temporary implants, pocket revisions) were excluded to identify only implants or replacements and avoid duplicates.
A common protocol (in Stata version 12 or SAS version 9) was developed to extract all HD records for the years 2008-2012 (except England, where data for 2012 were not yet available) where the identified codes were found in any of the procedural code fields to form each country’s database of individual records. Device subtypes (single chamber, dual chamber, CRT and unspecified) were counted separately and as grouped categories to test the ability of the methodology to discriminate types of devices associated with varying indications and costs (i.e., costs per device rise from single to dual to CRT subtypes for both devices). Limited patient characteristics (residency, gender, age, comorbidities) were available for each record, however, for privacy reasons individual patient codes were not provided. Thus, the analysis is by hospital admission, and repeat hospitalizations per patient are not discernible.
Subsequent common protocols extracted aggregate national and regional figures, measured patient characteristics and patient management practices, and applied the Charlson Comorbidity Index (CCI) methodology21 to identify comorbidities through primary and secondary diagnostic codes associated with each record. Supplementary Table A2 includes a list of project variables. Aggregate data from these analyses formed a central project database, which was linked to population data (by region, age class and gender) available online from the Organisation for Economic Co-operation and Development and Eurostat websites, to calculate crude implant rates.
Results are presented as crude implant rates adjusted for age according to the direct standardization method using the age distribution of the Revised European standard population, 2013.** Comparisons to EHRA White Book data10 were used to check results.
Results
Numbers and crude first implant and replacement rates
Our datasets included information on 1,338,199 hospitalizations for implants or replacements of the target medical devices from 2008-2012 for Austria, Germany, Italy and Slovenia, and 2008-2011 for England – and averaged 212,952 PM procedures and 62,567 ICD procedures per year for the four years for which complete data were available (Table 2). The combined population of the five countries averaged 204.4 million per year (in millions, 8.4 in Austria, 52.1 in England, 81.9 in Germany, 60.0 in Italy and 2.0 in Slovenia). This translates to an all-country crude implant rate of 104.2 PMs and 30.6 ICDs per 100,000 inhabitants per year over the four years for combined implants and replacements. Overall numbers of these medical devices from 2008-2012 have increased markedly over the five-year period, rising at a rate of increase far outpacing population changes. (Table 2 here)
Considering only first implants, according to coding practices, the all-country crude first implant rate per 100,000 inhabitants averaged 81 for PMs and 25 for ICDs per year over the period (Fig. 1). The crude replacement rate/100,000 averaged 24 for PMs and 7 for ICDs per year over the period. Crude first implant rates increased over all years in all countries except Slovenia, which saw slight decreases in rates for PMs and ICDs in 2010 and 2011 but remained essentially stable by 2012. England had the most marked increase in crude PM first implant rates between 2008 and 2011 (40%), followed by Germany (10%), Slovenia (9%), Austria (7%) and Italy (4%) between 2008 and 2012 (Fig. 1). All countries showed large increases in crude first implant rates/100,000 over the period for ICDs, ranging from 14% in Italy to 72% in Slovenia. Increases in crude replacement rates/100,000 for ICDs
ranged from 30% in Slovenia to over 100% in Italy from 2008-2012, increasing roughly 70% in the other three countries; PM crude replacement rates remained fairly constant, with slight increases in Germany, Italy and England and a 5% drop in Austria. No codes exist for PM replacement in Slovenia. (Figure 1 here)
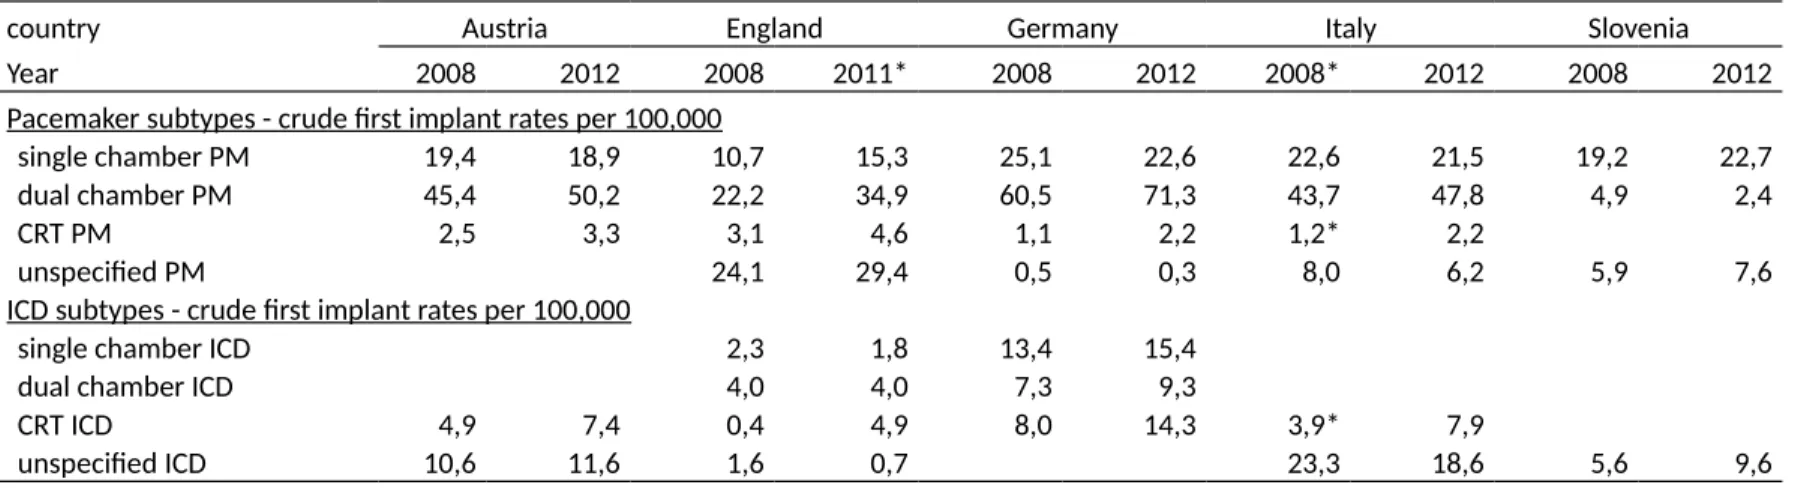
Considering device subtypes for first implants (Table 3), some evidence of a shift from single chamber to dual chamber PMs is observed, but the greatest increases in the crude rate of first implant/100,000 were for CRT PMs (2.9 to 4.6 in Austria, 3.1 to 4.6 in England, 1.4 to 2.8 in Germany, 1.7 to 3.4 in Italy). Crude first implant rates/100,000 for CRT ICDs also rose markedly (5.8 to 9.5 in Austria, 0.4 to 4.9 in England, 9.6 to 18.2 in Germany and 5.0 to 12.2 in Italy).
(Table 3 here)
Age class, gender, and patient management measures
Crude implant rates/100,000 of PMs by age class and gender show low rates observed in younger patients, a predominance of males over females, and rates rising considerably with each age group for PM first implants and replacements (Table 4, section 4a). For ICDs, crude first implant rates/100,000 for females rise with each age group except for the 75 years and above, which fall, a phenomenon observed in Austria and Slovenia also for males, whereas in England, Germany and Italy, rates for males rise for ICD first implants through each age group (Table 4, section 4b). Differences among nations can be seen throughout: Italy and Germany show implant rates well above the levels of the other three countries for ICDs. Austria and England are on par or even exceed Germany for PM implant rates by age group, with England most often registering the highest rates among the countries for the younger age groups in PM implants and replacements. Slovenia’s crude implant rates are consistently the lowest for the categories where codes exist, with the exception of two age groups for females for ICD first implants.
(Table 4 around here)
patients were male. The predominance of males over females changed markedly with rising age groups for PMs (57% male for 0-44 years, 66% for 45-64, 63% for 65-74 and 52% over 74), but remained more stable for ICDs (70% male for 0-44 years, 81% for 45-64, 81% for 65-74 and 78% for over 74). Patients over 74 years accounted for the majority of cases in the database (64.4%) for PMs, ranging among countries in 2011 as follows: England (56.3%), Germany (64.4%), Slovenia (65.7%), Austria (65.8%) and Italy (70.9%). For ICDs, the 65-74 age group for all countries combined was most numerous (36.5%), followed by 45-64 years (30.6%) and >74 years (27.4%). In 2011, the >74 age group accounted for 18.8% of cases in Slovenia, 21.3% in Austria, 27.1% in Germany, 28.4% in England and 33.1% in Italy. The >74 age group accounted for 70.5% of women receiving PMs, compared to 29.1% of women receiving ICDs. Among males receiving PMs, 59.6% were >74, compared to 27.0% for males receiving ICDs.
In all countries except England, more than 90% of patients were discharged to home, and, in those countries where detailed discharge codes were available, relatively few patients were transferred to other care facilities, mostly for acute care (Table 4). In-hospital mortality was very low and stable over time, and most deaths occurred during hospitalizations associated with PM first implants. Between 85 and 100% of procedures were performed in the inpatient setting, while some countries (Italy and England) made marked use of the day hospital setting, primarily for ICD and PM replacements. However, data regarding day hospital admissions were not available for Germany. Mean and median lengths of stay (excluding outliers beyond the 99th percentile) showed wide variation for hospitalizations associated with first implants of PMs (e.g., means of 6.7 to 10.1 days and medians from 3 to 8 days in 2011) and ICDs (e.g., means of 6.7 to 13.1 days and medians from 2 to 10 days in 2011). Within countries, lengths of stay for hospitalizations associated with implants were generally more than double those for replacements (see also Supplementary table A3 for complete descriptive statistics by device category).
Mean weighted CCI scores (Table 4) measure the relative state of health of one device category group as opposed to another, but do not necessarily indicate the relative risk of death of the patients receiving the type of medical device. Percentages of CCI scores of >=2 indicate those patients with at least two major comorbidities among the diagnoses included in the hospital records, except for Austria, where only the primary diagnostic code was available. Results for two prevalent and relevant diagnosis categories, acute myocardial infarction (AMI) and congestive heart failure, are reported in Table 4 for PMs and ICDs, respectively. The percentages indicate the share of patients where one of the major CCI categories was observed in at least one of the primary or secondary diagnostic codes; in the case of Austria, only where the CCI category was observed in the primary diagnostic code. Numbers of diagnostic fields ranged from only one in Austria to nearly 100 in Germany, making comparisons difficult, but certain patterns emerged:
Higher mean CCI weighted scores across groups of patients for first implants vs.
replacements for devices, higher mean scores for first implants of ICDs vs. PMs.
Percentages of patients with CCI weighted scores ≥2 follow a similar pattern (excluding
Austria), with highest values for ICD implants, followed by ICD replacements, PM implants and PM replacements, for example for 2011, in Germany (68.9%, 47.9%, 43.1%, 30.0%, respectively), Slovenia (41.4%, 35.0%, 25.2%), England (35.0%, 24.2% 22.5%, 13.4%) and Italy (29.1%, 16.4%, 14.7%, 6.7%).
Less evidence of AMI among patients receiving PMs compared to ICDs: for implants, 1% vs.
5% in England, 9% vs. 35% in Germany, 5% vs. 14% in Italy, 6% vs. 26% in Slovenia, and in Austria, 1.1% vs. 2.0%.
Congestive heart failure is observed as a primary or secondary diagnosis among patients
Table 5 shows results from several years of EHRA White Books10 compared with MedtecHTA study results, classified according to White Book specifications. Though results showed fairly similar numbers for some countries and some device categories, numbers for England are only indicative since the measure for EHRA is the entire United Kingdom. Totals for PMs in Slovenia differ by as much as 100% (though numbers are small), and in fact seem largely under-reported in our data. (Table 5 here)
Standardized implant rates, national and regional–adjusted for age
To control for the effects of differences in the population makeup of each country, rates for combined first implants and replacements per 100,000 inhabitants were adjusted for age by direct standardization using the European standard population, version 2013, from Eurostat (Fig. 2). With standardization, rates for PMs and ICDs were adjusted upward for Austria, England and Slovenia and generally slightly downward for Germany and Italy. Variation in adjusted PM rates for the first four countries was lessened, but Slovenia’s adjusted rates still remained well below half those of other countries. Differences in ICD rates were not significantly reduced by age standardization. Regional totals were also adjusted by age (based on 1,330,098 records where regional residency and age class data were complete); Figure 3 shows the year 2011, as a representative example of all years. Large differences in the combined first implant and replacement rates for PMs and ICDs between regions are observed, with the exception of ICDs in England.
(Figures 2 and 3 here) Discussion
The collection of routine real world data (so-called ‘big data’) for health care management and administrative purposes has a long history. In recent years there has been increasing use of such for research on performance measurement, access to care, outcomes and quality.*** The use of diagnostic and procedure codes that, with few adjustments, can be used as a common language has opened up the possibility for increasing use as a policy making tool. Moreover, the cost of accessing
and analyzing such data for research can be relatively inexpensive compared to some other methodologies, such as registries or clinical trials. Thus, we sought to examine whether and how service use and access to medical technology in the field of electrophysiology could be compared using a common methodology with HD administrative data and how this might aid in identifying problem areas at various levels and determine opportunities for intervention. HD data was interrogated for the years 2008 to 2012, and databases were constructed in five European countries (Austria, England, Germany, Italy and Slovenia) for a combined total of 1,338,199 hospitalizations associated with first implants and replacements of PMs or ICDs.
Comparison to figures published in the EHRA White Books10 was instrumental in validating our data, even if differences in how devices are classified and how implants are distinguished from replacements affect such comparisons. We were limited by partial data for the United Kingdom in our study (only England), and a suspected overestimation of PM rates in England. Efforts to adjust the rates were discussed, in particular by repeating the analysis by individual patient identification numbers; however, this would have made comparisons with the other nations inaccurate and raised privacy concerns. Apparent coding problems also limit conclusions for PMs from Slovenian data. In fact, some of the codes (38253-01 to 38253-10) were removed from the coding system on December 31, 2010, resulting in coding PM implants under other, unspecified codes. When consulted, clinical experts and hospital administrators in Slovenia reported financial disincentives to record all PM implants and estimated under-reporting by roughly 50 percent for PM implants, as appears to be the case in our comparison to EHRA data. The methodology, however, was instrumental in reporting this discrepancy.
crude rates in Germany. With ageing populations, it can be important to use data that allows for such adjustments in measuring trends where age figures prominently in patient assessment and disease progression.13 Indeed, after adjusting for age, the differences between Germany, Austria and England for PMs lessened considerably, whereas Italy dropped slightly below the others and Slovenia remained far below, though under-reporting in Slovenia compromises results.
For ICDs, differences among countries in both crude and adjusted implant rates per 100,000 inhabitants persist, as reported elsewhere.11 Within country and between country variation remained substantial at the regional level even after adjusting for age, as has been seen in other countries. 12-13,16 The exception in our data is England, where rates for ICDs are similar across regions though
generally lower than Austria, Germany and Italy. Suggestions for possible reasons behind these persistent differences include: economic factors; hospital and regional factors; varying levels of adherence to clinical guidelines; and differing prescribing policies, as for example in the UK, which appears to have exerted downward pressure on implant rates for ICDs at both national and regional levels.7,16,22 Slovenia remains markedly lower in ICD implant rates, which might be explained by economic factors such as lower GDP per capita in comparison to the other countries coupled with the high cost of ICDs and CRT subtypes of both medical devices, even though results have been mixed on how and how much economic factors affect access to these technologies.13,16-17,20
Regarding changes in numbers and implant rates of the four device types (single chamber, dual chamber, CRT and unspecified), we observed results similar to studies in France and the USA12-14 with regard to PMs: a predominance of dual chamber PMs and relatively few CRT PM device types; in Slovenia, single chamber PMs still dominate, but a lack of codes in Slovenia to indicate CRT devices makes interpretation difficult. For ICDs, the distinction into four device types is not observable in three of four coding systems, but we do see an upward trend in CRT subtypes, as expected with increased indications and as observed elsewhere.12,14-15
single device category (16 types) and in the four main groupings of ICD and PM implants and replacements. ALOS were highest for admissions associated with PM first implants, followed by ICD first implants, and decreased for replacements, similar to US and French studies.12,22-23 As expected from initial investigations of country practices conducted for the project, the data confirmed the use of the inpatient setting for the vast majority of hospitalizations, with day hospital used largely for replacement procedures and in fewer countries, most notably Italy and England (German data were limited to inpatient admissions). Most patients were discharged to home, transfers to other facilities were limited, and although few patients died in the hospital, PM implants showed the highest percentage of in-hospital deaths, both in absolute and relative terms, as has been observed in at least one other study.23
Despite increased indications for ICDs, males outnumber females roughly four-to-one, which is in line with previous studies showing a predominance of ICD and CRT ICD implants in men.24-26 The reasons for these discrepancies are unknown, and studies suggest that even after controlling for demographic variables and comorbidities men are still more likely than women to receive ICD/CRT-D implants.24 CCI analysis showed that within each country patients receiving ICDs had relatively more comorbidities registered in their HD records compared to PM patients, compared to mixed results from US studies;15,23 however, a lack of standardization in recording the number and order of diagnoses in HD records among our countries does not allow for direct comparisons of patient groups by single diagnoses. ICD implantation for primary versus secondary prevention of sudden cardiac death was not directly observable in the data. Nevertheless, our data can show differences over time in the employment of specific types of devices in patients with key comorbidities, providing a useful policy tool.
While EHRA has shed considerable light on the implant rates of these medical devices in numerous countries, data sources for these reports often come from registry or survey data, which can mean significant variation in data collection methods, quality and completeness, inconsistent reporting of specific device types and an absence of patient and clinical information. Industry reports are also sometimes used, potentially introducing an upward bias for medical devices purchased but not used. Our use of HD data is arguably less biased, more complete, and more readily available for the countries studied here and appears to be a promising approach for collecting outcome data on large cohorts of patients, as has been shown previously in assessing ICDs.4
Overall, the methodology employed showed that common protocols and cross-referencing of codes from individual country HD databases can provide useful and reliable data for cross-country analysis, even in the absence of individual patient codes. The methodology can be replicated in many countries for medical devices – and likely for other surgical procedures, though not performed here -to measure geographic differences in access -to care, patient management practices and, -to some extent, compliance with clinical recommendations and appropriateness for clinical indications, as documented in diagnostic codes. Additionally, protocols were run on country databases, eliminating the need for data transfer and safeguarding patient privacy. Delays related to access to the data and privacy protection in various countries occurred, suggesting that lead times must be seriously considered in undertaking such research and monitoring on a larger scale. Methods described here may be useful in HTA to determine the present state of treatment with medical devices or specific surgical procedures when a new treatment is proposed, but they cannot replace analysis of clinical evidence gleaned from clinical studies, systematic literature reviews and meta-analyses for use in approving a new treatment on the basis of superior efficacy.
reliability, replacement rates per patient and primary versus secondary prevention. We suggest extending the research on how clinical guidelines are applied at the regional and hospital levels. Finally, considering that the risk of cardiovascular disease is believed to be underestimated in women,27 along with our findings of persistent gender differences in ICD implant rates, further investigation of gender effects using this type of data is encouraged.
Acknowledgements
The authors gratefully thank the Italian Ministry of Health for providing data from the Italian National Hospital Discharge Database for this study (http://www.salute.gov.it/portale/temi/p2_4.jsp?area= ricoveriOspedalieri).
Conflict of interest: none.
References
1. Fuster V. Global burden of cardiovascular disease: Time to implement feasible strategies and to monitor results. Journal of the American College of Cardiology 2014; 64(5):520-522.
2. Brownson RC, Fielding JE, Maylahn CM. Evidence-based public health: a fundamental concept for public health practice. Annu Rev Public Health 2009;3 0:175-201.
3. Khoury MJ, Ioannidis JPA. Big data meets public health. Science 2014; 346(6213):1054-1055.
4. Ghislandi S, Torbica A, Boriani G. Assessing the outcomes of implantable cardioverter defibrillator treatment in a real world setting: results from hospital record data. BMC Health Serv Res. 2013 Mar 15; 13:100
5. Bech M, Christiansen T, Dunham K, Lauridsen J, Hampus Lyttenkens C, McDonald K, et al. The influence of economic incentives and regulatory factors on the adoption of
treatment technologies: a case study of technologies used to treat heart attacks. Health Economics 2009; 18:1114-1132.
6. Brignole M, Auricchio A, Baron-Esquivias G, Bordachar P, Boriani G, Breithardt OA, et al. 2013 ESC Guidelines on cardiac pacing and cardiac resynchronization therapy: the Task Force on cardiac pacing and resynchronization therapy of the European Society of Cardiology (ESC). Developed in collaboration with the European Heart Rhythm Association (EHRA). Eur Heart J 2013; 34:2281-329.
8. Mond HG, Proclemer A. The 11th world survey of cardiac pacing and implantable cardioverter-defibrillators: calendar year 2009--a World Society of Arrhythmia's project. Pacing Clin Electrophysiol 2011; 34:1013-27
9. Camm J, Klein H, Nisam S. The cost of implantable defibrillators: perceptions and reality. European Heart Journal 2007; 28:392-397
10. The EHRA White Books. http://www.escardio.org/The-ESC/Communities/European-Heart-Rhythm-Association-(EHRA)/Publications/The-EHRA-White-Books . Accessed March 25, 2014.
11. Arribas F, Auricchio A, Boriani G, Brugada J, Deharo JC, Hindriks G, et al. Statistics on the use of cardiac electronic devices and electrophysiological procedures in 55 ESC countries: 2013 report from the European Heart Rhythm Association (EHRA). Europace 2014; 16:i1-i78.
12. Tuppin P, Neumann A, Marijon E, de Peretti C, Weill A, Ricordeau P, et al. Implantation and patient profiles for pacemakers and cardioverter-defibrillators in France (2008-2009). Archives of Cardiovascular Disease 2011; 104:332-342.
13. Ovsyshcher LE, Furman S. Determinants of geographic variations in pacemakers and implatable cardioverter defibrillators implantation rates. PACE 2003; 26:474-478. 14. Greenspon AJ, Patel JD, Lau E, Ochoa JA, Frisch DR, Ho RT, et al. Trends in permanent
pacemaker implantation in the United States 1993 to 2009. JACC 2012; 60(16):1540-1545.
15. Kurtz SM, Ochoa JA, Lau E, Shkolnikov Y, Pavri BB, Frisch D, Greenspon AJ. Implantation trends and patient profiles for pacemakers and implantable cardioverter defibrillators in the United States: 1993-2006. Pacing Clin Electrophysiol 2010; 33(6):705-711.
17. Lubinski A, Bissinger A, Boersma L, Leenhardt A, Merkely B, Otto A, et al. Determinants of geographic variations in implantation of cardiac defibrillators in the European Society of Cardiology member countries-data from the European Heart Rhythm Association White Book. Europace 2011; 13:654-662.
18. Torbica A, Banks H, Valzania C, Boriani G, Fattore G. (2017), Investigating regional variation of cardiac implantable electrical device implant rates in European Healthcare Systems: What drives differences? Health Economics; 26(Suppl. 1):30-45.
19. Hatala R, Lunati M, Calvi V, Favale S, Goncalvesová E, Haim M, et al. (2015), Clinical implementation of cardiac resynchronization therapy—Regional disparities across selected ESC member countries. Annals of Noninvasive Electrocardiology; 20:43–52. 20. Merkely B, Roka A, Kutyifa V, Boersma L, Leenhardt A, Lubinski A, et al. Tracing the
European course of cardiac resynchronization therapy from 2006 to 2008. Europace 2010; 12:692-701.
21. Charlson ME, Pompei P, Ales KL, MacKenzie CR. A new method of classifying prognostic comorbidity in longitudinal studies: development and validation. J Chronic Dis 1987; 40:373-83.
22. Valzania C, Torbica A, Tarricone R, Leyva F, Boriani G. Implant rates of cardiac implantable electrical devices in Europe: A sistematic literature review. Health Policy 2016; 120:1-15.
23. Zhan C, Baine WB, Sedrakyan A, Steiner C. Cardiac device implantation in the United States from 1997 through 2004: A population-based analysis. J Gen Intern Med 2007; 23(Suppl I):13-19.
25. Dickstein K, Bogale N, Priori S, Auricchio A, Cleland JG, Gitt A, et al, The European cardiac resynchronization therapy survey. Eur Heart J 2009; 30:2450-2460.
26. Gadler F, Valzania C, Linde C. Current use of implantable electrical devices in Sweden: data from the Swedish pacemaker and implantable cardioverter-defibrillator registry. Europace 2015; 17:69-77.
Table 1. Main features of hospital discharges databases in 5 countries
Austria Engalnd Germany Italy Slovenia
Name National hospital database Hospital Episode Statistics (HES) National hospital discharge database National hospital discharge database (SDO) National hospital database
Coverage National National National National National
Available years
Since 1989 (ICD*-10 since 2001)
Since 1990 Since 2007 Since 2000; 2008-2012
(full set)
Since 2004
Coding system for diagnoses*
ICD-10 ICD-10 ICD-10 ICD-9-CM ICD-10-AM
Coding system for procedures* Country-specific classification Operating Procedure Codes (OPCS) Operating Procedure Codes (OPCS)
ICD-9-CM ICD-10- ACHI (Australian
Classification of Health Interventions)
Accessability Available and accessible by UMIT upon request Available and accessible by CHE
Available and accessible by HCHE
Available and accessible by CERGAS
Available and accessible by IER upon request
Table 2. Numbers, changes (%) and crude implant rates for combined first implants and replacements of PMs and ICDs, by device, country and year
% % % change % change % change Crude implant rate (implants + replacements) 2008 2009 2009/8 2010 2010/9 2011 2011/10 2012 2012/11 2012*/8 Total 2008 2009 2010 2011 2012 Pacemakers**
Austria 7,932 7,806 -1.6% 7,975 2.2% 8,204 2.9% 8,327 1.5% 5.0% 95.4 93.4 95.2 97.6 99.0
England 39,473 44,807 13.5% 48,163 7.5% 53,203 10.5% 34.8%* 77.0 86.8 92.6 101.4
Germany 90,317 93,575 3.6% 96,450 3.1% 97,956 1.6% 98,657 0.7% 9.2% 109.9 114.1 117.9 119.8 120.5 Italy 62,220 63,242 1.6% 63,914 1.1% 64,057 0.2% 64,100 0.1% 3.0% 104.4 105.3 105.9 105.7 107.9
Slovenia 602 665 10.5% 638 -4.1% 609 -4.5% 673 10.5% 11.8% 29.9 32.7 31.2 29.7 32.7
Total PMs 200,544 210,095 4.8% 217,140 3.4% 224,029 3.2% 171,757 NA 11.7%* 1,023,565 98.6 103.0 106.1 109.1 113.2 ICDs**
Austria 1,586 1,800 13.5% 1,856 3.1% 1,975 6.4% 2,097 6.2% 32.2% 19.1 21.5 22.2 23.5 24.9
England 5,654 6,841 21.0% 7,999 16.9% 8,454 5.7% 49.5%* 11.0 13.2 15.4 16.1
Germany 28,873 33,086 14.6% 36,693 10.9% 38,988 6.3% 40,849 4.8% 41.5% 35.1 40.3 44.9 47.7 49.9
Italy 16,554 18,117 9.4% 20,002 10.4% 21,083 5.4% 21,205 0.6% 28.1% 27.8 30.2 33.1 34.8 35.7
Slovenia 127 179 40.9% 202 12.8% 197 -2.5% 217 10.2% 70.9% 6.3 8.8 9.9 9.6 10.6
Total ICDs 52,794 60,023 13.7% 66,752 11.2% 70,697 5.9% 64,368 33.9%* 314.634 25,9 29,4 32,6 34,4 42,4
TOTAL database 1,338,199
Table 3. Crude first implant rates for Pacemakers and ICDs by device subtype, comparison 2008* to 2012*
country Austria England Germany Italy Slovenia
Year 2008 2012 2008 2011* 2008 2012 2008* 2012 2008 2012
Pacemaker subtypes - crude first implant rates per 100,000
single chamber PM 19,4 18,9 10,7 15,3 25,1 22,6 22,6 21,5 19,2 22,7
dual chamber PM 45,4 50,2 22,2 34,9 60,5 71,3 43,7 47,8 4,9 2,4
CRT PM 2,5 3,3 3,1 4,6 1,1 2,2 1,2* 2,2
unspecified PM 24,1 29,4 0,5 0,3 8,0 6,2 5,9 7,6
ICD subtypes - crude first implant rates per 100,000
single chamber ICD 2,3 1,8 13,4 15,4
dual chamber ICD 4,0 4,0 7,3 9,3
CRT ICD 4,9 7,4 0,4 4,9 8,0 14,3 3,9* 7,9
unspecified ICD 10,6 11,6 1,6 0,7 23,3 18,6 5,6 9,6
Table 4 Pacemakers and ICDs- crude first implant and replacement rates per 100.000 inhabitants by age class, patient characteristics, patient management measures– 2011.
4a – Pacemakers Pacemaker first implants Pacemaker replacements
2011 Austria England Germany Italy Slovenia Austria England Germany Italy Slovenia
Total number of HD records 5,967 44,122 78,494 45,951 609 2,237 9,081 19,462 18,106
Crude implant or replacement rate/100.000 inhabitants by age class
0-44 years – female 1.8 5.0 2.0 1.3 0.7 1.1 1.8 1.3 0.9
45-64 years – female 17.4 29.2 21.3 14.0 4.8 5.3 6.4 4.5 5.0
65-74 years – female 126.7 153.7 163.4 110.6 43.3 37.7 26.8 32.2 35.6
75 years and above – female 427.0 408.2 533.0 384.8 190.7 193.6 99.1 146.5 161.1
0-44 years – male 2.1 6.8 3.4 1.8 0.5 1.2 1.7 1.4 1.0
45-64 years – male 34.4 76.3 39.6 28.3 13.5 9.7 11.6 6.9 9.0
65-74 years – male 247.7 331.8 288.9 224.0 127.9 69.1 57.0 56.5 71.6
75 years and above – male 810.2 855.6 863.2 740.8 382.2 310.7 181.1 233.3 313.2
Patient Characteristics
Male (%) 55.9% 62.6% 54.0% 57.1% 57.0% 51.5% 58.3% 52.2% 56.4%
Ageclass 0-44 years (%) 1.5% 4.1% 1.4% 1.1% 1.1% 2.4% 5.7% 2.8% 1.6%
Ageclass 45-64 years (%) 10.0% 15.8% 9.1% 7.5% 8.9% 7.7% 13.1% 6.9% 6.3%
Ageclass 65-74 years (%) 24.7% 24.6% 26.4% 21.9% 24.3% 18.8% 20.6% 20.9% 17.8%
Ageclass 75 years and above (%) 63.9% 55.5% 63.1% 69.5% 65.7% 71.1% 60.5% 69.4% 74.3%
Comorbidities from Charlson Comorbidity Index (CCI) analysis
Mean of weighted CCI scores 0.10* 0.90 1.63 0.96 1.07 0.05* 0.58 1.14 0.30
Patients (%) with a weighted CCI score
≥2 NA 23% 43% 15% 25% NA 13% 30% 7%
Patients (%) with a primary or secondary diagnosis of
Acute myocardial infarction (AMI) 1.1%* 1.4% 9% 5% 6% 0.1%* 0.8% 4% 2%
Congestive Heart Failure 4%* 15% 32% 13% 23% 3.2%* 10% 21% 8%
Patient Management
Inpatient admission type (%) 100% 90.6% 100% 99.3% 97.2% 100% 45.6% 100% 56.3%
Mean (SD) inpatient length of stay (days) 9.2 (8.8) 6.9 (7.5) 10.1 (8.2) 6.7 (5.9) 6.7 (9.0) 4.0 (4.3) 2.3 (4.6) 3.9 (4.9) 3.3 (3.7)
Median inpatient length of stay (days) 6 5 8 5 3 3 1 2 2
In hospital mortality (%) 1.5% 1.7% 1.6% 1.0% 1.8% 0.3% 0.3% 0.4% 0.1%
4b - ICDs ICD first implants ICD replacements
Total number of HD records 1.540 6.010 30.484 15.819 174 435 2.444 8.504 5.264 23 Crude implant or replacement rate/100.000 inhabitants by age class
0-44 years – female 1.4 1.2 2.0 1.3 0.7 0.3 0.6 0.7 0.4 0.4
45-64 years – female 8.3 5.7 15.5 10.1 6.6 2.4 2.4 4.3 3.0 0
65-74 years – female 26.6 13.7 47.4 32.4 18.1 6.0 4.9 11.6 9.6 0
Over 74 years – female 18.3 10.9 38.8 29.4 7.6 7.0 5.4 12.9 12.2 0.0
0-44 years – male 3.4 2.2 4.7 3.8 2.1 0.5 0.8 1.1 0.8 0.3
45-64 years – male 41.1 22.3 68.0 46.6 15.5 9.8 8.3 17.0 12.6 2.4
65-74 years – male 122.1 76.1 206.4 155.7 54.8 32.7 29.9 54.4 48.3 6.1
75 years and above – male 87.6 82.3 215.2 161.0 42.3 40.7 36.8 73.2 70.6 13.4
Patient Characteristics
Male (%) 79.0% 80.6% 79.1% 79.5% 71.8% 79.3% 79.3% 78.6% 79.2% 91.3%
Ageclass 0-44 years (%) 7.3% 8.8% 4.6% 5.2% 9.2% 4.1% 9.0% 4.4% 3.7% 17.4%
Ageclass 45-64 years (%) 36.7% 30.8% 32.2% 29.1% 37.4% 32.2% 29.0% 29.4% 24.0% 30.4%
Ageclass 65-74 years (%) 37.1% 32.9% 37.3% 34.9% 36.2% 34.0% 31.3% 34.7% 32.3% 21.7%
Ageclass 75 years and above (%) 19.0% 27.5% 25.9% 30.8% 17.2% 29.7% 30.7% 31.4% 40.1% 30.4%
Comorbidities from Charlson Comorbidity Index (CCI) analysis:
Mean of weighted CCI scores 0.58* 1.32 2.50 1.27 1.52 0.36* 0.98 1.81 0.79 1.91
Patients (%) with a weighted CCI score ≥2 NA 35% 69% 29% 41% NA 24% 48% 16% 35%
Patients (%) with a primary or secondary diagnosis of:
Acute myocardial infarction (AMI) 2%* 5% 35% 14% 26% 0.4%* 2% 16% 8% 48%
Congestive Heart Failure 54%* 60% 91% 73% 63% 34%* 40% 64% 45% 43%
Patient Management
Inpatient admission type (%) 100% 92.4% 100% 97.9% 100% 100% 70.2% 100% 73.4% 100%
Mean (SD) inpatient length of stay (days) 10.3 (9.6) 6.7 (8.3) 10.4 (8.6) 8.5 (7.1) 13.1 (11.9) 4.4 (4.5) 3.0 (4.8) 4.4 (4.8) 4.4 (5.1) 9.3 (9.2)
Median inpatient length of stay (days) 7 2 8 6 10 3 1 3 2 7
In hospital mortality (%) 0.6% 0.3% 0.8% 0.5% 1.1% 0.2% 0.3% 0.3% 0.2% 0%
Table 5. Comparison of MedtecHTA (MT) data with European Heart Rhythm Association (EHRA) White Books–by country and year
Austria All UK England Germany Italy Slovenia
Year EHRA MT Diff EHRA MT Diff EHRA MT Diff EHRA MT Diff EHRA MT Diff
Pacemakers (cardiac resynchronization therapy (CRT) subtype not included)
2008 7.570 7.690 2% 40.570 37.734 -8% 98.300 89.194 -10% 61.300 62.220 2% 1.100 586 -88% 2009 7.930 7.500 -6% 39.850 42.701 7% 102.177 92.215 -11% 63.000 62.215 -1% 935 652 -43% 2010 7.712 7.589 -2% 37.194 45.636 18% 103.423 94.659 -9% 63.400 62.202 -2% 1.153 602 -92% 2011 7.810 7.870 1% 38.239 50.540 24% 106.953 96.013 -11% 63.100 62.141 -2% 1.295 604 -114% 2012 7.870 7.950 1% 38.770 NA 106.567 96.403 -11% 61.300 62.098 1% 1.333 667 -100% ICDs (CRT subtype not included)
2008 1.100 1.104 0% 7.403 5.086 -46% 21.600 20.948 -3% 18.000 16.554 -8% 96 103 7% 2009 1.290 1.157 -11% 5.077 5.376 6% 23.574 22.940 -3% 10.500 15.100 30% 111 145 23% 2010 1.268 1.176 -8% 5.175 5.344 3% 25.071 24.422 -3% 11.100 13.933 20% 101 176 43% 2011 1.805 1.195 -51% 5.404 5.467 1% 26.579 25.219 -5% 11.970 14.106 15% 144 174 17%
2012 1.195 1.296 8% 5.762 NA 26.536 25.956 -2% 12.000 13.943 14% 122 196 38%
CRT Pacemakers
2008 235 242 3% 1.900 1.567 -21% 1.040 1.123 7% 1.500 NA 37 NA
2009 277 306 9% 2.540 1.759 -44% 1.200 1.360 12% 1.500 1.027 -46% 36 NA
2010 307 386 20% 2.366 2.139 -11% 1.666 1.790 7% 1.800 1.712 -5% 36 NA
2011 300 334 10% 2.864 2.370 -21% 1.792 1.942 8% 2.000 1.916 -4% 35 NA
2012 258 377 32% 4.015 0 2.224 2.253 1% 1.900 2.002 5% 63 NA
CRT ICDs
2008 560 482 -16% 2.830 9 8.400 7.925 -6% 9.500 NA 19 NA
2009 672 643 -5% 3.305 841 -293% 10.516 10.146 -4% 8.700 3.017 -188% 31 NA 2010 696 680 -2% 4.155 1.882 -121% 12.868 12.271 -5% 10.000 6.069 -65% 57 NA 2011 658 780 16% 3.731 2.361 -58% 14.633 13.769 -6% 10.380 6.977 -49% 55 NA
2012 621 801 22% 2.950 NA 15.725 14.893 -6% 10.000 7.262 -38% 76 NA
Fig. 1 Crude first implant rates and crude replacement rates per 100,000 inhabitants - Pacemakers and ICDs
Figure 2. Crude versus adjusted (for age*) implant rates per 100,000 inhabitants for PMs and ICD, by year and country.
*Adjusted for age using the European standard population, version 2013, from Eurostat.
Figure 3. Adjusted (for age*) first implant rates per 100,000 inhabitants for PMs and ICDs for the year 2011.