TURBULENT JETS ISSUING FROM RECTANGULAR NOZZLE
WITH A RECTANGULAR NOTCH AT THE MIDSPAN
Shigetaka FUJITA x1, Takashi HARIMAx1and Hideo OSAKAx2
1. I
NTRODUCTIONAbstract: The turbulent flowfield of turbulent jet issuing from rectangular nozzle (Aspect Ratio=12.5) with a rectangular notch at the midspan, has been investigated experimentally. Four aspect ratios of rectangular notch (NAR: Notch Aspect Ratio) used in this experiment were 2.5, 7.5, 12.5 and 165. The Reynolds number based on the nozzle width d and the exit mean velocity Ue, was kept constant 30000 (NAR=2.5 and 7.5), 15000 (NAR=12.5) and 13000 (NAR=165), respectively. Longitudinal mean velocity and turbulent intensities were measured using an X-array Hot-Wire Probe (5 µm in diameter, 1 mm effective length) operated by the linearized constant temperature anemometers (DANTEC), and the spanwise and the lateral mean velocities were measured using a yaw meter. The signals from the anemometers were passed through the low-pass filters and sampled using A.D. converter. The processing of the signals was made by a personal computer. Acquisition time of the signals was usually 80 seconds. From this experiment, it was revealed that the attachment of a rectangular notch to the rectangular jet suppressed the development of the turbulent velocity scales near the jet centre in the upstream region for the cases of NAR
t
7.5.The rectangular jet is very useful in many cases of which the improvement of the entrainment rate or the promotion of mixing is necessary. However, in case of the employment of the rectangular jet to engineering fields, the elongation of the high velocity jet flow region is expected in many cases, for example, the uniformity plating technique and the air curtain (air shield and ventilating).
To these technical assignments, the extension of the potential core length and the suppression of the turbulent intensities seem to be effective methods. So far, Trentacoste and Sforza [1], and Sforza and Stasi [2] classified the flowfield of the rectangular jet into 3 regions (Potential Core region (PC region), Characteristic Decay region (CD region) and Axisymmetric Decay region (AD region)).
x1Shigetaka FUJITA, Department of Mechanical and Electrical Engineering, Tokuyama College of
Technology, Gakuendai, Shunan, Yamaguchi, 745-8585, Japan, [email protected]
x1Takashi HARIMA, Department of Mechanical and Electrical Engineering, Tokuyama College of
Technology, Gakuendai, Shunan, Yamaguchi, 745-8585, Japan, [email protected]
x2Hideo OSAKA, Department of Mechanical System, Hiroshima Institute of Technology, Miyake,
Saekiku, Hiroshima, Hiroshima, 731-5193, Japan, [email protected]
Furthermore, Marsters and Fotheringham [3] clarified that the streamwise mean velocity profiles showed the saddle-back shape which was caused by the inward secondary flow, and the reduction rate of the streamwise velocity along the jet centreline showed the typical feature in the cases of
AR
(Aspect Ratio)t
6.44. From the results mentioned above, it seems that the variation ofAR
changes the PC length and eases the velocity reduction of CD region for the rectangular jet. Furthermore, Fujita et al. reported that the PC length of both the finite cruciform jet [4] and the two-dimensional jet with a rectangular notch [5], showed larger values forNAR
(Notch Aspect Ratio)=12.5 because of the inward secondary flow on the two representative jet axes. Quinn and Marsters [6] also reported the promotion of PC length for the finite cruciform jet with finite axis length (AR
=11.97).From these results, it was clarified that the attachment of a rectangular notch with
AR
=10~15 perpendicular to the rectangular jet promoted the magnitude of the inward secondary flow toward the jet centre region on the rectangular jet axis [7]. Furthermore, it was presumed that the attachment of a rectangular notch to the rectangular nozzle suppressed the turbulent intensities, significantly.In this report, the turbulent flowfield of turbulent jet issuing from rectangular nozzle (Aspect Ratio=12.5) with a rectangular notch (
NAR
=2.5, 7.5, 12.5 and 165) at the midspan, has been investigated to clarify an effect of the attachment of a rectangular notch to the rectangular jet, experimentally.Nomenclature
AR
: Aspect ratio of the rectangular nozzle (=h
/d
)d
: Nozzle widthh
: Nozzle length of the rectangular nozzlel
: Nozzle length of the rectangular notchNAR
: Aspect ratio of the rectangular notch (=l
/d
)q
: Turbulent kinetic energy (= (u
2+v
2+w
2)1/2)q
uv : Turbulent kinetic energy (=[(3/2)(u
2+v
2)]1/2)Re
: Reynolds number (=U
ed
/Q
)U
: Longitudinal mean velocityU
e : Longitudinal mean velocity at the nozzle centre of the exit planeU
ox : Longitudinal mean velocity on thex
axisu
: Longitudinal fluctuating velocityV
: Lateral mean velocityv
: Lateral fluctuating velocityW
: Spanwise mean velocityw
: Spanwise fluctuating velocityx
,y
,z
: Cartesian coordinate system with origin at the nozzle centre of the exit plane (x
/d
=0)Greek Symbol
Q
: Kinetic viscosity of airSubscripts
e
: Value at the nozzle centre of the exit planeox
: Value on thex
axis2. E
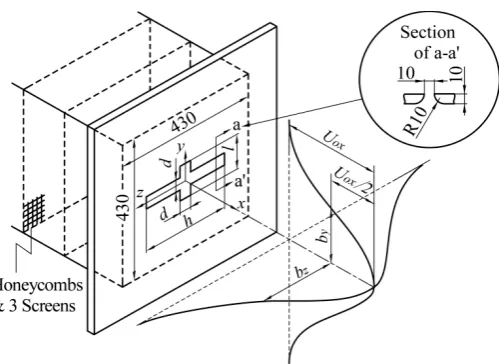
XPERIMENTAL SETUP AND PROCEDUREThe configuration of the flowfield and the coordinate system are presented in Figure 1. The rectangular nozzle with a rectangular notch is installed at the end of settling chamber. The jet flow facility consists of a turbo fan, a settling chamber fitted with honeycomb and mesh wire screens, and the rectangular nozzle with a rectangular notch. The main axis length
h
and the widthd
of the rectangular nozzle are 125 mm and 10 mm (AR
=12.5), respectively. On the other hand, the main axis lengthl
of the rectangular notch is 25 mm (NAR
=2.5), 75 mm (NAR
=7.5) and 125 mm (NAR
=12.5) respectively, and each notch widthd
is 10 mm. ForNAR
=165, the rectangular notch lengthl
is 990 mm and the widthd
is 6 mm. Here, the value ofNAR
for the rectangular nozzle is defined as zero, expediently.Longitudinal mean velocity and turbulent intensities were measured using an X-array Hot-Wire Probe (5 μm in diameter, 1 mm effective length) operated by the linearized constant temperature anemometers (DANTEC), and the spanwise and the lateral mean velocities were measured using a yaw meter. The signals from the anemometers were passed through the low-pass filters and sampled using A.D. converter. The processing of the signals was made by a personal computer. Acquisition time of the signals was usually 80 seconds. The exit plane Reynolds number based on the nozzle width
d
and the exit mean velocityU
e, was kept constant 30000 (NAR
=2.5 and 7.5), 15000 (NAR
=12.5) and13000 (
NAR
=165) throughout the present experiment, respectively. And the value of the nozzle exit turbulent intensityu
rms/U
e for all theNAR
cases were about 0.5×10⁻². In thisexperiment, the uncertainty associated with the longitudinal mean velocity
U
is estimated at ±3% ofU
e, which includes calibration error of the linearized constanttemperature anemometers, and that of the spanwise velocity
V
and the lateral mean velocityW
at ±6% ofU
e, which includes calibration error of the yaw meter. Furthermore,the uncertainty is ±5.6 % of
U
e for the turbulent intensities.3. E
XPERIMENTAL RESULTS AND DISCUSSION3.1 C
ONFIGURATION OF THE MEAN VELOCITY FIELDAt first, the mean velocity field will be shown for understanding the flowfield of the present jet. Figure 2 shows the streamwise variations of the longitudinal mean velocity
Figure 2: Longitudinal mean velocity profiles along the jet centreline
U
ox/U
e along the jet centreline forNAR
=0, 2.5, 7.5, 12.5 and 165, respectively. Here,the result of the rectangular jet (
AR
=10) by Sfeir [7] is plotted in the same figure for comparison. Each PC length forNARt
2.5 is larger than that forNAR
=0 (the rectangular jet) [8]. This reason is presumed as that there are the advection transport terms (Ww
(U
2/2)/wz
andVw
(U
2/2)/wy
) of the mean flow kinetic energy by the inward secondary flow velocity on both thez
(the rectangular jet) andy
(the rectangular notch) axes as shown later in Figure 4, respectively. Furthermore, the length of the PC region (U
ox/U
et
1.0) varies with the value ofNAR
and takes the largest value forNAR
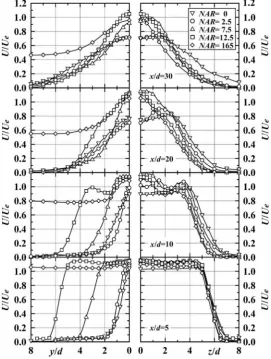
=12.5.Figure 3 shows the streamwise variation of the longitudinal mean velocity profiles for all the
NAR
cases on both they
andz
axes, respectively. At first, the profiles on thez
axis at the section ofx
/d
=5 for all theNAR
cases show potential core region (U
ox/U
et
1.0) andsaddle-back shape in the region of
z
/d
<5.0. At the section ofx
/d
=10, the case ofNAR
=0 has only one peak at the jet end, on the other hand, all the cases forNARt
2.5 have two peaks. The peak positions for all theNAR
cases atx
/d
=10 move toward the more inside region compared with those of the section ofx
/d
=5, because the mean flow kinetic energy were transported toward the jet centre region by the inward advection transport term (Ww
(U
2/2)/wz
) as mentioned above. In the region ofx
/dt
20, the peak positions forNAR
=0 and 2.5 still move toward the jet centre region by the inward secondary flowsame as the result of
x
/d
=10.On the other hand, the profiles on the
y
axis at the sections ofx
/d
=5 forNAR
=2.5, 7.5 and 12.5 show each potential core region and saddle-back shape. However, the profile forNAR
=165 takes almost the constant value on they
axis. At the section ofx
/d
=10, only two cases forNAR
=12.5 and 165 show the saddle-back shape. Furthermore, in the region ofx
/dt
20, all profiles show monotonous decrease from the value of the jet centre (y
/d
=0) to the notch jet end.Figure 4 presents the profiles of the secondary flow velocity on both the
y
andz
axes for all theNAR
cases, respectively. At first, all the profiles on thez
axis at the section ofx
/d
=5 have the inward secondary flow velocity. The magnitude of the inward secondary flow velocity forNARt
2.5 is larger than that forNAR
=0. At the sections ofx
/d
=10 and 20, there are also inward secondary flows for all theNAR
cases. All positions of the maximum value of the inward secondary flow velocity move toward the jet centre region. Finally at the section ofx
/d
=30, the inward secondary flow velocities are found only forNAR
=0 and 2.5 near the jet centre region.Next, the profiles on the
y
axis at the section ofx
/d
=5 have the inward secondary flows for the cases ofNARt
7.5. The magnitude of the inward secondary flow velocity forNAR
=7.5 and 12.5 takes large values. At the section ofx
/d
=10, the maximum positions of the inward secondary flow velocity profiles forNAR
=7.5 and 12.5 move toward the jet centre region. And at the section ofx
/d
=20, there are still inward secondary flows forNAR
=7.5 and 12.5. Finally, at the section ofx
/d
=30, there is no inward secondary flow in all theNAR
cases.From the results mentioned above, the magnitude and the direction of the inward secondary flow on both the
y
andz
axes depend on the value ofNAR
. Using these features, it is presumed that the variation ofNAR
can manipulate both the PC length and the development of the turbulent flowfield of the rectangular jet.3.2 T
URBULENT VELOCITY SCALESIn this chapter, the characteristics of the turbulent flowfield will be examined. Figure 5 shows the streamwise variation of turbulent velocity scales
q
ox/U
e along the jet centrelinefor all the
NAR
cases. In the present experiment, the results in the upstream region will be focused, because it is presumed that the attachment of rectangular notch, which produces an inward secondary flow on the rectangular notch axis, makes a significantcontribution to the development of the present turbulent flowfield in the upstream region. At first, the magnitude of the value for
NAR
=0 is largest in the region untilx
/d
=9. Then, in the region of 1dx
/dd
20, the values of the velocity scales are suppressed forNARt
7.5 compared with those forNAR
=0 and 2.5.From these results, it is found that the attachment of rectangular notch perpendicular to the rectangular nozzle suppresses the development of turbulent velocity scales near the jet centre in the upstream region.
3.3 C
ONTOUR PLOTS OF TURBULENT KINETIC ENERGYContour plots of the turbulent kinetic energy in the upstream region for all the
NAR
cases, will be examined to clarify the difference in the development of turbulent kinetic energy due to the effect of the inward secondary flow velocity on both they
andz
axes. Figures 6 to 10 show the contour plots of turbulent kinetic energyq
uv/U
e at two sections with aconstant
x
/d
for all theNAR
cases, respectively.The contour plot of
NAR
=0 atx
/d
=5 in Figure 6 shows the rectangular shape parallel to the rectangular nozzle axis and has the maximum value atz
/d#r
5.5 on thez
axis. And the contour plot at the section ofx
/d
=30 shows almost a circular shape and takes the maximum values atz
/d#
2.5 on thez
axis. Comparing to that ofx
/d
=5, it is presumed that the maximum positions on thez
axis are moved fromz
/d#
±5.5 to ±2.5 by the inward advection transport term (Ww
(q
2/2)/wz
) of the turbulent kinetic energy due to the(a)
x
/d
=5 (b)x
/d
=30Figure 6: Contour plots of turbulent kinetic energy
q
uv/U
e forNAR
=0(a)
x
/d
=2 (b)x
/d
=10inward secondary flow velocity as shown in Fig.4.
Contour plot of
NAR
=2.5 atx
/d
=2 in Figure 7 shows almost a rectangular shape with small prominent regions on they
axis and has the maximum value atz
/d#
±5.5 on thez
axis. At the section ofx
/d
=10, the contour plot takes the maximum value atz
/d#
±4.5 on thez
axis because of the inward secondary flow velocity.Next, the contour plot of
NAR
=7.5 atx
/d
=5 in Figure 8 shows a cruciform shape and(a)
x
/d
=5 (b)x
/d
=20Figure 8: Contour plots of turbulent kinetic energy
q
uv/U
e forNAR
=7.5(a)
x
/d
=5 (b)x
/d
=30Figure 9: Contour plots of turbulent kinetic energy
q
uv/U
eforNAR
=12.5(a)
x
/d
=5 (b)x
/d
=30takes the maximum values at
y
/d#
±2.5 on they
axis andz
/d#
±5.5 on thez
axis, respectively. The contour plot near the jet centre region shows a diamond-shaped region taking the local minimum value. This reason is explained as that the development of turbulent kinetic energy is suppressed by the inward advection transport which transports the mean flow kinetic energy with both high longitudinal mean velocity (see Fig.3) and low turbulent revel (see Figure 11 shown later) in the potential core region (see Fig.3) to the jet centre region on both they
(y
/dd
2.0) andz
(z
/d#
4.5) axes at the section ofx
/d
=5. Therefore, the value of the jet centre region forNAR
=7.5 is kept smaller than that forNAR
=0. At the section ofx
/d
=20, the width of the contour plot on thez
axis is narrow compared with that ofx
/d
=5 because of the same reason as the result on thez
axis forNAR
=2.5.The contour plot of
NAR
=12.5 atx
/d
=5 in Figure 9 shows a finite cruciform shape and takes the maximum value aty
/d#
±5.5 and the minimum value aty
/d#
±4.0 on they
axis. It also takes the maximum and minimum values at the same locations on thez
axis. The contour plot near the jet centre region shows a diamond-shaped region taking the local minimum value. At the section ofx
/d
=30, the contour plot shows the cruciform shape with long axes in they
=±z
directions, and takes the maximum value aty
/d#
±3.0 andz
/d#
±3.0 on they
andz
axes, respectively. The movement of these maximum positions fromz
/d#
±5.5 to ±3.0 is caused by the advection transport of the turbulent kinetic energy by the inward secondary flow on both they
andz
axes.The contour plot shape along with the
z
axis forNAR
=165 atx
/d
=5 in Figure 10 shows the same tendency with anotherNAR
cases. On the other hand, the contour plot along with they
axis shows a shape of quasi two-dimensional jet. The contour plot in the jet centre region shows the diamond-shaped because of the same reason for the cases ofNAR
=7.5 and 12.5. At the section ofx
/d
=30, the width of the contour plot on thez
axis is narrower than that ofx
/d
=5. And the positions of the maximum value atz
/d#
±5.5 ofx
/d
=5 move toz
/d#
±2.0.From the results mentioned above, it is clarified that the development of the turbulent kinetic energy in the jet centre region for the cases of
NARt
7.5 is suppressed compared with the cases forNAR
=0 and 2.5 due to the inward secondary flow velocity on both they
andz
axes in the upstream region.3.4 T
URBULENT KINETIC ENERGY PROFILESFigure 11 shows the streamwise variation of turbulent kinetic energy profiles on both the
y
andz
axes for all theNAR
cases, respectively.cases move toward the more inside regions compared with those at the section of
x
/d
=5 because of the inward secondary flow. Furthermore, at the sections ofx
/d
=20 and 30, the positions of the maximum value for all theNAR
cases moved toward the jet centre region until the section ofx
/d
=30.Next, the results on the
y
axis will be examined. Each profile atx
/d
=5 except forNAR
=165, takes the local minimum value near the jet centre and the maximum value near the region where the gradient of each longitudinal mean velocity profile shows the maximum value (see Fig.3). The profile ofNAR
=165 has almost the constant value in the region ofy
/dt
2.0. At the section ofx
/d
=10, the magnitude of the value near the jet centre forNARt
7.5 is suppressed compared with those forNAR
=0 and 2.5, this is the same reason as the result on thez
axis. Therefore, the magnitude of the value near the jet centre forNARt
7.5 is kept small. Furthermore, the positions of the maximum value move toward the jet centre region except forNAR
=0. At the section ofx
/d
=20, the positions of the maximum value forNAR
=7.5 and 12.5 still move toward the jet centre region. The magnitude of the value at the jet centre (y
/d
=0) forNARt
7.5 approaches to that forNAR
=0. At the section ofx
/d
=30, the positions of the maximum value move toward the outside except forNAR
=7.5.4. C
ONCLUSIONSFrom the present experiment in the turbulent flowfield of the turbulent air jet issuing from rectangular nozzle (
AR
=12.5) with a rectangular notch (NAR
=2.5, 7.5, 12.5 and 165) at the midspan, the main conclusions of the present study can be summarized as follows:(1) The magnitude and the direction of the inward secondary flow velocity on both the rectangular nozzle and rectangular notch depend on the value of
NAR
. The variation ofNAR
manipulates both the PC length and the development of the turbulent flowfield of the rectangular jet.(2) The attachment of rectangular notch perpendicular to the rectangular nozzle suppresses the development of turbulent velocity scales near the jet centre in the upstream region, and the magnitude of the suppression effect depends on the value of
NAR
.(3) The development of the turbulent kinetic energy in the jet centre region for the cases of
NARt
7.5 is suppressed compared with the cases ofNAR
=0 and 2.5 due to the inward secondary flow velocity on both they
andz
axes in the upstream region.5. R
EFERENCES[1] Trentacoste, N. and Sforza, P.M., Further experimental results for three-dimensional free jets. AIAA Journal, 5(5), 1967, pp.885-891.
[2] Sforza, P.M. and Stasi, W., Heated three-dimensional turbulent jets. Transaction of the ASME, Journal of Heat Transfer, 101(2), 1979, pp.353-358.
[3] Marsters, G.F. and Fotheringham, J., The influence of aspect ratio on incompressible, turbulent flows from rectangular slots. Aeronautical Quarterly, 31(4), 1980, pp.285-305.
[4] Fujita, S. and Osaka, H., Three-dimensional jets issuing from cruciform nozzles having four aspect ratios (1st Report. Mean Flow Properties). Transactions of the Japan Society of Mechanical Engineers, Series B, 53(488), 1987, pp.1142-1149. [5] Fujita, S. et al., Turbulent jet issuing from a quasi two-dimensional nozzle with
a rectangular notch at the midspan (streamwise variation of mean velocity field). Transactions of the Japan Society of Mechanical Engineers, Series B, 65(631), 1999, pp.905-911.
[6] Quinn, W.R and Marsters, G.F., Upstream influence on turbulent jet flows from cruciform nozzles. Aeronautical Journal, 89(882), 1985, pp.55-58.
[7] Sfeir, A.A., Investigation of three-dimensional turbulent rectangular jets. AIAA Journal, 17(10), 1979, pp.1055-1060.