Article
1
Surface Melt on Ross Ice Shelf Interior during a
2
Downsloping Wind Event
3
Christopher Karmosky 1
4
1 Department of Earth and Atmospheric Sciences, State University of New York College at Oneonta;
5
6
7
8
Abstract: On January 8, 2005, a surface melt event began on the interior portion of Ross Ice Shelf.
9
While many surface melt events on Ross Ice Shelf are caused by the advection of warm air onto the
10
shelf from the Ross Sea, surface winds during this event were directed offshore and the spatial
11
pattern of surface melt was inconsistent with the Southern Ocean serving as a heat source. Rather,
12
due to the interior location of the surface melt coupled with prevailing wind direction and surface
13
temperature data it is thought that adiabatic warming of Föhn winds is the driving cause of this
14
melt event. Passive Microwave (SSM/I) imagery was used to determine surface melt occurrence and
15
the event’s extent. Spatial patterns of surface melt were then compared to NCEP/NCAR reanalysis
16
output for several synoptic weather variables including surface temperatures, sea level pressure
17
and surface vector winds. Synoptic-scale weather conditions were consistent with those that would
18
produce downsloping wind (föhn) conditions in the interior of the Ross Ice Shelf where the
19
anomalous surface melt was located.
20
Keywords: Antarctica; Surface Melt; Ross Ice Shelf; Föhn Winds; Remote Sensing
21
22
1. Introduction
23
Ross Ice Shelf, Antarctica, is the world’s largest and southernmost ice shelf. While typical
24
conditions there preclude the appearance of surface melting, the lack of persistent summer melt
25
provides an opportunity to isolate specific meteorological conditions that can temporarily increase
26
temperatures above 0oC. The majority of surface melting on Ross Ice Shelf is caused by an inflow of
27
relatively warm maritime air over coastal regions [1], previously modified by an upward sensible
28
and latent heat flux over offshore polynyas [2]. However, there have been several instances of surface
29
melting that are better explained by the presence of downsloping “Föhn-like” winds from either the
30
Transantarctic Mountains or down the ice streams on the eastern edge of the shelf (e.g. Bindschadler
31
and MacAyeal, formerly Ice Streams D and E respectively).
32
Warm downsloping winds are well-documented in non-polar regions, particularly in the Alps
33
as föhn winds [3], the Rocky Mountains as Chinook winds [4] and the Sierra Nevada as Santa Ana
34
winds [5]. There is a growing body of literature showing their effect on both Greenland [6] and on
35
the Antarctic Peninsula. Recent works [7-10] have outlined the presence of downsloping winds
36
leading to surface melt on more temperate Antarctic ice shelves such as Larsen, which appear to be
37
driven by prevailing westerly flow over the Antarctic Peninsula [11].
38
Föhn winds have been documented in the dry valleys region of the northern Ross Ice Shelf
39
[12,13]. While downsloping winds on Ross Ice Shelf are typically cold, density-driven katabatic
40
winds, the presence of a surface low in the Ross Sea can draw air down the steep topography around
41
Ross Ice Shelf causing the air to warm adiabatically as it descends [14]. Such winds are associated
42
with extreme warm events in the dry valleys. However, most downsloping winds on the Ross Ice
43
Shelf are not associated with temperatures warm enough to facilitate surface melting. Both katabatic
44
processes as well as the presence of the offshore Ross Sea cyclone [15,16] contribute to the
45
development of downsloping winds. There is both an adiabatic and a turbulent mixing component
46
to warm downsloping winds over Ross Ice Shelf when the source region for the air is over West
47
Antarctica [17]. Turbulent mixing can disrupt the semi-permanent inversion over Ross Ice Shelf and
48
warm the surface by mixing down warm air from aloft. Downsloping winds originating over East
49
Antarctica were found to be predominately katabatic in nature and therefore had a cooling effect on
50
the temperatures across Ross Ice Shelf.
51
Surface melting is known to have contributed to the breakup of the Larsen B ice shelf in 2002
52
[18], though the larger and colder Ross Ice Shelf is not currently at risk of collapse. Surface melting
53
arises from the full meteorological conditions at a time, but different processes may be dominant in
54
any single melt event. In particular, melting may occur on clear-sky days in response to intense
55
insolation, by advection of heat from warmer regions such as ice-free parts of the Southern Ocean, by
56
föhn-type winds, or perhaps in other ways [19, 1, 9, 10, 20, 21]. During times of marginal temperatures
57
that may be slightly below freezing, the downsloping component of winds may serve to enhance the
58
potential for surface melting. However with increases in temperature projected over the course of the
59
next century [22,23,24], this may increase the frequency and intensity of föhn melt events, which may
60
have further implications toward ice shelf stability.
61
This work examines a case study of large-extent surface melt identified by passive microwave
62
satellite imagery, located near the southern grounding line of Ross Ice Shelf, which is thought to be
63
caused primarily by downsloping föhn-like winds. The event occurred in two phases, the first of
64
which lasted from Jan 8-9, 2005 and the second from Jan 12-17, 2005.
65
2. Data and Methods
66
2.1 Passive Microwave Satellite Imagery and Melt Detection Algorithm
67
Surface melt occurrence was determined using SSM/I passive microwave (19GHz
horizontally-68
polarized and 37GHz vertically-polarized) brightness temperature [25] and the Cross-Polarized
69
Gradient Ratio (XPGR) [26, 27]. This method is able to determine the presence of melt at the satellite
70
overpass time at a resolution of 25km. Melt detection is dependent on changes in the dielectric
71
constant of the ice shelf surface as ice, firn, and snow begin to melt. The output is then reclassified as
72
binary values indicating areas with melt if the XPGR exceeds an empirically-established threshold,
73
or no melt if the XPGR does not exceed the threshold. After reclassification, the melt values were
74
masked, to include only areas on the Antarctic Ice Sheet and seven major Antarctic Ice Shelves. A
75
surface melt dataset extending from 1987-88 through 2009-10 was created [1] but a subset of the data
76
from January 8-26 2005 was useful to delineate this particular surface melt event.
77
2.2 Comparison to Synoptic-Scate Weather Conditions
78
Synoptic weather conditions were then compared to NCEP/NCAR reanalysis-derived [28]
79
weather variables including sea-level pressure, vector winds, surface air temperature, and potential
80
temperature. Reanalysis output is available at a 2.5o x 2.5o spatial resolution then is interpolated by
81
the NOAA/ESRL Physical Science Division and made available on their website. While data are
82
available as frequently as 6-hourly, daily data are used in this study to coincide with the daily
83
temporal resolution of the SSM/I surface melt data. Temperatures aloft were also examined at 925mb
84
and 850mb to examine the role that turbulent mixing of inversions may play in raising temperatures
85
above the freezing point.
86
3. Results
87
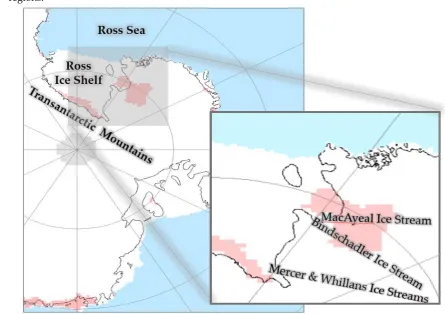
On January 8, 2005, a surface melt event occurred on the interior portion of the Ross Ice Shelf,
88
near latitude 85oS (Figure 1). While this was not a long-duration event, it is notable for its location—
89
nearly 900 km from the Ross Sea. Surface Melt was confined to the southernmost extent of Ross Ice
90
Shelf (82-85oS) below the Transantarctic Mountains and at the base of the Bindschadler and MacAyeal
91
Ice Streams. Typically-warmer regions along the northern coast are melt-free. Other surface melt
92
events in the satellite record typically centred over strictly the Bindschadler and MacAyeal ice
streams, the McMurdo Island region on the northwest corner of Ross Ice Shelf, or both of these
94
regions.
95
96
Figure 1. XPGR Surface Melt Occurrence (Pink) for West Antarctica, January 8, 2005.
97
98
99
The January 2005 surface melt event began on Jan 8 and continued for two days before the
100
majority of the ice re-froze on Jan 10. A second phase of the event, smaller in extent but longer in
101
duration, began on Jan 12 and extended to Jan 17 with the last residual melted region freezing again
102
on Jan 26. There was a decreased melt extent along the Bindschadler and MacAyeal ice streams
103
during the second phase of the event as well, with these ice streams becoming melt-free by Jan 14.
104
Throughout both phases of the event, surface melting was confined to areas where surface air flow
105
converged and descended, and melt was absent from areas along the coastline. Notably, this melt
106
event was one of only two similar events identified across the entire 1987-2010 record.
107
NCEP/NCAR Reanalysis (Figure 2) shows the presence of a surface low pressure system (2a)
108
and accompanying clockwise circulation (2b) in the Ross Sea on January 8 2005. Higher sea-level
109
adjusted pressures were seen on the Antarctic Plateau, particularly west of Ross Ice Shelf. This
110
synoptic pattern is consistent with offshore winds. Synoptic wind patterns are further modified by
111
the rugged topography of the Transantarctic Mountains. During downslope wind events, air
112
trajectories follow the natural drainage patterns in the topography with air flow mirroring the ice
113
flow beneath. Therefore, downsloping winds will be strongest where ice flow is naturally faster, in
114
the various ice streams along the grounding line. It is along these ice streams, particularly Ice Streams
115
A (Mercer) and B (Whillans) and Ice streams D (Bindschadler) and E (MacAyeal) that surface melt
116
was observed during the January 2005 melt event.
117
118
120
(a)
121
122
123
(b)
124
125
126
Figure 2. NCEP/NCAR Reanalysis [28] (a) Sea Level Pressure (mb) and (b) Surface Vector Winds
127
(m/s) for West Antarctica, January 8, 2005. [Modified from NOAA ESRL PSD 2019]
128
129
Surface Temperatures (Figure 3a) are near 273K across much of Ross Ice Shelf on January 8, 2005.
130
Above-freezing temperatures were somewhat north of the area experiencing the surface melt, which
was immediately adjacent to the base of the Transantarctic Mountains. Temperatures over the Ross
132
Sea were below freezing--approximately 270K. Again, this is consistent with the absence of surface
133
melt along the northern, coastal edge of Ross Ice Shelf. The 264K isotherm was along the
134
Transantarctic Mountains, which also corresponded to the (expected) lack of surface melting at the
135
higher elevations nearly 2km above Ross Ice Shelf.
136
137
(a) (b)
138
Figure 3. NCEP/NCAR Reanalysis [28] (a) Surface Air Temperature and (b) Surface Potential
139
Temperature for Antarctica, January 8, 2005 [Modified from NOAA ESRL PSD 2019]. White
140
highlighted regions indicate areas of enhanced T and Θ gradients.
141
142
Potential Temperature is a theoretical maximum temperature that air would have if it were
143
forced to descend dry adiabatically to 1000mb without mixing with its environment. Potential
144
temperatures (Figure 3b) across the Antarctic Plateau indicate the possibility of a föhn melt
145
mechanism inducing surface melting because all potential temperature values are well above 273K.
146
Potential temperatures near 280-281K are located upwind of the Mercer and Whillans Ice Streams.
147
This area is the local minimum for potential temperature, however this is the region directly upwind
148
of the southernmost surface melt conditions. Potential temperatures of up to 291K extend across
149
Marie Byrd Land upwind from the Bindschadler and MacAyeal Ice Streams, and just over 282K
150
across the Transantarctic Mountains. While potential temperatures above the Transantarctic
151
Mountains are higher than temperatures across Ross Ice Shelf, turbulent mixing would likely
152
decrease the temperatures of descending air parcels.
153
154
4. Discussion
155
Most surface melting on Ross Ice Shelf is caused by relatively warm, moist winds advecting
156
sensible and latent heat from the Ross Sea onto the distal edge of the shelf [1]. However, during the
157
January 8, 2005 event, winds were directed offshore, with air sourced over the Transantarctic
158
Mountains coming across Ross Ice Shelf from the south. Surface melt was found predominately along
159
the grounding line at the base of the Transantarctic Mountains. Melt was largely absent from coastal
160
regions that by virtue of their lower latitude and proximity to the Ross Sea are typically warmer than
161
the interior of the ice shelf. Such a spatial pattern of surface melt is inconsistent with advection of
162
warm air from the Ross Sea or melt generated from abnormally high solar radiation. If these processes
163
were occurring, surface melt would be located not in the southern region of the ice shelf, but near the
164
northern coastal region. In this melt event, melt was likely generated via processes similar to föhn
165
winds, where adiabatic warming of downsloping air caused surface temperatures to rise above 0oC
166
and an area of melt to form at the base of the mountains.
167
A Föhn-like surface melt mechanism (Figure 4) is occurring due to the increase in temperature
168
at the dry adiabatic lapse rate as winds descend the Transantarctic Mountains and/or the
169
Bindschadler/MacAyeal Ice Streams to the surface of the ice shelf. During the January 2005 melt
event, the initial air temperature at the top of the Transantarctic Mountains is 264K. As the Ross Sea
171
Low forces the winds to descend to the Ross Ice Shelf proper, air is warmed dry adiabatically at 9.8
172
K/km over 2 km. This results in the transformation of sub-freezing air (264K) to above freezing air
173
(274K). Some turbulent mixing takes place during the descent, allowing cooler air to infiltrate
174
descending parcels, making parcel temperatures slightly cooler than would be expected by an
175
adiabatic descent of 2km.
176
177
Figure 4. Föhn melt mechanism at base of Transantarctic Mountains. Note: The actual mountain
178
base temperature will vary, and likely be slightly lower than this depiction, due to entrainment, or,
179
mixing with the surrounding environment during descent.
180
181
Turbulent mixing alone is insufficient to explain the rise of temperatures above the freezing
182
point at the base of the Transantarctic Mountains. Air temperatures at 925mb and 850mb were below
183
freezing (272K at 925mb and 268K at 850mb) over the interior of Ross Ice Shelf on Jan 8, 2005. There
184
was no inversion present in this region and temperatures were warmest at the surface. Near the
185
Bindschadler and MacAyeal Ice streams, temperatures at 925mb and 850mb were slightly warmer at
186
275K at 925mb and 272K at 850mb. Turbulent mixing likely had a stronger influence on surface melt
187
in this location, closer to the coast.
188
These downsloping winds may at first appear similar to katabatic winds, which most commonly
189
form during the polar night when radiational cooling is strongest. Katabatic winds undergo the same
190
adiabatic temperature increases as föhn winds. However, because the density-driven katabatic winds
191
derive from particularly cold air they will have a net cooling effect on the lower part of the ice shelf.
192
The downsloping winds seen on January 8, 2005 are not the result of katabatic processes, but were
193
generated by a synoptic scale pressure gradient. As a result, the air originating atop the Antarctic
194
Plateau was not particularly cold to begin with and the air warmed as it was forced downward.
195
It is possible that the melt along the Bindschadler and MacAyeal Ice Streams was enhanced by
196
warm air advection off the Amundsen Sea though the near-shore wind direction makes this
197
possibility unlikely. Winds along the coastal region of Marie Byrd Land were light (<4 m/s) and show
198
as moving offshore. However the coarse spatial resolution of the NCEP/NCAR Reanalysis output
199
and the overall weak wind speeds make the true wind direction in this region somewhat ambiguous.
200
In cases where a synoptic low resides at the boundary between the Ross Sea and the Amundsen Sea,
it is possible for onshore flow to overspread across Marie Byrd Land and the föhn effect could amplify
202
surface melt conditions.
203
One significant limitation of this study is the coarse spatial resolution (2.5o x 2.5o) of the
204
NCEP/NCAR Reanalysis. This makes the exact position and extent of above-freezing temperatures
205
somewhat unclear. However, the presence of above-freezing surface air temperatures, and the
206
detection of surface melting through SSM/I imagery lends credence to the föhn melt mechanism
207
hypothesis despite the poorly-resolved surface temperatures along the Ross Ice Shelf.
208
Future work should examine the relationship between föhn wind and calving events along the
209
front of Ross Ice Shelf. While the Ross Ice Shelf is thought to be too thick and stable to undergo the
210
same rapid collapse that affected the Larsen B Ice Shelf, iceberg calving is a natural process that has
211
the potential to accelerate under warmer conditions. The presence of extreme warming events due to
212
föhn winds in the Dry Valleys and the ability of föhn winds to increase temperatures above freezing
213
even as far south as the grounding line at the base of the Whillans and Mercer Ice Streams (85oS)
214
could have important implications for calving rates. Warming temperatures from anthropogenic
215
climate change could further increase melting during otherwise marginal temperatures exacerbated
216
by the föhn effect.
217
5. Conclusions
218
Surface melt anomalies occurring inland on the Ross Ice Shelf during the January 2005 event, while
219
superficially appearing to have characteristics of katabatic flow, are at least partially due to the effects
220
of Föhn-like winds. Winds at the top of the ice sheet are not sufficiently dense to drive katabatic flow,
221
nor is synoptic circulation bringing maritime air ashore, which is the typical cause for melt in this
222
region. Rather, the Ross Sea Low is forcing air down from the Antarctic Ice Sheet onto the Ross Ice
223
Shelf. The areas of surface melt are confined to regions that are directly below the ice streams, which,
224
owing to their lower elevations, would serve as preferred pathways for downsloping winds. While
225
during katabatic flow infrared satellite imagery identifies “warm” regions within the air stream as a
226
result of inversion mixing [29], surface melt occurrence is determined using microwave imagery
227
instead. During the January 2005 event, conditions are not consistent with a polar night inversion.
228
The variables most closely associated with the Föhn-like surface melt mechanism are 1) the location
229
of synoptic scale pressure systems, 2) surface air temperatures at the top and bottom of the
230
Transantarctic Mountains, and 3) the wind direction over the Ross Ice Shelf. Similar downsloping
231
winds are documented in other areas of Antarctica, specifically along the Larsen C ice sheet [8]. While
232
the Föhn-like surface melt mechanism is an uncommon occurrence, it should be noted that synoptic
233
scale events might have a bearing on future ice melt events, especially as temperatures increase
234
because of global climate change.
235
Funding: This research received no external funding
236
Acknowledgments: The author would like to thank Melissa Godek for assistance in the preparation of figures
237
and Nick Morgan for suggestions and edits on the text. Furthermore, I thank the reviewers and the editorial
238
board for their time, consideration, and suggestions. Finally, I would like to thank the State University of New
239
York College at Oneonta, College of Sciences and Department of Earth and Atmospheric Sciences for their
240
support.
241
Conflicts of Interest: The authors declare no conflict of interest
242
References
243
1. Karmosky, C.C. Synoptic and Mesoscale Climate Forcing on Antarctic Ice Shelf Surface Melt Dynamics.
244
PhD Dissertation, Pennsylvania State University, University Park, Pennsylvania, USA, 2013.
245
2. Kottmeier, C. and Engelbart, D. Generation and Atmospheric Heat Exchange of Coastal Polynyas in the
246
Weddell Sea. Boundary-Layer Meteor. 1992, 60, 207-234; DOI: https://doi.org/10.1007/BF00119376.
247
3. Brinkman, W.A. What is a Foehn?. Weather 1971, 26, 230-240; DOI: 10.1002/j.1477-8696.1971.tb04200.x.
248
4. Math, F.A. Battle of the Chinook Wind at Havre, Mont. Mon. Weather Rev. 1934, 62, 54-57.
5. Raphael, M.N. The Santa Ana winds of California. Earth Interact. 2003, 7, Paper 008; DOI:
10.1175/1087-250
3562(2003)007<0001:TSAWOC>2.0.CO;2.
251
6. Mernild, S.H.; Liston, G.E.; Kane, D.L.; Knudsen, N.T.; and Hasholt, B. Snow, runoff and mass balance
252
modeling for the entire Mittivakkat Glacier (1998-2006), Ammassalik Island, SE Greenland, Geografisk
253
Tidsskrift-Danish Journal of Geography, 2008, 108, 121-136; DOI: 10.1080/00167223.2008.10649578.
254
7. Trusel, L.D.; Frey, K.E.; Das, S.B.; Kuipers Munneke, P.; and van den Broeke, M. R. Satellite-based estimates
255
of Antarctic surface meltwater fluxes. Geophys. Res. Lett., 2013, 40, 6148-6153; DOI: 10.1002/2013GL058138.
256
8. Grosvenor, D. P.; King, J. C.; Choularton, T. W.; and Lachlan-Cope, T. Downslope föhn winds over the
257
Antarctic Peninsula and their effect on the Larsen Ice Shelves, Atmos. Chem. Phys., 2014, 14, 9481-9509; DOI:
258
10.5194/acp-14-9481-2014.
259
9. Luckman, A.; Elvidge, A.; Jansen, D.; Kulessa, B.; Kuipers Munneke, P.; King, J.; and Barrand, N.E. Surface
260
melt and ponding on Larsen C Ice Shelf and the impact of föhn winds, Antarct. Sci., 2014, 26, 625-635; DOI:
261
10.1017/S0954102014000339.
262
10. Cape, M. R.; Vernet, M.; Skvarca, P.; Marinsek, S.; Scambos, T.; and Domack, E. Foehn winds link climate‐
263
driven warming to ice shelf evolution in Antarctica, J. Geophys. Res. Atmos., 2015, 120, 11,037– 11,057; DOI:
264
10.1002/2015JD023465.
265
11. Wisenekker, J.M.; Kuipers Munneke, P.; van den Broeke, M.R.; and Smeets, C.J.P.P. A multidecadal analysis
266
of föhn winds over Larsen C Ice shelf from a combination of observations and modelling. Atmosphere, 2018,
267
9, 172; DOI: 10.3390/atmos9050172, 2018.
268
12. Speirs, J.C.; Steinhoff, D.F.; McGowan, H.A.; Bromwich, D.H.; and Monaghan, A.J. Foehn winds in the
269
McMurdo Dry Valleys, Antarctica: the origin of extreme warming events, J. Clim., 2010, 23, 3577-3598; DOI:
270
10.1175/2010JCLI3382.1.
271
13. Speirs, J.C.; McGowan, H.A.; Steinhoff, D.F.; and Bromwich, D.H. Regional climate variability driven by
272
foehn winds in the McMurdo Dry Valleys, Antarctica. Int. J. Climatol, 2013, 33, 945-958; DOI: 10.1002/joc.348.
273
14. Doran, P.T.; Mckay, C.P.; Fountain, A.G.; Nylen, T.; Mcknight, D.M.; Jaros, C.; and Barrett, J.E. Hydrologic
274
response to extreme warm and cold summers in the McMurdo Dry Valleys, East Antarctica, Antarct. Sci.,
275
2008, 20, 499-509; DOI: 10.1017/S0954102008001272.
276
15. Parish, T.R.; Cassano, J.J.; and Seefeldt, M.W. Characteristics of the Ross Ice Shelf air stream as depicted in
277
Antarctic Mesoscale Prediction System simulations, J. Geophys. Res., 2006, 111, D12109; DOI:
278
10.1029/2005JD006185.
279
16. Seefeldt, M.W. and Cassano, J.J. A description of the Ross Ice Shelf air stream (RAS) through the use of
self-280
organizing maps (SOMs), J. Geophys. Res., 2012, 117, D09112; DOI:10.1029/2011JD016857.
281
17. Coggins, J.H.J.; McDonald, A.J.; and Jolly, B. Synoptic Climatology of the Ross Ice Shelf and Ross Sea Region
282
of Antarctica: k-means Clustering and Validation. Int. J. Climatol., 2014, 34, 2330-2348; DOI: 10.1002/joc.3842.
283
18. van den Broeke, M. Strong Surface Melting Preceded the Collapse of Antarctic Peninsula Ice Shelf. Geophys.
284
Res. Lett., 2005, 32, L12815; DOI: 10.1029/2005GL023247.
285
19. Liu, H.; Wang, L.; and Jezek, K.C. Spatiotemporal Variations of Snowmelt in Antarctica Derived from
286
Satellite Scanning Multichannel Microwave Radiometer and Special Sensor Microwave Imager Data
(1978-287
2004). J. Geophys. Res., 2006, 111, F01003; DOI: 10.1029/2005JF000318.
288
20. Lenaerts, J.T.M.; Lhermitte S.; Drews R.; Ligtenberg, S.R.M.; Berger S.; Helm V.; Smeets, C.J.P.P.; van den
289
Broeke, M.R.; van de Berg, W.J.; van Meijgaard, E.; Eijkelboom, M.; Eisen, O.; and Pattyn, F. Meltwater
290
Produced by Wind-Albedo Interaction Stored in an East Antarctic Ice Shelf. Nat. Clim. Change, 2017, 7,
58-291
62; DOI: 10.1038/nclimate3180.
292
21. Nicolas, J.P.; Vogelmann, A.M.; Scott, R.C.; Wilson, A.B.; Cadeddu, M.P.; Bromwich, D.H.; Verlinde, J.;
293
Lubin, D.; Russell, L.M.; Jenkinson, C.; Powers, H.H.; Ryczek, M.; Stone, G.; and Wille, J.D. January 2016
294
Extensive Summer Melt in West Antarctica Favoured by Strong El-Niño, Nat. Commun., 2017, 8, article
295
15799; DOI: 10.1038/ncomms15799.
296
22. Steig, E.J.; Schneider, D. P.; Rutherford, S.D. ; Mann, M.E.; Comiso, J.C.; and Shindell, D.T. Warming of the
297
Antarctic Ice Sheet Surface since the 1957 International Geophysical Year. Nature, 2009, 457, 459-462; DOI:
298
10.1038/nature07669.
299
23. Bromwich, D. H.; Nicolas, J. P.; Monaghan, A. J.; Lazzara, M. A.; Keller, L. M.; Weidner, G. A. ; and Wilson,
300
A. B. Central West Antarctica Among the most Rapidly Warming Regions on Earth, Nat. Geosci., 2013, 6,
301
139-145; DOI: 10.1038/NGEO1671.
24. Turner, J.; Barrand, N. E.; Bracegirdle, T. J.; Convey, P.; Hodgson, D. A. Antarctic climate change and the
303
environment: an update. Polar Rec., 2013, 50, 237-259; DOI: 10.1017/S0032247413000296.
304
25. Armstrong, R.L. and Brodzik, M.J. An Earth-Gridded SSM/I Data Set for Cryospheric Studies and Global
305
Change Monitoring. Adv. Space Res., 1995, 16, 155-163; DOI: 10.1016/0273-1177(95)00397-W.
306
26. Abdalati, W. and Steffen, K. Passive microwave-derived snow melt regions on the Greenland Ice Sheet.
307
Geophys. Res. Lett., 1995, 22, 787–790; DOI: 10.1029/95GL00433.
308
27. Abdalati, W. and Steffen, K. Snowmelt on the Greenland Ice Sheet as derived from passive microwave
309
satellite data, J. Clim., 1997, 10, 165-175, DOI: 10.1175/1520-0442(1997)010<0165:SOTGIS>2.0.CO;2.
310
28. Kalnay, E.; Kanamitsu, M.; Kistler, R.; Collins, W.; Deaven, D.; Gandin, L.; Iredell, M.; Saha, S.; White, G.;
311
Woollen, J.; Zhu, Y.; Chelliah, M.; Ebisuzaki, W.; Higgins, W.; Janowiak, J.; Mo, K.C.; Ropelewski, C.; Wang,
312
J.; Leetmaa, A.; Reynolds, R.; Jenne, R.; and Joseph, D. The NCEP/NCAR 40-Year Reanalysis Project. Bull.
313
Am. Meteorol. Soc., 1996, 77, 437-471; DOI: 10.1175/1520-0477(1996)077<0437:TNYRP>2.0.CO;2.
314
29. Bromwich, D.H.; Carrasco, J.F.; and Stearns, C.R. Satellite observations of katabatic-wind propagation for
315
great distances across the Ross Ice Shelf, Mon. Weather Rev., 1992, 120, 1940-1949; DOI:
10.1175/1520-316
0493(1992)120<1940:SOOKWP>2.0.CO;2.
![Figure 2. NCEP/NCAR Reanalysis [28] (a) Sea Level Pressure (mb) and (b) Surface Vector Winds (m/s) for West Antarctica, January 8, 2005](https://thumb-us.123doks.com/thumbv2/123dok_us/7914685.1314164/4.595.101.494.90.695/figure-reanalysis-level-pressure-surface-vector-antarctica-january.webp)
![Figure 3. NCEP/NCAR Reanalysis [28] (a) Surface Air Temperature and (b) Surface Potential Temperature for Antarctica, January 8, 2005 [Modified from NOAA ESRL PSD 2019]](https://thumb-us.123doks.com/thumbv2/123dok_us/7914685.1314164/5.595.82.499.153.336/reanalysis-surface-temperature-potential-temperature-antarctica-january-modified.webp)

