An Analysis of Improving Energy use with Data Envelopment Analysis
in Apple Orchard
Raheleh Fadavi., Naeimeh Samavatean., Alireza Keyhani and Seyyed Saied Mohtasebi (Department of Agricultural Machinery Engineering, Faculty of Agricultural Engineering and Technology, University of Tehran, Karaj, Iran)
277
Author(s) Raheleh Fadavi
Department of Agricultural Machinery Engineering, Faculty of Agricultural Engineering and Technology, University of Tehran, Karaj, Iran
Email:[email protected]
Naiemeh Samavatean., Alireza Keyhani and Seyyed Saied Mohtasebi
Department of Agricultural Machinery Engineering, Faculty of Agricultural Engineering and Technology, University of Tehran, Karaj, Iran
An Analysis of Improving Energy use with Data Envelopment
Analysis in Apple Orchard
Abstract
In this paper, Data Envelopment Analysis (DEA) technique was applied for apple (Red and Golden delicious varieties) producers in West Azarbaijan province, Iran (2008-2009). Results showed that the highest share of energy consumption belongs to packaging (57%) and irrigation (16%). Highest share of expenses were found to be 34% and 30% for labor and packaging, respectively. The total energy input for apple production, energy productivity, net energy and outputinput energy value were estimated as 101,505 MJ.ha1, 0.23 kg.MJ1, -56.320 MJ.ha-1 and 0.44, respectively. Also, The study has helped to segregate efficient farmers from inefficient ones, identify wasteful uses of energy by inefficient producers and suggest reasonable savings in energy uses from effective sources while it describes the process of benchmarking energy inputs and apple yield. Technical, pure technical and scale efficiencies were calculated (by using CCR and BCC models) for all orchards. Inquiries on 80 orchards were conducted in a face-to-face interviewing. The VRS analysis showed that only 41 out of 80 DMUs were efficient. The TE of the inefficient DMUs was calculated as 87.8%. This implies that 12.2% of overall resources could be saved by raising the performance of these DMUs to the highest level. Results showed that the maximum share to the total energy saving is from diesel (39.7%) followed by packaging and about (28.1%). The results of analysis showed that DEA is an effective tool to analyze and benchmark productive efficiency of farms.
Keyword: Apple, DEA, Energy ratio, benchmarking, Technical efficiency
Introduction
In 2005, apple orchards‟ area was summed up to 201,000 ha with total production of 2.66 Mt in Iran (Anonymous 2006a). The West Azarbaijan province is the leading apple (Delicious and Golden varieties with long legged, 277 trees per hectare) producer in Iran, with approximately 27.1% share of total apple orchard area and 29.8% share of total apple production in Iran (Anonymous 2006a). Also, about half of this province‟s apple production and apple orchard area is allocated to Oromieh Township (Anonymous 2005).
Energy use in agriculture has been developed in response to increasing populations, limited supply of arable land and a desire for higher standards of living. More intensive energy use of fossil fuel, chemical fertilizers, pesticides, machinery and electricity has brought some important human health and environmental problems. Thus, efficient use of energy inputs is of prompt importance in terms of sustainable farming.
An input–output energy analysis provides farm planners and policy makers an opportunity to evaluate economic intersection of energy use (Ozkan et al. 2004a), In addition, Technical efficiency (weighted output energy to weighted input energy ratio) is another way to explain the efficiency
of farmers (Chauhan et al. 2006).
There are several parametric and non-parametric techniques to measure productive efficiency, Data envelopment analysis (DEA) is a non-parametric method for evaluating the relative efficiency of decision-making units (DMUs) on the basis of multiple inputs and outputs, therefore data envelopment analysis (DEA) models such as CCR and BBC models (Banker, Charnes, & Cooper, 1984; Charnes, Cooper, & Rhodes, 1978 require input and output data.
DEA is an established and well-known methodology for non-parametrically estimating the relative efficiency of a number of homogeneous units, commonly designated as Decision Making Units (DMU) (Cooper et al., 2004b; Zhu, 2002). This method has been conducted for benchmarking energy sectors in many countries, Non-parametric estimation means that it does not rely on assumptions that the data come from any specific production function.
278 an optimization model (usually a Linear Program, LP)
producing an efficiency score and a target operating point. the efficiency score is a measure of the relative improvements in inputs and outputs between the DMU and its assigned target.
Considerable research studies have been conducted on energy use and DEA in agriculture, however, relatively little attention has been paid to apple production. Nassiri and Singh (2009), analyzed energy use efficiency, In this paper (DEA) technique was subjected to data of paddy producers in Punjab state (India), Technical, pure technical and scale efficiencies were calculated (by using CCR and BCC models) for farmers category-wise and zone-wise. Reig-Martinez and Picazo-Tadeo (2004), identified the efficient production units in citrus farming in Spain that determine the technological or best practice frontier, and they compared their characteristics with those of the average farm. Chauhan et al. (2006) studied improving energy productivity in paddy production through benchmarking. In their study, a DEA approach has been used to determine the efficiencies of farmers with regard to energy use in rice production activities in the alluvial zone in the state of West Bengal in India. Omid et al. (2011) studied benchmarking productive efficiency of selected greenhouses in Iran using DEA based on eight inputs: human labor, diesel, machinery, fertilizers, chemicals, water for irrigation, seeds and electricity, and output yield values of cucumber, The results of analysis show that DEA is an effective tool for analysis and benchmarking productive efficiency of agricultural units.
This paper presents an application of data envelopment analysis (DEA) to discriminate efficient farmers from inefficient ones, pinpoint best operating practices of energy usage, recognize wasteful uses of energy inputs by inefficient farmers and suggest necessary quantities of different inputs to be used by each inefficient farmer from every energy source, in other words, The aim of this paper is to benchmark productive efficiency of apple orchards in Oromieh Township in Iran to illustrate the need to include more than one resource involved in the productive process.
Materials and Methods
The West Azarbaijan province is located in the northwestern of Iran, The average annual rainfall is 300-400 mm (Anonymous 2007a) and altitude above sea level is 1,313 m with average high and low annual temperatures of 19.4°C and 6.7°C, respectively (Aryanpour et al. 2007).
Data were collected from 80 apple orchard in the Oromieh Township by using a face to face questionnaire in 2008. Sample orchards were randomly selected from the villages in the study area by using a stratified random sampling technique. Based on the energy equivalents of the inputs and outputs (Table 1), the metabolisable energy was calculated. Energy ratio (energy use efficiency) and energy productivity were calculated as Eq. (1) and Eq. (2) (Mandal et al. 2002):
Output - input ratio (ER) = Energy output (MJ.ha-1) / Energy input (MJ.ha-1) (1)
Energy productivity (EP) = Total output (kg.ha-1) / Energy input (MJ.ha-1) (2)
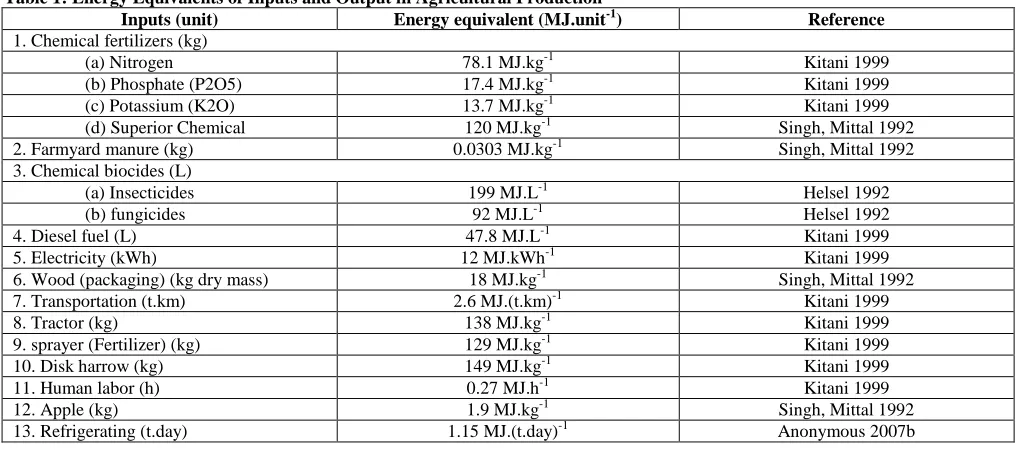
Table 1: Energy Equivalents of Inputs and Output in Agricultural Production
Inputs (unit) Energy equivalent (MJ.unit-1) Reference
1. Chemical fertilizers (kg)
(a) Nitrogen 78.1 MJ.kg-1 Kitani 1999
(b) Phosphate (P2O5) 17.4 MJ.kg-1 Kitani 1999
(c) Potassium (K2O) 13.7 MJ.kg-1 Kitani 1999
(d) Superior Chemical 120 MJ.kg-1 Singh, Mittal 1992
2. Farmyard manure (kg) 0.0303 MJ.kg-1 Singh, Mittal 1992
3. Chemical biocides (L)
(a) Insecticides 199 MJ.L-1 Helsel 1992
(b) fungicides 92 MJ.L-1 Helsel 1992
4. Diesel fuel (L) 47.8 MJ.L-1 Kitani 1999
5. Electricity (kWh) 12 MJ.kWh-1 Kitani 1999
6. Wood (packaging) (kg dry mass) 18 MJ.kg-1 Singh, Mittal 1992
7. Transportation (t.km) 2.6 MJ.(t.km)-1 Kitani 1999
8. Tractor (kg) 138 MJ.kg-1 Kitani 1999
9. sprayer (Fertilizer) (kg) 129 MJ.kg-1 Kitani 1999
10. Disk harrow (kg) 149 MJ.kg-1 Kitani 1999
11. Human labor (h) 0.27 MJ.h-1 Kitani 1999
12. Apple (kg) 1.9 MJ.kg-1 Singh, Mittal 1992
279 DEA is a non-parametric technique that computes efficiency
scores in a described data set, therefore, DEA does not require any assumption about the functional form. The first time, Farrell conducted non-parametric method in 1957, then Charnes et al. (1978) introduced DEA techniques in a paper that used mathematical programming to pursue Farrell ُs approach to technical efficiency measurement (see Farrell, 1957). Their approach involved an important improvement: instead of a single-output and single-input measure, they developed a method which appraising the relative efficiency of homogeneous units by considering multiple inputs and outputs production systems to be benchmarked, by constructing a piece-wise linear surface over the data points. This goal was achieved by computing a maximal performance measure for each production unit (DMU) relative to all other units (DMU) in the sample with the sole requirement that each farmer lies on or below an external frontier.
DEA determines efficiency in three different forms by using energy inputs (MJ/ha) and yield (kg/ha) as an output: technical efficiency, pure technical efficiency and scale efficiency. Technical efficiency is principally a measure by which DMUs are evaluated for their performance relative to other DMUs. Its value is, however, influenced by scale efficiency, which quantifies the effect of the presence of variable returns to scale in the DMUs. Pure technical efficiency is, thus, technical efficiency that has the effect of scale efficiency removed. The relationship among these forms of efficiency is given as Eq. (3)
Technical Efficiency= (Pure Technical Efficiency) × (Scale Efficiency) (3)
It may be noted here that the technical efficiency combines the effects of both pure technical efficiency and scale efficiency. Determining these efficiencies of DMUs facilitates planners pinpointing the sources of inefficiencies. The technical efficiency can be explained as Eq. (4) [Cooper et al 2004a]:
Efficiency = Weighted sum of outputs/ Weighted sum of inputs. (4)
Or mathematically as Eq. (5)
TEj (θ) =
mj m 2j 2 1j 1 nj n 2j 2 1j 1 x v + . … + x v + x v y u + . … + y u + y u =
ms s sj
rj n r r x v y u 1
1 (5)
where TEj or θ is the technical efficiency of the DMU under consideration; n the total number of outputs; m the total number of inputs; „x‟ and „y‟ are input and output; ur the coefficient of the nth output (r = 1,. . . ,n); vs the coefficient of the mth input (s = 1,. . . ,m), „and „j‟ represents jth of DMUs (j = 1,2,. . .,k). The value of technical efficiency varies between zero and one. To solve
Eq. (5), following Linear Program (LP) was developed by Charnes et al. (1978) which was called CCR model, CCR is The first DEA model, the CCR DEA model becomes non-linear as apart from the weights, CCR optimizes model and exhibits under constant returns to scale (CRS) condition, This condition usually does not exist in most real life problems. CCR model is structured as follows Eq. (6):
Maxu,v : θ = u1y1j + u2y2j +……….+ uryrj(6) Subjected to v1x1j + v2x2j +……….+vsxsj = 1 (7) u1y1j + u2y2j +…….+uryrj≤ v1x1j + v2x2j +…….+ vsxsj(8) u1, u2,…,ur≥ 0 (9)
v1 , v2,….., vs ≥ 0 and (i and j = 1, 2, 3,…..,k)
i represents ith DMU, In this study inputs were pesticides, chemical fertilizers, manure, packaging, machinery, transportation, irrigation, refrigerating, labor and diesel, and output was yield (main and secondary (decayed apples) yields). The value of inputs and output weights would be calculated during the solving of LP, so that, the value of technical efficiency approaches to the maximum value.
In 1984, Banker, Charnes and Cooper introduced a model in DEA, which was called BCC model to draw out the technical efficiency of DMUs. This model would permit the existence of variant returns to scale (VRS) and the CCR model becomes the BCC model. With DEA, we can identify which units present CRS or VRS. the VRS is more flexible and envelops the data in a tighter way than the CRS, the score or pure TE (θVRS) is equal to or greater than the CRS or overall TE score (θCRS).
With respect to technical efficiency (in CCR model), technical efficiency of BCC model, which is called Pure Technical Efficiency, Pure technical efficiency is, thus, technical efficiency that has the effect of scale efficiency removed and could separate both technical and scale efficiencies. It can be expressed by Dual Linear Program (DLP) Eq. (10):
Maximize z = uyi - ui (10) Subjected to vxi = 1 (11) _ vX + uY _ uoe ≤ 0 (12)
v ≥0 , u ≥0 and u0 free in sign (13)
where „z‟ and „u0‟ are scalar and free in sign. „u‟ and „v‟ are output and inputs weight matrixes, and „Y‟ and „X‟ are corresponding output and input matrixes, respectively. The letters Xi and Yi represent the inputs and output of ith DMU.
280 TECRS/TEVRS. Although critical, the degree of scale
inefficiency is not very useful from a managerial point of view, unless one can determine whether a DMU is operating in a region where DRS (decreasing returns to scale) or IRS (increasing returns to scale) returns to scale exist. A shortcoming of the SE (TECRS/TEVRS) score is that it does not indicate if a DMU is operating under IRS or DRS. This is resolvable by simply imposing a non-increasing return of scale (NIRS) condition in the DEA model (Coelli, 1996; Scheel, 2000). If the two TE scores (TEVRS and TENIRS) are equal then DRS apply; else IRS prevail. The data analysis was carried out using Excel 2007 spreadsheet, SPSS 16.0 software and DEA- Frontier professional Release 4.0. The Frontier software was used to calculate Technical efficiency and pure technical efficiency with radial distances to the efficient frontier and to rank DMUs using the benchmark method, also determine the amount of energy loss and energy saving of inefficient DMUs.
Results and Discussion
The average size in the surveyed orchards has been found to be 1.2 ha with a range from 0.1 up to 5 ha. Machine power was used for only sprayer (in all orchards), fertilizing and plotting (in few orchards) due to the fact that most apple orchards are designed in a conventional way in which machineries traffic is really limited. The source of labor in the surveyed orchards is from either family members or mainly from hired (seasonal) labors and most of the machineries are mainly provided by rent. Total physical energy input consists of diesel, fertilizer, chemical biocides, human power, machinery, irrigation, packaging, refrigerating and transportation. Apples are packaged with wood because owners of apple orchards are believed that wooden boxes that store more power box than plastics or other types of packing boxes. Irrigation methods were conventional or semi-mechanized (mostly with electric pump and conventional), an apple orchard is irrigated 8 to
10 times a year. The most frequently used fertilizer is farmyard manure and even in some orchards chemical fertilizers is not used because of soil structure and soil nutrients preservation. The diesel energy was mainly utilized for operating tractors; (mostly Messy Ferguson (MF) & Goldoni in the surveyed apple orchards).
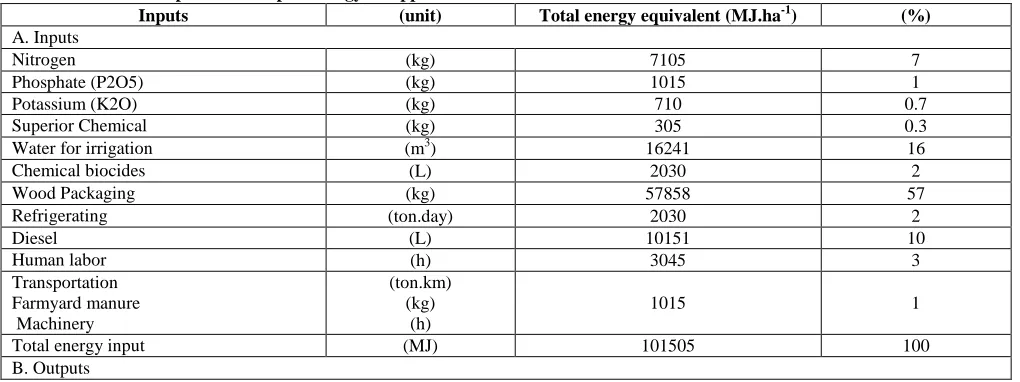
Analysis of input–output energy use in apple production The energy consumption and its sources for apple production are presented in Table 2. As can be seen from Table 2, the total energy used in various farm inputs is 101505 MJ.ha-1. The last column in Table 2 gives the percentage share of each input from the total energy inputs. Of all the inputs, wood packaging has the largest share (57%), Packaging energy is followed by the irrigation energy (16%), based on duration of irrigation (5-24h for one ha); Energy for diesel is ranked third (10%). diesel energy was accounted for 10% of total energy inputs. The total energy equivalent of chemical fertilizers consumption placed fourth among the energy inputs and constituted (9%) of the total energy input, and nitrogen (7%) was in the first place followed by phosphate (1%), potassium (0.7%) and superior chemical (0.3%).The contribution of transportation, farmyard manure and machinery energies remained at low level of 1% (in total) as indirect energy inputs. Hasanzadeh & Rahbar (2005) reported that the most energy consuming input for apple production in West Azarbaijan province was that for irrigation, nitrogen chemical fertilizing and chemical biocides, respectively. According to Kizilaslan (2009), percentage shares for fertilizers (42%), electricity (22%) and fuel (21%) showed highest from total energy used in cherry production in Turkey. Strapatsa et al. (2006), calculated that the most energy inputs for orchard apple production in Greece were fuel (33%), machinery (25%) and fertilizers (15%), mainly N (where orchards were irrigated 1-2 times a year), respectively, in all studies sited, post-harvest operation were not included.
Table2: Amounts of Inputs and Output Energy in Apple Production
Inputs (unit) Total energy equivalent (MJ.ha-1) (%)
A. Inputs
Nitrogen (kg) 7105 7
Phosphate (P2O5) (kg) 1015 1
Potassium (K2O) (kg) 710 0.7
Superior Chemical (kg) 305 0.3
Water for irrigation (m3) 16241 16
Chemical biocides (L) 2030 2
Wood Packaging (kg) 57858 57
Refrigerating (ton.day) 2030 2
Diesel (L) 10151 10
Human labor (h) 3045 3
Transportation Farmyard manure Machinery
(ton.km) (kg)
(h)
1015 1
Total energy input (MJ) 101505 100
281
Yield (main) (kg) 19447
Yield (secondary) (kg) 4335
Yield (main & secondary) (kg) 23782
Output Energy (main) (MJ) 36949
Total energy output (main & secondary) (MJ) 45185
Output–input ratio is one of the essential indicators that provide an understanding of the efficiency of orchard holdings. The energy use efficiency, energy productivity and net energy of apple production in the Oromieh Township are tabulated in Table 3. Energy use efficiency (energy ratio) was calculated as 0.36 and varied from 0.23 to 0.52 in the sampled orchard holdings, showing the inefficient use of energy in the orchard apple production. It is noteworthy that the ratio can be increased by increasing the crop yield (energy equivalent of apple is low relatively) and/or by decreasing energy inputs consumption (input management). Similar results have been reported for different orchard plants such as 0.96 for cherry (Kizilaslan, 2009) and 0.97 for apple (Hasanzadeh & Rahbar, 2005) (postharvest operation were not included), some higher energy ratios have been reported such as 1.00 for apple (Strapatsa et al., 2006) and 3.37 for apricot (Gezer et al. 2003) in the literature. The results indicate that energy productivity and net energy were 0.19 kg.MJ1- and -64556 MJ.ha1-, respectively. This means that 0.19 units output was obtained per unit energy. Calculation of energy productivity is well documented in the literature for different crops such as soybean (0.18) (De et al., 2001), potato (0.35) (Mohammadi et al. 2008) and cherry (0.51) (Kizilaslan, 2009). The calculated net energy is negative (less than zero) implying that in apple production, energy has been lost.
Table 3: Energy input–output ratio in apple production
Items Unit apple
Energy use efficiency (main) 0.36
Energy productivity (main) (kg.MJ-1) 0.19
Net energy (main) (MJ.ha-1) -64556
Energy use efficiency (main &
secondary) 0.44
Energy productivity (main &
secondary) (kg.MJ
-1
) 0.23
Net energy (main & secondary) (MJ.ha-1) -56320
Direct, indirect, renewable and non-renewable energy forms used in apple orchard production are also investigated and the results are shown in Table 4. It is clear that the share of direct input energy (29%) was much lower compared to that of indirect energy (71%). Also, non-renewable and
renewable energies contributed to 96.7% and 3.3% of the total energy input, respectively (this is a serious threat for environment). The proportion of non-renewable energy use in surveyed orchard holdings is very high. Several researchers found that the ratio of direct energy was higher (lower) than that of indirect energy, and the rate of non-renewable energy was greater than that of non-renewable energy consumption in cropping systems (Esengun et al. 2007; Ozkan et al. 2007; Kizilaslan, 2009). Results revealed that orchard operations is carried out mostly by human energy and its share is insignificant (almost zero) in energy consumption compared to other energy inputs. Human energy is highly consumed in pruning and harvesting operations (pruning operation requires technical labor).
Table 4: Total Energy Input in the Form of Direct, Indirect, Renewable and Non-Renewable for Apple Production (MJ ha -1
)
Form of energy (MJ ha-1) Apple %e
Direct energya (MJ.ha-1) 29437 29
Indirect energyb (MJ.ha-1) 72068 71
Renewable energyc (MJ.ha-1) 3350 3.3 Non-renewable energyd (MJ.ha-1) 98155 96.7 a Includes human labor, diesel, water for irrigation.
b
Includes seeds, fertilizers, manure, chemicals, machinery.
c Includes human labor, seeds, manure, water for irrigation. d Includes diesel, electricity, chemical, fertilizers, machinery. e Indicates percentage of total energy input.
Identifying Efficient and Inefficient Farmers
282
Fig.1: Efficiency score distribution of farmers
Use of DEA Results to Study Inefficiency on Individual Farms
The performance assessment may be carried out by comparing a particular system with key competitors having best performance within the same group or another group performing similar functions. This process is called benchmarking (Jebaraj & Iniyan, 2006).
Efficient DMUs can be selected by inefficient DMUs as best practice of DMUs, making them a composite DMU instead of using a single DMU as a benchmark. A composite DMU is formed by multiplying the intensity vector λ in the inputs and outputs of the respective efficient DMUs. BCC is modeled by setting the convexity constraint (The summation of all intensity vectors in a benchmark DMU must be equal to 1. (Omid et al. 2011)). Table 5 shows the
worst inefficient DMUs (AO51 and AO45) and the best inefficient DMUs (AO24 and AO46). For example, in the case of AO51 the composite DMU that represents the best practice or reference composite benchmark DMU is formed by the combination of AO06, AO10 and AO28. This means AO51 is close to the efficient frontier segment formed by these efficient DMUs, represented in the composite DMU. The selection of these efficient DMUs is made on the basis of their comparable level of inputs and output yield to AO51. In Table 5, the benchmark DMU for AO51 is expressed as 6(0.42) 10(0.37) 28(0.21), where 6, 10 and 28 are the DMU numbers while the values between brackets are the intensity vector λ for the respective DMUs. The higher value of the intensity vector λ for AO09 (0.515) indicates that its level of inputs and output is closer to AO45 compared to the other DMUs.
Table5: Results of Technical Efficiency Analysis
DMU PTE score (%) Benchmarks
DMU51 59.3 6(0.42) 10(0.37) 28(0.21)
DMU45 71.8 9(0.515) 16(0.222) 66(0.007) 72(0.198) 75(0.058)
DMU24 97.5 7(0.131) 9(0.012) 57( 0.44) 75(0.417)
DMU46 98.3 6(0.298) 7(0.095) 9(0.143) 10(0.098) 28(0.366)
Efficiency Estimation
The average TE (resource use) provides information about the potential resource savings that could be achieved while maintaining the same output level. The average values of the pure technical efficiency, scale efficiency and technical efficiency are summarized in Table 6. The average values (for all 80 orchards considered) of pure technical efficiency, technical efficiency and scale efficiency were found to be 0.932, 0.951 and 0.98, respectively. Researchers in previous studies calculated average pure TE calculated for asparagus
0.8 and for tomato 0.89 (Iraizoz et al. 2003), Mean levels of technical efficiency were 77%, 73% and 75%, respectively, for groundnut monocrop, maize monocrop and maize-groundnut farming systems suggesting existence of substantial gains in output and/or decreases in cost with available technology and resources (Binam et al. 2004) and mean pure technical efficiency of commercial pig farming in Greece was 0.83, indicating that there is ample potential for more efficient input utilization in domestic pig farming (Galanopoulos et al. 2006). The average values of pure
1 1 3 5
13
21 2219 41
34
0 5 10 15 20 25 30 35 40 45
Number of DMU
0_
10
11
_2
0
21
_3
0
31
_4
0
41
_5
0
51
_6
0
61
_7
0
71
_8
0
81
_9
0
90
_9
9.
9
Effi
ci
en
t
Efficiency Score
283 technical efficiency, technical efficiency and scale
efficiency for 18 cucumber greenhouses were found to be 0.972, 0.879 and 0.9, respectively (Omid et al., 2011).
Table 6: Technical, Pure Technical and Scale Efficiencies DMU Technical efficiency Scale efficiency
(CRS/VRS)
CRS VRS
Average 0.932 0.951 0.980
SD 0.091 0.077 0.004
The average TE of the inefficient DMUs at the orchard unit was calculated as 0.878. This implies that the same level of output could be produced with 87.8% of the resources if these units were performed on the frontier. Another interpretation of this result is that 12.2% of overall resources could be saved by raising the performance of these DMUs to the highest level. Some CCR-inefficient farmers moved toward the BCC-efficient frontier. The RTS indicated that all efficient units (based on pure technical efficiency) were operating at CRS, whereas 40% inefficient ones were at DRS and 60% inefficient units were at IRS, which indicates that for considerable changes in yield, technological change is required.
Optimization of Energy Use for Inefficient Producers
The pure TE score of a producer being less than one indicates that, at present, farmer is using more energy than
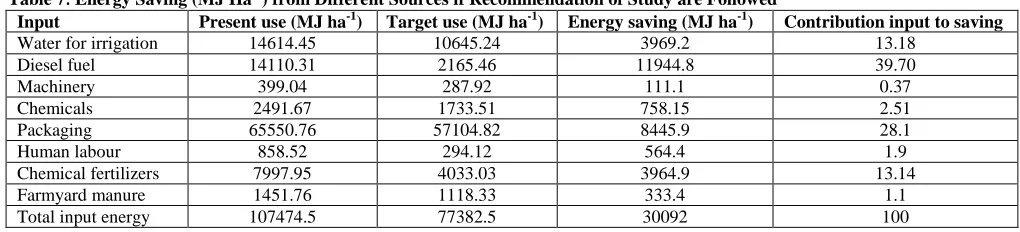
required from different sources. Therefore, it is desirable to suggest input energy levels for the inefficient farmers that provide viable benchmarks for inefficient farmers. The BCC model, when solved, gives the pure TE of a farmer. This can be done by using the value of slacks. According to Coelli (1996) slacks are related to allocative inefficiency. Allocative efficiency indicates a DMU‟s capacity to use inputs in optimal proportions. The slack values indicate that apart from reducing inputs by the amount of (1 – TE), the inefficient DMUs have to reduce their inputs by the amounts indicated by the respective slacks in order to become allocatively efficient.. For each inefficient producer, there have been calculated the actual energy use, the recommended target energy use for each input and the percent saving in total energy use. Table 7 summarizes the energy saving (MJ.ha-1) from different sources. Using the information of Table 5, it is possible to advise a producer to apply the better operating practices followed by his/her peers in order to reduce the input energy levels to the target values indicated in the analysis while achieving the output level presently achieved by him. It gives the average energy spent and targeted (MJ.ha-1), possible energy savings and percentage contribution of each energy source in the total energy savings. The sources of allocative inefficiency at the unit farms are identified as the overuse of diesel fuel, packaging, irrigation and chemical fertilizer.
Table 7: Energy Saving (MJ Ha-1) from Different Sources if Recommendation of Study are Followed
Input Present use (MJ ha-1) Target use (MJ ha-1) Energy saving (MJ ha-1) Contribution input to saving
Water for irrigation 14614.45 10645.24 3969.2 13.18
Diesel fuel 14110.31 2165.46 11944.8 39.70
Machinery 399.04 287.92 111.1 0.37
Chemicals 2491.67 1733.51 758.15 2.51
Packaging 65550.76 57104.82 8445.9 28.1
Human labour 858.52 294.12 564.4 1.9
Chemical fertilizers 7997.95 4033.03 3964.9 13.14
Farmyard manure 1451.76 1118.33 333.4 1.1
Total input energy 107474.5 77382.5 30092 100
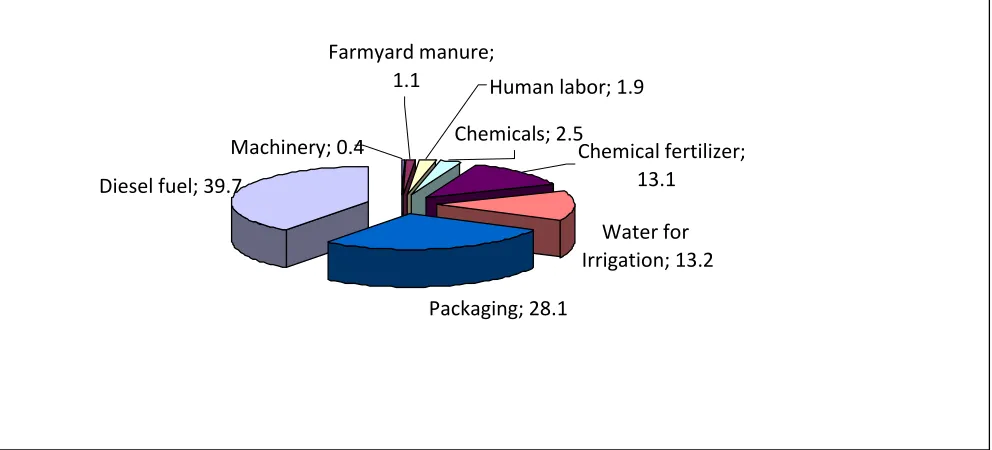
Fig. 2 shows the share of the various sources in the total input energy saving. It is evident that the maximum contribution to the total energy savings is from fuel (39.7) followed by packaging (28.1%), irrigation (13.2%) and chemicals fertilizer (13.1%). A study to determine the efficiencies of farmers regarding energy use in rice production in the state of West Bengal in India showed that
284
Fig. 2: Total Potential Improvement Summary
The study suggests that better use of fuel and packaging, apple producer consume high energy specially fuel and packaging in response to inattention and low energy prices in Iran, However, it should be noted that low productive DMUs may not become efficient by simply reducing the level of inputs. Instead a detailed analysis might be required to determine other underlying causes of inefficiencies, including environmental factors and agricultural practices.
Conclusion
Data used in this study were collected from 80 farmers located in the Oromieh Township of West Azerbaijan province in Iran. Orchard production consumed a total of 101.505 MJ.ha-1 energy and energy output was calculated as 45.185 MJ.ha-1. The results revealed that wooden packaging (57%), irrigation (16%), fuel (10%) and chemical fertilizer (9%) were the major contributors of total energy use in apple orchards. Energy productivity, net energy gain and output–input energy were calculated 0.23kg.MJ1, -56,320MJ.ha-1 and o.44 respectively. It was concluded that the direct and indirect energy inputs were 29% and 71% of the total energy inputs, respectively. Renewable energy sources among the inputs had a share of 3.3% of the total energy input, which was smaller than that of non-renewable energy sources (packaging is considered as non-renewable and indirect energy).
In this paper, also we have explored the usefulness of non-parametric efficiency analysis – Data Envelopment Analysis – for the study for improving the energy use efficiency apple orchards. More specifically, an input-oriented DEA model is used for estimating technical efficiencies in the apple production. Based on the results, the following
conclusions may be drawn: The VRS analysis shows that 41 orchards have efficiency score of unity. CCR model estimation indicates that only 34 producers were efficient. The biggest share of energy saving appertain to Diesel fuel (11944.8 MJ.ha-1), fuel energy is followed by packaging (8445.9 MJ.ha-1). The DEA results are much easier to interpret and to utilize for investigating avenues for improvements in technology and resource use efficiency on orchards. DEA has helped in segregating efficient agricultural units from inefficient agricultural units. It has also helped in finding the wasteful uses of energy by inefficient units and ranking energy sources by using the distribution of virtual inputs. The effects of uncontrollable exogenous variables, such as rainfall, climatic condition and soil fertility can be incorporated in future studies.
References
Anonymous (2005) Agricultural Census of 2003 in Azarbaijane Gharbi Province (The Statistics Center of Iran). The Office of Publication and Information. (in Persian)
Anonymous (2006a) Agriculture Statistics- Production of agriculture and gardening, Vol. I, production year 2004-5. The Office of Statistics and Information Technology of MAJ Pub. (In Persian)
Anonymous (2007a) Yearly Census of Azarbaijane Gharbi Province, The Office of Statistics and Technology Information. Deputy of Planning of The Governor General Office of Azarbaijane Gharbi Province Pub. (in Persian)
Water for
Irrigation; 13.2
Packaging; 28.1
Chemicals; 2.5
Chemical fertilizer;
13.1
Human labor; 1.9
Machinery; 0.4
Diesel fuel; 39.7
285 Anonymous (2007b) The International lists of Iran.
Institute of Standards and Industrial Research of Iran. Available at: www. isiri.org.
Aryanpour J., Sabziparvar P., Seyed mohammad zadeh B., Ghesmati B., Dorostkar J. (2007) Geography of AzarbaijaneGharbi Province. Iran Textbooks Pub.(in Persian)
Banker, R. D., Charnes, A., & Cooper, W. W. (1984) “Some models for estimating technical and scale inefficiency in data envelopment analysis”, Management Science, Vol. 30, pp. 1078–92.
Binam, J. N., Tonye, J., wandji, N., Nyambi, G., Akoa. M. (2004) “Factors affecting the technical efficiency among small holder farmers in the slash and burn agriculture zone of Cameroon”, Food Policy, Vol. 29, pp. 531-45.
Charnes, A., Cooper, W. W., & Rhodes, E. (1978) “Measuring the efficiency of decision making units”, European Journal of Operational Research, Vol. 2, pp. 429–44.
Chauhan N. S, Mohapatra PKJ, Pandey KP. (2006) “Improving energy productivity in paddy production through benchmarking – an application of data envelopment analysis. Energy Convers Manage; Vol.47, pp. 1063–85.
Coelli TJ. (1996) A Guide to DEAP Ver. 2.1, A data envelopment analysis (computer) program. Centre for efficiency and productivity analysis. University of New England; <www.une.edu.au/econometrics/cepa.htm>.
Cooper W. W, Seiford L. M., Tone K. (2004a) Data envelopment analysis: a comprehensive text with models, applications, references and DEA-solver software. Massachusetts, USA: Kluwer Academic Publishers;
Cooper W. W, Seiford L. M, Zhu J. (2004b) Handbook on Data Envelopment Analysis. Springer;
De D., Singh R.S., Chandra H. (2001) “Technological impact on energy consumption in rainfed soybean cultivation in Madhya Pradesh”, Appl Energy, Vol. 70, pp. 193–213.
Esengun K., Erdal G., Gunduz O., Erdal H. (2007) “An economic analysis and energy use in stake-tomato production in Tokat province of Turkey”, Renew Energy, Vol. 32, pp. 1873–81.
Farrell MJ. (1957) “The measurement of productive efficiency”, J Roy Stat Soc. Ser A (Gen) Vol. 120, pp. 253– 81.
Galanopoulos, K., Aggelopoulos, S., Kamenidou, I., Mattas, K. (2006) “Assessing the effects of managerial and production practices on the efficiency of commercial pig farming”, Agricultural Systems, Vol. 88, pp. 125-41.
Gezer I., Acaroglu M., Haciseferogullari H. (2003) “Use of energy and labour in apricot agriculture in Turkey”, Biomass and Bioenergy, Vol. 24, pp. 215-19.
Hasanzadeh A., Rahbar S. (2005) “Study of energy flow in apple orchards Azarbaijane Gharbi Province”, The 4th Iranian Congress on Horticultural Science. Nov. 10-12. Ferdosi Mashad University. Mashad, Iran. (in Persian)
Helsel Z. R. (1992) In: Fluck RC, editor. “Energy and alternatives for fertilizer and pesticide use”, Energy in world agriculture”, Vol. 6, Amsterdam: Elsevier Science Publishing: pp. 177–210.
Iraizoz, M., Rapun, M., Zabaleta. I. (2003) “Assessing the technical efficiency of horticultural production in Navarra, Spain”,Agricultural Systems,Vol.78, pp. 387-403.
Jebaraj, S., Iniyan. S. (2006) “A review of energy models, Renew, Sustain”, Energy Rev. Vol. 10 pp. 281-311.
Kitani O. (1999) CIGR, Handbook of Agricultural Engineering, Vol. 5, Energy and Biomass Engineering. ASAE publication, St Joseph, MI.
Kizilaslan H. (2009) “Input-output energy analysis of cherries production in Tokat province of Turkey”, Applied Energy, Vol. 86, pp. 1354-58.
Mandal K.G., Saha K.P., Gosh P.L., Hati K.M., Bandyopadhyay K. K. (2002) “Bioenergy and economic analyses of soybean-based crop production systems in central India”, Biomass Bioenergy, Vol. 23, pp. 337–45.
Mohammadi A., Tabatabaeefar A., Shahin S., Rafiee S., Keyhani A. (2008) “Energy use and economical analysis of potato production in Iran a case study: Ardabil province”, Energy Convers Manage, Vol. 49, pp. 3566-70.
Nassiri MS, Singh S. (2009) “Study on energy use efficiency for paddy crop using data envelopment analysis (DEA) technique”, Appl Energy, Vol. 86, pp. 1320–25.
286 Ozkan B., Akcaoz H., Fert C. (2004a) “Energy input–
output analysis in Turkish agriculture”, Renew Energy, Vol. 29, pp. 39–51.
Ozkan B., Fert C., Karadeniz C. F. (2007) “Energy and cost analysis for greenhouse and open field grape production”, Energy, Vol. 32, pp. 1500–04.
Reig-Martinez Ernest and Picazo-Tadeo A. J. (2004) “Analysing farming systems with Data Envelopment Analysis: citrus farming in Spain”, Agricultural Systems, Vol. 82, pp. 17–30.
Scheel H. EMS (2000) efficiency measurement system user‟s manual, Ver. 1.3, Operations Research and Wirtschafts informatik, University of Dortmund. Dortmund,
Germany;<http://www.wiso.uni-dortmund.de/lsfg/or/scheel/ems>.
Singh S., Mittal J. P. (1992) “Energy in Production Agriculture”, Mittal Pub. New Delhi.
Strapatsa A. V., Nanos G. D., Tsatsarelis C. A. (2006) “Energy flow for integrated apple production in Greece”, Agriculture, Ecosystem & Environment, Vol.116, pp. 176-80.