Electronic Thesis and Dissertation Repository
8-21-2015 12:00 AM
Developing a contrast agent for the in vivo detection of apoptosis
Developing a contrast agent for the in vivo detection of apoptosis
Mary R. Cobb
The University of Western Ontario
Supervisor
Dr. Stephen Pasternak
The University of Western Ontario Joint Supervisor Dr. Robert Bartha
The University of Western Ontario Graduate Program in Neuroscience
A thesis submitted in partial fulfillment of the requirements for the degree in Master of Science © Mary R. Cobb 2015
Follow this and additional works at: https://ir.lib.uwo.ca/etd Part of the Molecular and Cellular Neuroscience Commons
Recommended Citation Recommended Citation
Cobb, Mary R., "Developing a contrast agent for the in vivo detection of apoptosis" (2015). Electronic Thesis and Dissertation Repository. 3142.
https://ir.lib.uwo.ca/etd/3142
This Dissertation/Thesis is brought to you for free and open access by Scholarship@Western. It has been accepted for inclusion in Electronic Thesis and Dissertation Repository by an authorized administrator of
(Thesis format: Monograph)
by
Mary Rebecca Cobb
Graduate Program in Neuroscience
A thesis submitted in partial fulfillment of the requirements for the degree of
Master of Science
The School of Graduate and Postdoctoral Studies The University of Western Ontario
London, Ontario, Canada
© Mary Rebecca Cobb 2015
ii
Abstract
Currently, there is no way to assess apoptotic cell death in living organisms. We have developed a novel contrast agent targeted toward the detection of caspase-3 activity, the key enzymatic mediator of apoptosis. Our contrast agent consists of a dual magnetic resonance imaging/fluorescent probe coupled to a cell penetrating peptide (CPP) sequence by a peptide backbone containing a caspase-3 cleavage site. The CPP allows the agent to cross cell membranes and the blood brain barrier. In cells undergoing apoptosis, activated caspase-3 will cleave the agent removing the CPP and trapping the imaging probes inside the cell.
The purpose of this study was to test the ability of our contrast agent to label apoptotic cells in cultured neurons and to explore its potential to detect apoptosis in vivo. Using multiple methods, we demonstrated that our contrast agent selectively labeled apoptotic but not healthy or necrotic neurons in culture. Furthermore, using a caspase-3 inhibitor we
demonstrated that uptake and retention of the contrast agent was dependent on apoptosis and caspase-3 activation.
To test our contrast agent in vivo, we examined the 1-methyl-4-phenyl-1,2,3,6-tetrahydropyridine mouse model of Parkinson’s disease to induce apoptosis in the
dopaminergic neurons of the substantia nigra. At the time the mice were sacrificed, there was little evidence of apoptosis in the substantia nigra and we were not able to identify any cells with significant retention of the agent. Nonetheless, this data demonstrates that our agent effectively detects apoptosis in cultured neurons and reinforces its potential to image apoptosis in vivo.
Keywords:
iii
I would like to extend my gratitude to everyone who has helped me throughout the course of my thesis. First and foremost, I would like to thank Dr. Pasternak. Thank you for the
guidance and mentorship you have provided over the past three years. Your enthusiasm for research and perpetual optimism are contagious and I don’t know if I could have made it through to the end of this project without it. I would also like to thank my co-supervisor Dr. Bartha for his support, especially in the area of neuroimaging. I would like to extend a special thanks to Dr. Cregan, for continually offering up his expertise in the area of programmed cell death and for taking the time to help me with the MPTP mouse model. Without your help this project would not have been possible.
Fabiana Caetano, thank you for training me on the microscope and always being there to answer my questions with a smile on your face. Caroline O’Neil, thank you for all of your help with my histology – there is no way I would have found the substantia nigra without your help.
iv
Table of Contents
Abstract ... ii
Acknowledgments ... iii
Table of Contents ... iv
List of Figures ... vii
List of Abbreviations ... viii
Chapter 1 ... 1
1 Introduction ... 1
1.1 Apoptosis ... 1
1.1.1 Overview of Programmed Cell Death ... 1
1.1.2 Caspases: The Mediators of Apoptosis ... 2
1.1.3 Molecular Signaling Pathways of Apoptosis ... 3
1.1.3.1 Extrinsic Pathway ... 3
1.1.3.2 Intrinsic Pathway ... 4
1.1.3.3 Execution Pathway ... 5
1.1.4 Morphological and Biochemical Hallmarks of Apoptosis ... 6
1.1.5 Differentiating Apoptosis from Necrosis ... 7
1.1.6 Apoptosis in Physiology and Pathology ... 8
1.1.6.1 Apoptosis and Neurodegenerative Disease ... 10
1.2 Models of Apoptosis ... 11
1.2.1 Inducing Apoptosis in Cell Culture ... 11
1.2.2 Mouse Models of Apoptosis ... 12
1.2.2.1 Fas-Mediated Hepatic Apoptosis ... 12
1.2.2.2 Treatment of Tumor Models with Anticancer Drugs ... 12
1.2.2.3 Cerebral Stroke Model ... 13
1.2.2.4 1-Methyl-4-Phenyl-1,2,3,6-Tetrahydropyridine Mouse Model of Parkinson's Disease ... 13
1.3 Methods for Detecting Apoptosis in Vitro ... 14
v
1.3.3 Annexin V ... 18
1.3.4 Detection of Apoptotic Mediators ... 19
1.3.5 Cytochrome C and Mitochondrial Detection Methods ... 20
1.4 Methods for Detecting Apoptosis in Vivo ... 22
1.4.1 Molecular Imaging ... 22
1.4.2 Molecular Imaging Modalities ... 22
1.4.2.1 Magnetic Resonance Imaging ... 22
1.4.2.2 Radionuclide Imaging ... 23
1.4.3 Molecular Imaging of Apoptosis ... 24
1.4.3.1 Radiolabeled Annexin V ... 25
1.4.3.2 Labeled Caspase-3 Substrates ... 27
1.5 Rationale and Hypothesis ... 27
Chapter 2 ... 30
2 Methods ... 30
2.1 Contrast Agent Synthesis ... 30
2.2 Fluorescence Microscopy ... 30
2.3 N2A Cell Culture ... 31
2.4 Primary Neuronal Culture ... 31
2.5 Induction of Apoptosis in Primary Cortical Neurons ... 32
2.6 Optimization of Contrast Agent Concentration and Exposure Time ... 32
2.7 Contrast Agent Toxicity ... 32
2.8 Cellular Uptake and Retention of Contrast Agent in Apoptotic Neurons ... 33
2.9 Cellular Uptake and Retention of Contrast Agent in Necrotic Neurons ... 34
2.10 1-Methyl-4-Phenyl-1,2,3,6-Tetrahydropyridine Injections ... 35
2.11 Histological Analysis of MPTP-Treated and Control Mice ... 36
2.12 Statistical Analysis ... 36
vi
3.1 N2A Cells Do Not Easily Undergo Chemical-Induced Apoptosis ... 37
3.2 Mouse Primary Cortical Neurons Undergo Chemical-Induced Apoptosis ... 39
3.3 Contrast Agent Optimization ... 39
3.4 Cell Viability Studies ... 40
3.5 Evaluation of Contrast Agent Uptake in Individual Neurons ... 43
3.6 Apoptosis and Contrast Agent Uptake is Caspase-3 Dependent ... 46
3.7 Evaluation of Contrast Agent Retention in Necrotic Neurons ... 49
3.8 1-Methyl-4-Phenyl-1,2,3,6-Tetrahydropyridine Mouse Model ... 53
Chapter 4 ... 57
4 Discussion ... 57
4.1 Apoptosis in Tumor Cell Lines ... 58
4.2 Cell Viability Studies ... 58
4.3 Apoptotic Neurons Selectively Retain the Contrast Agent ... 58
4.4 Apoptosis and Contrast Agent Retention is Caspase-3 Dependent ... 60
4.5 Necrotic Neurons Do Not Retain the Contrast Agent ... 61
4.6 1-Methyl-4-Phenyl-1,2,3,6-Tetrahydropyridine Mouse Model ... 61
4.7 Future Studies ... 63
4.8 Conclusion ... 64
References ... 65
Appendix A...81
Curriculum Vitae...82
vii
List of Figures
Figure 1. Schematic representation of the two main apoptotic pathways. ... 4
Figure 2. Time progression of the major morphological and biochemical events in apoptosis ...16
Figure 3. Schematic representation of our contrast agent. ... 28
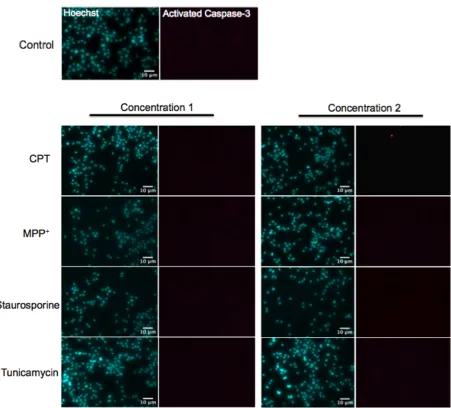
Figure 4. N2A cells do not display apoptotic nuclear morphology or caspase-3 activation in response to pro-apoptotic drugs. ... 38
Figure 5. NeuN immunostaining in mouse primary cortical neuron culture... 40
Figure 6. Mouse primary cortical neurons undergo apoptosis and caspase-3 activation in response to camptothecin treatment ... 41
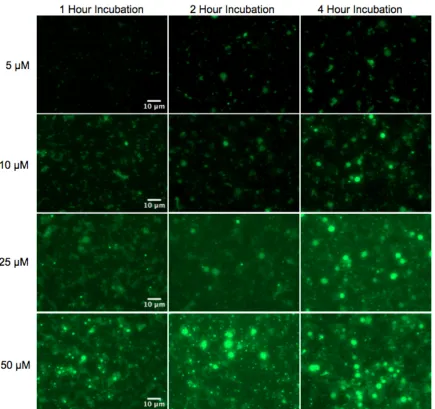
Figure 7. Optimization of contrast agent concentration and incubation time. Primary cortical neurons were treated with 10 µM CPT for 24 hours to induce apoptosis. ... 42
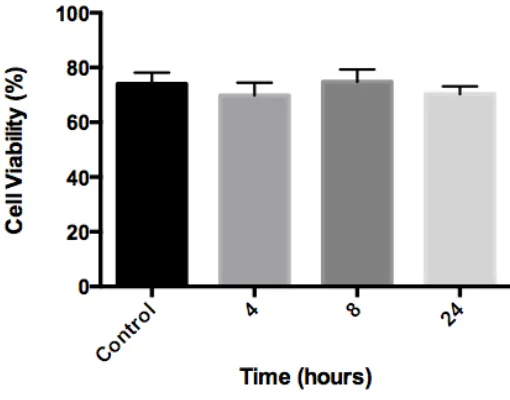
Figure 8. Exposure to contrast agent for up to 24 hours does not affect cell viability...44
Figure 9. Apoptotic neurons selectively retain the contrast agent. ... 45
Figure 10. CPT increases the proportion of neurons retaining the contrast agent and is
blocked with the addition of a caspase-3 inhibitor...48
Figure 11. MPP+increases the proportion of neurons retaining the contrast agent and is blocked with the addition of a caspase-3 inhibitor...50
Figure 12. Necrotic cells do not retain the contrast agent. ... 52
viii
List of Abbreviations
AD: Alzheimer’s Disease
BBB: Blood Brain Barrier
CA: Contrast Agent
CAD: Caspase-Activated Deoxyribonuclease
CNS: Central Nervous System
CT: Computed Tomography
DAB: Diaminobenzidine
DAPI: 4’,6-Diamidino-2-Phenylindole
DISC: Death-Inducing Signaling Complex
DTPA: Diethylene-Triamine-pentaacetate
18F: Fluorine-18
FDG: Fluorodeoxyglucose
Gd: Gadolinium
1H: Hydrogen
HD: Huntington’s Disease
H&E: Hematoxylin and Eosin
123I: Iodine-123
ICAD: Inhibitor of Caspase-Activated Deoxyribonuclease
ix
MAO-B: Monoamine Oxidase B
MCA: Middle Cerebral Artery Occlusion
MPP+: 1-methyl-4-phenylpyridinium
MPT: Mitochondrial Permeability Transition
MPTP: 1-methyl-4-phenyl-1,2,3,6-tetrahydropyridine
MRI: Magnetic Resonance Imaging
MR: Magnetic Resonance
N2A: Neuro-2A
PARP: Poly ADP-Ribose Polymerase
PD: Parkinson’s Disease
PET: Positron Emission Tomography
PI: Propidium Iodide
PS: Phosphatidyl Serine
SN: Substantia Nigra
SPECT: Single-Photon Emission Computed Tomography
99mTc: Technetium-99m
Tdt: Deoxynucleotidyl Transferase
TNF: Tumor Necrosis Factor
Chapter 1
1
Introduction
Since its discovery in 1972 by Kerr et al., the process of programmed cell death, otherwise known as apoptosis, has been intensely investigated. Years of research have gone into uncovering the molecular events and signaling pathways involved in this mode of cell death. Although we have come extremely far in the past 40 years, there is still no robust way of detecting apoptosis in living organisms. Additionally, there are limited techniques available to detect and label unfixed living apoptotic cells in culture.
This thesis presents a novel contrast agent for the in vivo detection of apoptosis. We present evidence in primary neuron culture that demonstrates the potential to allow the direct imaging of cells and tissues undergoing apoptosis in intact animals and humans. This imaging technique may prove to be very useful in the assessment of neuronal injury or the early diagnosis of neurodegenerative disease.
The following chapter reviews the process of programmed cell death or apoptosis, discusses common cell culture and mouse models used to investigate apoptosis and highlights current methods available for detecting apoptosis in vitro and in vivo. Finally, the chapter concludes with an introduction and description of our novel contrast agent for the in vivo detection of apoptosis.
1.1 Apoptosis
1.1.1
Overview of Programmed Cell Death
cascade of enzymes and proteases (Zimmermann and Green, 2001). Apoptosis is characterized by a series of morphological events, including cell shrinkage, chromatin condensation and nuclear fragmentation (Kerr et al., 1972). During the later stages of apoptosis the cellular and nuclear contents are packaged into membrane-bound vesicles called apoptotic bodies (Savill, 1997). The apoptotic bodies bud from the cell surface and are subsequently engulfed by surrounding macrophages and scavengers (Platt et al., 1998). Due to the controlled nature of this form of cell death, the cell is destroyed and removed without releasing its cellular contents into the extracellular space, avoiding any unwanted immune response (Savill and Fadok, 2000).
1.1.2
Caspases: The Mediators of Apoptosis
Caspases are a family of cysteine proteases that orchestrate the process of programmed cell death. They are synthesized in all cells and exist as inactive zymogens within the cytoplasm (McIlwain et al., 2013). In their inactive form, they contain a variable length pro-domain followed by a large and small subunit. Cleavage and subsequent release of the pro-domain causes activation of the caspase (Cohen, 1997). Activated caspases recognize specific tetrapeptide sequences on their substrates. Once activated, they cleave other caspases and downstream substrates after aspartic acid residues (Stennicke and Salvesen, 1998).
The caspases involved in apoptosis can be divided into two main groups: initiator caspases and effector caspases. The initiator caspases-8 and -9 are the primary caspases responsible for propagating the apoptotic signal through the apoptotic cascade and activating the pro-forms of the effector caspases (McIlwain et al., 2013). Once caspase-8 and -9 have been activated, they quickly cleave the effector caspases resulting in their activation (Stennicke et al., 1998; Slee et al., 1999).
important executioner (McIlwain et al., 2013). Caspase-3 recognizes its substrates based on the tetrapeptide sequence DEVD (Stennicke and Salvesen, 1998). Once activated, caspase-3 is responsible for cleaving, and thereby activating, the enzymes that will dismantle and destroy the cell (Nicholson, 1999). Once caspase-3 has been activated within a cell, it is committed to die.
1.1.3
Molecular Signaling Pathways of Apoptosis
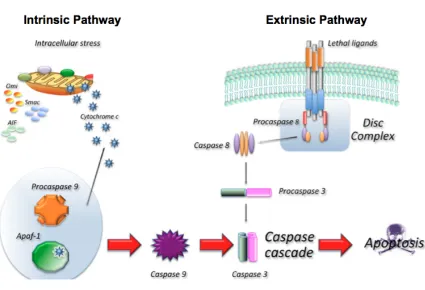
Apoptosis is a highly complex process involving alternate signaling pathways and numerous proteins and enzymes. There are a number of different ways to trigger apoptosis, and as a result, there are different signaling pathways that can be activated. The two main apoptotic pathways are the extrinsic or death receptor pathway and the intrinsic or mitochondrial pathway (Fig. 1). These two pathways eventually converge on a common pathway resulting in the activation of caspase-3, the key mediator of apoptosis (Zimmermann and Green, 2001).
1.1.3.1
Extrinsic Pathway
As the name suggests, the extrinsic pathway or death receptor pathway involves the binding of extracellular death ligands to their respective death receptors at the cell
surface. The death receptors involved in this pathway are members of the tumour necrosis factor (TNF) receptor superfamily. These receptors all contain what is known as the death domain – a cytoplasmic domain that allows the death receptor to transmit the apoptotic signal from the extracellular environment to the intracellular environment (Ashkenazi, 2002). Some of the main death receptors and their respective ligands include FasR/FasL, TNF-α/ TNFR1, Apo2L/DR4 and Apo2L/DR5 (Nair et al., 2014).
Binding of a death ligand to its respective receptor results in the clustering and
Figure 1. Schematic representation of the two main apoptotic pathways. In the extrinsic pathway binding of an extracellular death ligand to its respective death receptor leads to the formation of the DISC complex and activation of caspase-8. In the intrinsic pathway intracellular stressors lead to the release of cytochrome c from the mitochondria and the formation of the apoptosome and activation of 9. Caspase-8 and caspase-9 activate caspase-3 leading to the destruction of the cell. Adapted from
impactaging.com.
proceeds to propagate the apoptotic signal by cleaving and activating the executioner caspase-3 (Stennicke et al., 1998).
1.1.3.2
Intrinsic Pathway
pathway. These include the withdrawal of growth factors or hormones, radiation, toxins, hyperthermia, oxidative stress or DNA damage (Harmon et al., 1990; Clutton, 1997; Wadia et al., 1998; Watters, 1999). All of these insults are able to induce changes in the inner mitochondrial membrane that result in the opening of the mitochondria
permeability transition (MPT) pore and loss of transmembrane potential (Green and Kroemer, 2004). Loss of the mitochondrial transmembrane potential causes the release of cytochrome c and other pro-apoptotic proteins from the intermembrane space of the mitochondria. The release of these proteins allows the formation of a caspase-activating structure called the apoptosome. The apoptosome is a large multimeric protein structure that incorporates and is responsible for activating caspase-9 (Zou et al., 1999). Following the formation of the apoptosome, activated caspase-9 proceeds to cleave and activate caspase-3, propagating the apoptotic signal through the pathway (Slee et al., 1999).
1.1.3.3
Execution Pathway
Activation of caspase-3 marks the end of both the extrinsic and intrinsic apoptotic
pathways and the beginning of the execution pathway and degradation phase. It is during this phase that the cellular proteins responsible for dismantling and packaging up the cell become activated (Elmore, 2007). Once caspase-3 has been activated, the typical series of morphological changes leading to destruction and removal of the cell take place. These include cell shrinkage, chromatin condensation, nuclear fragmentation, plasma membrane blebbing, and finally the formation of apoptotic bodies (Kerr et al., 1972; Ziegler and Groscurth, 2004).
gelsolin, an actin-binding protein that regulates actin filament assembly and disassembly. In apoptotic cells, cleavage of gelsolin by caspase-3 leads to disruption of the actin cytoskeleton contributing to the morphological changes observed in apoptosis (Kothakota et al., 1997).
1.1.4
Morphological and Biochemical Hallmarks of Apoptosis
Due to the regulated nature of apoptosis, cells undergoing this mode of cell death follow a typical sequence of morphological changes that lead to the destruction of the cell (Kerr et al., 1972). The first morphological change that can be observed in apoptotic cells is retraction and rounding up of the cell body. In the earliest stages of apoptosis the cell severs attachments to other cells and the extracellular matrix. Proteolysis and destruction of the cytoskeleton by caspase-3 and its substrates contributes to cell rounding (Taylor et al., 2008). This process of retraction and rounding can be easily seen in adherent cells grown in culture.
Following retraction and rounding, there is a reduction in cell volume, referred to as cell shrinkage. The cytoplasm becomes more dense and the organelles become more tightly packed (Bortner and Cidlowski, 1998). In the nucleus, chromatin condensation, or
pyknosis, occurs. Cells undergoing chromatin condensation display compact round nuclei and can be easily identified with a nuclear stain. In contrast, healthy cells exhibit oval-shaped nuclei with more diffuse staining (Saraste and Pulkki, 2000; Ziegler and Groscurth, 2004).
As apoptosis progresses, membrane blebbing and fragmentation of the nucleus occurs. Cytoplasmic protrusions extend outwards from the cell surface giving a ruffled
During the final stages of apoptosis, intact organelles and nuclear content are packaged into sealed membrane vesicles called apoptotic bodies. These apoptotic bodies bud from the blebbing plasma membrane (Saraste and Pulkki, 2000; Ziegler and Groscurth, 2004). Finally, the apoptotic bodies and remaining cell fragments are engulfed and digested by macrophages and other phagocytes. This allows the cell to be completely degraded and removed while maintaining membrane integrity (Platt et al., 1998). This is essential in avoiding an unwanted inflammatory response that would result from the release of cellular contents into the extracellular space (Savill and Fadok, 2000).
In addition to the characteristic morphological changes that occur during apoptosis, apoptotic cells undergo a number of characteristic biochemical changes. One of the major biochemical hallmarks of apoptosis is the externalization of the phospholipid
phosphatidyl serine (PS) to the outer leaflet of the plasma membrane. This is an early event in the apoptotic cascade, occurring before any major morphological changes (Martin et al., 1995). Under normal circumstances, PS is restricted to the inner leaflet of the plasma membrane (Balasubramanian and Schroit, 2003). In cells undergoing
apoptosis, this phospholipid is externalized and acts as a recruitment signal that allows phagocytes to recognize and engulf the apoptotic cell (Fadok et al., 1992).
Another biochemical hallmark of apoptosis is the controlled degradation of nuclear DNA into small fragments of equal length. Within the nucleus, double-stranded DNA is
digested into internucleosomal fragments of approximately 180 base pairs by
endonucleases (Duke et al., 1983; Wyllie et al., 1984). These endonucleases produce double-stranded DNA fragments with blunt ends and single base 3’ overhangs (Alnemri and Litwack, 1990; Didenko and Hornsby, 1996). This process occurs after caspase-3 activation and contributes to nuclear pyknosis and fragmentation.
1.1.5
Differentiating Apoptosis from Necrosis
mechanism and involves a proteolytic cascade and caspase activation. In contrast,
necrosis is a passive process: it is an unregulated and accidental form of cell death that is energy-independent (De Saint-Hubert et al., 2009). Necrosis can result from a number of different insults, such as metabolic failure or mechanical trauma (Majno and Joris, 1995).
Apoptosis and necrosis differ in their morphological and biochemical features. Apoptotic cells display a typical progression of morphological changes including cell shrinkage, nuclear condensation, nuclear fragmentation, and the formation of apoptotic bodies (Kerr et al., 1972; Saraste and Pulkki, 2000). Cellular organelles remain intact throughout the destruction process and nuclear DNA undergoes internucleosomal fragmentation (Wyllie et al., 1984; Elmore, 2007). Necrotic cells on the other hand undergo cell swelling which eventually ruptures the plasma membrane leading to cell lysis. In this uncontrolled form of cell death organelles are disrupted and irregular DNA fragmentation occurs (Trump et al., 1997).
Apoptosis and necrosis also differ in their resulting immune response. Cells undergoing necrosis quickly lose their membrane integrity. Loss of membrane integrity and
consequent release of cellular content triggers an inflammatory response. In contrast, cells undergoing apoptosis maintain their membrane integrity throughout the entire death process. Without the release of cytosolic material and proteolytic enzymes an
inflammatory reaction does not occur (Savill and Fadok, 2000).
1.1.6
Apoptosis in Physiology and Pathology
fingers, leading to the development of a hand with five separate digits (Mori et al., 1995). If apoptosis is not effectively initiated, congenital deformities may result. One such deformity is syndactyly, where two or more digits fail to separate and are left fused together (Chong, 2010). Apoptosis also plays an essential role in adult organisms. For example, the epithelial cells of the small intestine are continually renewing themselves. In order to make room for new cells, older cells must undergo apoptosis and die (Shmuel, 1992).
It is clear that programmed cell death is essential for multicellular organisms. However, the apoptotic process requires a delicate balance: too little or too much apoptosis can have detrimental effects on an organism. Too little apoptosis can lead to uncontrollable tumour growth (Wong, 2011). Under normal circumstances, DNA damage will lead to the violation of cell cycle checkpoints, triggering apoptosis and preventing the mutated or damaged cell from surviving. In cancer, cells are able to overstep cell cycle checkpoints and evade apoptosis (Levine, 1997; Agarwal et al., 1998; Roos and Kaina, 2006). The evasion of apoptosis is fundamental to tumour development and resistance to anti-cancer therapy (Wong, 2011).
At the other end of the spectrum, too much apoptosis can be just as detrimental. In the brain, where neurons are not capable of regenerating, an excess of apoptosis can have severe consequences. In stroke patients, the ischemic penumbra is a surrounding zone of brain tissue that is not as severely affected by the stroke. It receives just enough oxygen and nutrients to survive, but not enough for normal function. Hours to days after the stroke, some cells found within this region undergo apoptosis, leading to more neuron loss and cognitive damage (Choi, 1996; Broughton et al., 2009).
1.1.6.1
Apoptosis and Neurodegenerative Disease
An excess of apoptosis can also contribute to neurodegeneration and has been implicated in a variety of neurodegenerative disorders, including Alzheimer’s disease (AD),
that is characterized by progressive cognitive impairment and memory loss. On a cellular level, it is associated with neurofibrillary tangles, amyloid plaques, the loss of synapses, and the death of hippocampal and cortical neurons (Querfurth and Laferla, 2010). A number of studies have demonstrated a role for apoptotic-related neuron loss in AD. Post-mortem examination of brain tissue from patients with AD demonstrates increased DNA damage and caspase activation in neurons associated with amyloid deposits (Su et al., 1994; Masliah et al., 1998). Additionally, it has been shown that exposure of cultured neurons to amyloid-β can induce apoptosis directly (Loo et al., 1993).
PD is a movement disorder that is characterized by the progressive loss of dopaminergic neurons within the substantia nigra (SN). By the time of death, individuals affected by PD have lost 50-70% of their dopaminergic neurons within the SN (Davie, 2008). Apoptosis has been implicated as an important mechanism for neuron loss in PD. Post-mortem examination of brain tissue from patients with PD implicate apoptosis-related DNA damage and gene activation in the loss of dopamine neurons of the substantia nigra (Mochizuki et al., 1996; Jenner and Olanow, 1998). Additionally, mouse models and cell-culture models of PD implicate caspase-dependent modes of cell death in the loss of dopaminergic nigral neurons (Viswanath et al., 2001).
1.2 Models of Apoptosis
1.2.1
Inducing Apoptosis in Cell Culture
There are a variety of ways to trigger apoptosis and therefore there are a number of different ways to induce apoptosis in cells grown in culture. One of the most common methods to induce apoptosis is with the use of chemicals or drugs. A number of drugs that induce apoptosis have been discovered as the result of anti-cancer drug research efforts. Camptothecin is a pro-apoptotic drug that was isolated from plant extracts in the 1950’s and found to have anti-tumour activity (Wall and Wani, 1996). The compound induces apoptosis by inhibiting the DNA enzyme topoisomerase I. This causes DNA damage in the cell leading to the induction of apoptosis (Liu et al., 1996). Doxorubicin and etoposide are also anticancer drugs that can induce apoptosis in culture. They inhibit topoisomerase II causing DNA damage and inducing cell death (Karpinich et al., 2002; Mizutani et al., 2005). Additional drugs include staurosporine and tunicamycin.
Staurosporine is a protein kinase inhibitor that induces apoptosis (Tamaoki et al., 1986). Tunicamycin blocks N-linked glycosylation and causes endoplasmic reticulum stress-induced apoptosis (Shiraishi et al., 2006).
It is also possible to trigger apoptosis in culture using the death receptor pathway. There are a number of different death receptors and their respective ligands can be used to induce apoptosis. Additionally, cross-linking a death receptor with an agonist anti-body can be used to stimulate the extrinsic pathway and induce apoptosis. The anti-Fas
antibody is routinely used to induce apoptosis via the death receptor pathway (Gottlieb et al., 1996).
1.2.2
Mouse Models of Apoptosis
In order to study apoptosis in vivo, a number of mouse models have been developed. The mouse models that will be outlined in this section include the induction of hepatic
apoptosis via the injection of Fas antibody, treatment of mouse tumor cells with anti-tumor drugs, cerebral stroke models and the
1-methyl-4-phenyl-1,2,3,6-tetrahydropyridine (MPTP) mouse model of Parkinson’s disease.
1.2.2.1
Fas-Mediated Hepatic Apoptosis
In 1993, Ogasawara et al. reported the lethal effect of the anti-Fas antibody in mice. Intraperitoneal injection of the anti-Fas monoclonal antibody was found to rapidly induce apoptosis in hepatocytes. Histological analysis revealed that the majority of hepatocytes displayed pyknotic nuclei only 2 hours after injection with the antibody. The induction of apoptosis was extensive and occurred extremely rapidly killing the majority of mice within 6 hours (Ogasawara et al., 1993).
The mouse model of Fas-mediated hepatic apoptosis is now the most frequently used model to study apoptosis (Blankenberg et al., 1999; Keen et al., 2005; Luo et al., 2005). This model provides an excellent method for rapidly inducing widespread apoptosis in living organisms. Quantitatively, 63.7% of cells in anti-Fas treated livers stained positive for activated caspase-3 compared to normal livers that had 18.3% positive staining (De Saint-Hubert et al., 2009).
1.2.2.2
Treatment of Tumor Models with Anticancer Drugs
Treatment of tumor bearing tissue in mice with anti-cancer drugs can be used to model apoptosis in vivo. Tumor xenograft models are commonly used to produce tumors in mice. Tumor cells are injected subcutaneously or intramuscularly leading to the development of a tumor (Morton and Houghton, 2007). Mice can then be treated with anti-tumor chemotherapeutic drugs, such as doxorubicin, to induce apoptosis in the tumor (Hossain et al., 2012). Orthotopic lymphoma models have also been used to model
lymphoma cells. Treatment with doxorubicin causes massive tumor cell loss within 24 hours of treatment and almost complete tumor regression within 4 days (Mandl et al., 2004). Cyclophosphamide has also been used to treat lymphoma in mice. Histological analysis revealed virtually complete (>95%) apoptosis in tumors treated with
cyclophosphamide compared to <5% apoptotic cells in untreated control tumors (Blankenberg et al., 1998).
1.2.2.3
Cerebral Stroke Models
In the hours to days following an ischemic stroke, some neurons within the penumbra undergo apoptosis (Broughton et al., 2009). A number of different mouse stroke models exist, providing a method to recreate ischemia-induced apoptosis. The most utilized stroke model in mice has been the middle cerebral artery (MCA) occlusion. The MCA can be occluded either transiently or permanently producing a stroke; however, apoptotic cell death has been found to be more extensive after transient occlusion (Love, 2003). Histological analysis has revealed that apoptosis peaks 24-48 hours after reperfusion in the transient stroke model (Linnik et al., 1995; Chen et al., 1997).
Cerebral stroke models provide a valuable tool for studying apoptosis in vivo within the central nervous system (CNS). A major limitation of this model is the mixture of necrosis and apoptosis that occurs after stroke. After ischemic stroke, the most severely affected area dies rapidly via necrosis and forms the ischemic core (Kaufmann et al., 1999). The combination of necrosis and apoptosis make it difficult to isolate apoptotic cell death.
1.2.2.4
1-Methyl-4-Phenyl-1,2,3,6-Tetrahydropyridine Mouse
Model of Parkinson’s Disease
up by astrocytes and converted to its toxic form 1-methyl-4-phenylpyridinium (MPP+) by monoamine oxidase B (MAO-B). MPP+ is then released into the extracellular space and taken up by dopaminergic neurons via the dopamine transporter (Tipton and Singer, 1993). Once in the cell, MPP+ acts to inhibit complex I of the electron transport chain, interfering with oxidative phosphorylation in the mitochondria (Watanabe et al., 2005).
Primary neuronal culture treated with MPP+ display apoptotic nuclear morphology and
stain positively for activated caspase-3 (Viswanath et al., 2001). Intraperitoneal (IP) injection of MPTP selectively destroys the dopaminergic neurons of the SN in mice and causes Parkinsonian-like symptoms. Tatton and Kish demonstrated that a total
cumulative dose of 150 mg/kg of MPTP delivered over five consecutive days
reproducibly induces apoptosis in the dopaminergic neurons of the SN in C57Bl mice. Histological analysis revealed apoptotic DNA fragmentation and chromatin condensation in the dopaminergic neurons of the SN. They found that apoptotic cell death was initiated 72 hours after the first MPTP injection and peaked 24 hours after the final injection (Tatton and Kish, 1997).
The same protocol used by Tatton and Kish can be replicated to provide a mouse model for apoptosis within the CNS. Neurons were documented to die primarily via an apoptotic mechanism and the time of peak cell death is well documented. A limitation of this method is the small size of the SN and limited number of dopaminergic cells found within the mouse brain.
1.3 Methods for Detecting Apoptosis
in Vitro
1.3.1
Cytomorphological Detection
Using electron microscopy, Kerr et al. closely observed and characterized the morphological features exhibited by apoptotic cells. They noticed that these cells appeared to undergo a programmed form of cell death that followed a characteristic progression of morphological events. This was in contrast to what was seen traditionally in necrosis. Using electron microscopy, they observed the characteristic morphological features in multiple types of tissue samples from various organisms (Kerr et al., 1972).
Today, electron microscopy is considered the gold standard for identifying apoptotic cells based on nuclear morphology. Electron microscopy boasts extremely high spatial
resolution that is ideal for detecting the ultrastructural changes seen in apoptosis
(Martinez et al., 2010). The same cytomorphological features that Kerr et al. described in 1972 are still used as benchmarks to identify apoptotic cells. Nuclear fragmentation and the formation of apoptotic bodies can be used to identify late apoptotic cells (Fig. 2). High spatial resolution also makes it possible to detect some of the morphological changes associated with early apoptosis, such as chromatin condensation (Watanabe et al., 2002; Martinez et al., 2010). On the downside, electron microscopy is very expensive and requires a high degree of training. The labour and time involved in visualizing samples with electron microscopy makes screening large numbers of cells very difficult. Additionally, cells must be fixed in order to visualize with electron microscopy, making cells no longer viable after detection (Huerta et al., 2007).
While not as sensitive as electron microscopy, light microscopy and fluorescence
Figure 2. Time progression of the major morphological and biochemical events in apoptosis. A variety of methods have been developed to analyze apoptotic cell death based on the morphological and biochemical events that take place during apoptosis. Some assays target early apoptotic events, such as changes in the plasma membrane composition, and are useful for detecting early apoptosis. In contrast, some assays target late apoptotic events, such as DNA fragmentation, and are only capable of detecting late apoptosis.
use of fluorescent DNA-binding dyes like Hoechst 33342 make it much easier to identify pyknotic and fragmented nuclei. Hoechst 33342 is membrane permeable allowing
microscopy, it is only possible to detect late apoptotic cells that display considerable nuclear condensation and fragmentation (Fig. 2). Another limitation of light microscopy and fluorescence microscopy, as seen in electron microscopy, is difficulty in screening large numbers of cells. Additionally, electron microscopy, light microscopy and fluorescence microscopy are only able to capture apoptosis at a specific point of time. Apoptosis occurs in an asynchronous manner and proceeds rapidly once it has reached the degradation phase. As a result, it can be difficult to detect a large number of apoptotic cells using this method (Elmore, 2007; Huerta et al., 2007; Martinez et al., 2010).
1.3.2
DNA Fragmentation
Degradation of nuclear DNA into fragments of approximately 180 base pairs is a major biochemical hallmark of apoptosis. DNA is cleaved at internucleosomal sites by
endonucleases that become activated by caspase-3 (Duke et al., 1983; Wyllie et al., 1984). Several methods have been developed to detect apoptosis based on DNA
fragmentation. DNA laddering was developed to visualize DNA fragmentation when run on a gel. In this technique, genomic DNA is isolated from cells or tissue samples and electrophoresed on an agarose gel. Cells or tissues undergoing apoptosis will demonstrate a characteristic ladder of DNA fragments resulting from the regular cleavage of DNA at 180 base pair intervals (Daniel et al., 1999). This is in contrast to DNA isolated from necrotic cells, which demonstrate a smear when run on an agarose gel, resulting from random, non-uniform DNA degradation (Wyllie et al., 1984). DNA laddering is a good method for characterizing a population of cells as apoptotic; however, this technique has many limitations. In order to see the characteristic ladder, cells must be in the late stages of apoptosis, allowing enough time for adequate DNA fragmentation to take place (Collins et al., 1997). As a result, this method is not suitable for detecting cells in the early stages of apoptosis (Fig. 2). Another major disadvantage of DNA laddering is that it is qualitative and not quantitative. Laddering is only able to tell you if apoptosis is
In 1992, Gavrieli et al. developed the terminal deoxynucleotidyl transferase-dUTP nick end labelling (TUNEL) assay for the detection of apoptotic cells based on DNA
fragmentation. In this technique, free 3’OH ends of DNA fragments are labelled enzymatically by terminal deoxynucleotidyl transferase (Tdt). The signal is then
amplified and can be detected using light microscopy, fluorescence microscopy or flow cytometry (Gavrieli et al., 1992). The major advantage of this technique is the ability to provide in situ detection of DNA fragmentation. Using the TUNEL method, individual cells from tissue samples or culture can be identified as apoptotic. A variety of
commercially available kits make this a quick and easy way to detect DNA
fragmentation. The major disadvantage associated with this technique is that it is not completely specific to apoptosis. Random DNA fragmentation can occur in necrotic cells, resulting in false positives. Additionally, cells must be fixed prior to TUNEL staining, leaving cells no longer viable and making this an end point measurement (Elmore, 2007; Huerta et al., 2007; Martinez et al., 2010).
1.3.3
Annexin V
The externalization of PS from the inner leaflet to the outer leaflet during apoptosis is another major biochemical hallmark of apoptosis (Fadok et al., 1992). In 1994, Koopman et al. reported the ability of Annexin V to bind to externalized PS on the membrane of apoptotic cells. Annexin V is an endogenous anticoagulant protein that has an extremely high affinity for negatively charged phospholipids like PS (Tait et al., 1989). In the Annexin V binding assay, living cells are incubated with labeled Annexin V. Apoptotic cells that have externalized PS will bind labeled Annexin V allowing for detection using FM or flow cytometry (Koopman et al., 1994). A major limitation of this technique is that Annexin V alone is not able to discriminate between apoptosis and necrosis. The loss of membrane integrity is a defining feature of necrosis. Annexin V is consequently able to penetrate necrotic cells and label the inner leaflet of the membrane. In order to
distinguish between apoptosis and necrosis, this assay requires the addition of a
discrimination between apoptotic and necrotic cells (Annexin V positive and PI negative cells are classified as apoptotic; Annexin V positive and PI positive cells are classified as necrotic). Despite the inability of Annexin V to label and distinguish apoptotic cells on its own, this assay has some notable advantages. The first is the ability to observe apoptosis in living cells without the need of fixation. The second is the ability to detect cells in the early stages of apoptosis, as the externalization of PS to the outer leaflet is an early apoptotic event (Fig. 2) (Martin et al., 1995).
1.3.4
Detection of Apoptotic Mediators
A variety of fluorogenic caspase substrates have also been developed to detect caspase activation as a marker of apoptosis (Liu et al., 1999; Cai et al., 2001; Wang et al., 2005). These substrates come in various forms with different tetrapeptide cleavage sequences allowing the detection of specific individual caspases. This technique involves incubating cell lysate with the fluorogenic substrate. The fluorogenic substrates shift their
fluorescence emission maximum after cleavage by caspase-3 and are quantified using a fluorometer or fluorescence microtiter plate reader (Wang et al., 2005). This technique provides a quick and reliable method for quantifying caspase activation and apoptosis. This technique also offers the ability to target different caspases. A major limitation, however, stems from the fact that caspases exist as cytoplasmic enzymes. This requires lysis of the cells destroying the integrity of the sample.
1.3.5
Cytochrome C and Mitochondrial Detection Methods
The final method for apoptosis detection in vitro that will be discussed is targeted specifically at the mitochondrial or intrinsic apoptotic pathway. The major biochemical features of mitochondrial apoptosis are the opening of the MPT pore, loss of the
mitochondrial transmembrane potential, and subsequent release of cytochrome c and other apoptotic proteins from the mitochondrial intermembrane space (Zimmermann and Green, 2001; Green and Kroemer, 2004). A variety of detection methods have been developed that target these molecular events. These assays are used to identify early apoptotic cells, as mitochondrial changes occur early on in the progression of apoptotic events (Fig. 2). Additionally, as these techniques are specific for the mitochondrial apoptotic pathway, they cannot detect apoptosis initiated through the external or death receptor pathway.
In healthy cells, cytochrome c is confined to the intermembrane space of the mitochondria. In cells undergoing apoptosis, cytochrome c is released from the
levels between cytosolic and mitochondrial fractions. Cytosolic fractions from cells undergoing apoptosis show an increase in cytochrome c staining compared to healthy cytosolic fractions (Bossy-Wetzel and Green, 2000). Additionally, subcellular
distribution of cytochrome c can be analysed by immunostaining for cytochrome c. Healthy cells display punctate cyctochrome c staining within the mitochondria whereas apoptotic cells show more diffuse staining throughout the cytoplasm (Heiskanen et al., 1999). As with many of the assays discussed so far, cells are no longer left viable making this an end point for detection.
Another method for the detection of apoptosis based on mitochondrial changes involves tracking changes in the mitochondrial membrane potential. The opening of the MPT pore and loss of mitochondrial transmembrane potential is one of the earliest events in the intrinsic apoptotic pathway (Green and Kroemer, 2004). Cationic lipophilic dyes accumulate within the mitochondrial membrane as a result of the negative
transmembrane potential produced during oxidative metabolism (Ehrenberg et al., 1988). The opening of the MPT pore and loss of transmembrane potential correlates to a loss of fluorescent dye due to the diminished capacity of the mitochondria to retain the probe (Johnson et al., 1981). The dye can be added to living cells and mitochondrial events can be imaged over time using FM or laser-scanning confocal microscopy. A major
1.4 Methods for Detecting Apoptosis
in Vivo
1.4.1
Molecular Imaging
The development of molecular imaging techniques provides an opportunity to detect and image apoptosis in vivo. Molecular imaging can be defined as the non-invasive
visualization of biochemical events at the cellular level in intact living organisms (Weissleder and Mahmood, 2001). In the past, in vivo imaging modalities have focused primarily on imaging gross anatomy. Disease progression and treatment outcomes were detected as structural changes and abnormalities using conventional techniques, such as X-ray, computed tomography (CT) imaging or magnetic resonance imaging (MRI) (Vernooij and Smits, 2012). More recently, advanced MRI techniques have probed brain function using functional MRI, structural connectivity using diffusion-weighted MRI, and metabolism using MR (magnetic resonance) spectroscopy (Lowe et al., 2000; Maheshwari et al., 2000; Hagmann et al., 2008; Bullmore et al., 2009; van den Heuvel and Hulshoff Pol, 2010). Now, with the emergence of new imaging contrast agents, it is possible to non-invasively image specific molecular targets in living, intact organisms. These targeted contrast agents can be used to visualize complex biochemical processes at the cellular level. Imaging can be performed in real-time, making it possible to follow molecular targets throughout the body and monitor changes in activity or consumption (James and Gambhir, 2012).
1.4.2
Molecular Imaging Modalities
There are a variety of imaging modalities that can be used for molecular imaging. The imaging modalities that are of specific interest in relation to this thesis include MRI and nuclear imaging techniques such as positron emission tomography (PET) and single-photon emission computed tomography (SPECT).
1.4.2.1
Magnetic Resonance Imaging
imaging method uses radio frequency waves in the presence of a powerful magnetic field to obtain information about specific nuclei found within the body (Katti et al., 2011). Due to their high concentration in water molecules in the body, MRI images are primarily formed from hydrogen nuclei (1H). The specific magnetic properties of these hydrogen nuclei are tissue specific and therefore can be used to produce detailed anatomical images (James and Gambhir, 2012).
The development of contrast agents (CA) has made it possible to use MRI for molecular imaging. CAs or imaging probes are exogenous substances that produce a bright signal, or a signal void in the MR image. They are usually injected into the body of the living organism and can be localized to particular tissues or areas within the body (James and Gambhir, 2012). The most commonly used MRI CAs are gadolinium (Gd) based and highlight vessels or regions of vascular permeability (Caravan et al., 1999). To provide meaningful biochemical information, contrast agents must be targeted toward specific biochemical events. For example, Gd-based CA can be fused to certain peptide sequences, antibodies, or targeting moieties (Park et al., 2008; Bort et al., 2014).
The major advantage associated with MRI is the extremely high spatial and temporal resolution. This makes it possible to track biomarkers inside the body and identify their exact position. The major limitation associated with this imaging technique is its low sensitivity, meaning a high concentration of CA must accumulate in the tissue before detection is possible (James and Gambhir, 2012).
1.4.2.2
Radionuclide Imaging
radionuclide for PET imaging is fluorine-18 (18F) (Alauddin, 2012). SPECT imaging uses the same fundamental principals to visualize physiological processes but different
radioactive isotopes that emit gamma radiation. Gamma cameras are used to detect the radiation. The gamma cameras rotate around the patient to acquire multiple projections that are used to reconstruct tomographic images (Khalil et al., 2011). The most common radionuclides used for SPECT imaging are technetium-99m (99mTc), iodine-123 (123I),
and indium-111 (111In) (Rudin and Weissleder, 2003).
Like MRI, in order to provide information on biochemical processes, the radiolabeled imaging agent must be targeted to specific molecular events. This can be achieved by labeling specific molecules, peptides, enzymes, or antibodies with radioactive isotopes. In the clinic, the most commonly used PET imaging agent is a radiolabelled analog of glucose, fluorodeoxyglucose (FDG). FDG is taken up by cells in living organisms and accumulates in cells with high metabolic activity. Generally, cancer cells have higher than normal glucose requirements and consequently take up more FDG than other tissues. This allows the visualization of tumors and cancer in living organisms using FDG and PET imaging (Gambhir, 2002).
The main advantage associated with radionuclide imaging is its excellent sensitivity. PET and SPECT imaging are much more sensitive than MRI, allowing for the use of
nanomolar concentrations of imaging agent. Unfortunately, what PET and SPECT imaging gain in sensitivity they lose in spatial resolution (James and Gambhir, 2012).
1.4.3 Molecular Imaging of Apoptosis
1.4.3.1
Radiolabelled Annexin V
To date, the most successful method for imaging apoptosis has been the use of
radiolabelled Annexin V (Tait, 2008). This is a direct extension of the in vitro imaging technique that uses fluorescently labeled Annexin V to bind to PS on the outer leaflet of apoptotic cells.
In 1998, Blankenberg et al. were the first group to demonstrate the ability to detect apoptosis in vivo using radiolabeled Annexin V. Using 99mTc-labelled Annexin V they demonstrated the ability to detect apoptosis in three different mouse models of apoptosis. Imaging showed a two- to six-fold increase in the uptake of radiolabelled Annexin V at the sites of apoptosis in all three models. The most impressive results were seen in cyclophosphamide treated murine B-cell lymphomas. Twenty hours after the injection of radiolabelled Annexin V cyclophosphamide treated tumours displayed 3-4 times higher uptake than controls (Blankenberg et al., 1998).
In 2002, Belhocine et al. conducted one of the first human studies using radiolabelled Annexin V to predict tumour response to chemotherapy in individuals with cancer. Many chemotherapeutic drugs work by inducing apoptosis in target tumours; however, some tumours can show greater resistance to chemotherapy than others. In this study, the authors predicted that 99mTc-labelled Annexin V uptake in tumors, indicative of apoptosis, would correlate to tumor response to treatment. Fifteen patients presenting with either lung cancer, lymphoma or breast cancer were administered 99mTc-labelled
Annexin V before and within 3 days of receiving their first dose of chemotherapy. FDG and PET scans were used to evaluate tumor response 3 months after chemotherapy treatment. For all individuals in the study, no agent uptake was observed in the tumor during the first scan before receiving chemotherapy. Following chemotherapy, the 7 patients who showed 99mTc labeled Annexin V uptake at the tumor site, had complete (n = 4) or partial response (n = 3). In contrast, 6 of the 8 patients who did not show
and suggests its ability to predict tumor outcome in response to treatment. This study also demonstrated the safety of using 99mTc-labelled Annexin V in humans. While this study showed some success, the target-to-background ratio of the agent was low. The liver and kidneys demonstrated much higher uptake of 99mTc-labelled Annexin V compared to the uptake seen in the tumor (Belhocine et al., 2002).
Radiolabelled Annexin V has also been used to image stroke in rodents and humans (Blankenberg et al., 2006; Lorberboym et al., 2006). Lorberboym et al. evaluated the potential of radiolabelled Annexin V to image ischemic injury in human patients with acute cerebral stroke. Compared to control patients, eight out of twelve stroke patients displayed abnormal uptake of 99mTc-labelled Annexin V in the infarct regions. The integrity of the BBB was also evaluated using 99mTc labeled diethylene-triamine-pentaacetate (DTPA). All of the patients who underwent DTPA imaging showed
1.4.3.2
Labeled Caspase-3 Substrates
Although caspase imaging probes have great potential, there has been limitedwork done in animals and no human studies. Bullok et al. reported the ability of a
caspase-activatable probe to detect parasite-induced apoptosis in human colon xenograft and liver abscess mouse models. Their caspase-3 probe consisted of a cell penetrating peptide conjugated to a caspase-3 cleavage site that was flanked by a fluorophore-quencher pair. Cleavage by caspase-3 resulted in release of the quencher and emergence of fluorescent signal (Bullok et al., 2007). Although their caspase-activatable probe was able to image apoptosis in mice, fluorescence imaging is not possible in deeper tissues, limiting the clinical application of this probe.
1.5 Rationale and Hypothesis
Although important in normal development, apoptosis can contribute to
neurodegeneration and has been associated with a number of neurodegenerative
disorders, including AD, PD, and HD (Mattson, 2000). As Canada’s population ages and the incidence of neurodegenerative disorders rapidly increases, there is a critical need to improve the early detection and diagnosis of neurodegenerative disease (Mayeux, 2003). A contrast agent capable of detecting apoptosis in vivo may prove to be very useful in the early diagnosis of neurodegenerative disease. The ability to detect neurodegeneration before the onset of symptoms would significantly impact treatment therapies and help alleviate the economic burden of the disease.
allows the contrast agent to cross cell membranes and the blood brain barrier in both directions. In cells undergoing apoptosis, activated caspase-3 will cleave the agent at the caspase-3 cleavage site, releasing the cell-penetrating peptide and trapping the imaging probes inside the cell. One single activated-caspase-3 protein can cleave multiple contrast agent molecules, leading to the accumulation of the contrast agent inside the cell or blood brain barrier, and resulting in the amplification of observed signal.
We hypothesize that a contrast agent targeted toward the detection of caspase-3 can be used to image apoptosis in vivo. The objective of this project was to test the ability of the contrast agent to label apoptotic cells in culture and explore its potential to detect
apoptosis in vivo.
Chapter 2
2
Methods
All animal studies were conducted in accordance with the guidelines of the
Subcommittee on Animal Care at the University of Western Ontario, and conformed to the Canadian Council on Animal Care guide for the care and use of laboratory animals.
2.1 Contrast Agent Synthesis
The contrast agent,Gd3+-DOTA-Cas-3, was synthesized and characterized by high resolution electron spray ionization mass spectrometry in a similar manner as described by Suchy et al. To synthesize Gd3+-DOTA-Cas-3 the peptide sequence for the caspase-3
cleavage site (DEVD) was used instead of the peptide sequence for the cathepsin-D cleavage site. Purified Gd3+-DOTA-Cas-3 was dissolved in water (1mM stock), aliquoted, and stored at -20°C.
2.2 Fluorescence Microscopy
All images were acquired using a Zeiss Axiovert 100 inverted fluorescence microscope and AxioCam HRm camera (Carl Zeiss, Germany). A Zeiss 40× 0.6 numerical aperture dry lens was used to acquire images for experiments analyzing contrast agent uptake in individual cells and to characterize apoptosis. A Zeiss 20× 0.5 numerical aperture dry lens was used to acquire images for experiments analyzing contrast agent uptake in populations of cells. A Zeiss 10× 0.3 numerical aperture dry lens was used to acquire images of tyrosine hydroxylase staining in the substantia nigra (SN). A Zeiss 63× 1.4 numerical aperture oil immersion lens was used to image contrast agent uptake in the SN.
excitation band pass filter set and 575-640 nm emission band pass filter set. DAB staining was visualized using transmitted light.
2.3 N2A Cell Culture
The neuro-2A (N2A) mouse neuroblastoma cell line was purchased from ATCC (Manassas, Virginia). Cells were maintained in minimal essential media (MEM; Invitrogen, Grand Island, NY) supplemented with 10% heat-inactivated fetal bovine serum (Hyclone, Logan, UT) and 100 µg/mL penicillin-streptomycin (Invitrogen, Grand Island, NY). Cells were seeded in 4-well plates (Thermo Scientific, Mississauga, ON) at a concentration of 1 × 10⁵ N2A cells per well. Cells were grown at 37°C in an atmosphere of 5% CO2. Cells were treated with camptothecin (CPT), 1-methyl-4-phenylpyridinium
(MPP+), tunicamycin and staurosporine 2-3 days after plating (all from Sigma Aldrich,
Oakville, ON). Drugs were diluted in culture media immediately before adding to
cultures. Stock solutions of CPT, tunicamycin and staurosporine were stored at -20°C and fresh MPP+ stock was made before each addition to cell media. Control cells were
incubated in regular culture medium without the addition of a pro-apoptotic stimulus. Following treatment, cells were fixed and stained with an antibody against cleaved caspase-3 (1:400 dilution; Cell Signaling, Beverly, MA) and counterstained with DAPI (4’,6-Diamidino-2-Phenylindole; Invitrogen, Grand Island, NY). The primary antibody was detected using an Alexafluor 546 secondary antibody (Invitrogen, Grand Island, NY).
2.4 Primary Neuronal Culture
Cortical neurons were dissociated and prepared from E15.5 mouse embryos as previously described by Fortin et al.. Cells were plated onto poly-L-ornithine-coated (Sigma
(Invitrogen, Grand Island, NY) at 37°C in 5% CO2. After 3 days, one-half of the media
was removed and replaced with fresh culture media. Cells were used for experiments on days 4-7 of culture.
To determine the proportion of cells in primary culture that were neurons, cells were fixed and stained with an antibody against NeuN (1:200; Abcam, Toronto, ON) and counterstained with DAPI (Invitrogen, Grand Island, NY). The primary antibody was detected using an Alexafluor 546 secondary antibody (Invitrogen, Grand Island, NY). The proportion of NeuN positive cells as a percentage of total cell number was determined.
2.5 Induction of Apoptosis in Primary Cortical Neurons
Cortical neurons were seeded in confocal dishes and treated with 10 µM CPT (Sigma Aldrich, Oakville, ON) for 24 hours to induce apoptosis. Control neurons remained in regular culture medium for 24 hours. Following treatment, cells were fixed and stained with antibodies against cleaved caspase-3 (1:400 dilution; Cell Signaling, Beverly, MA) and counterstained with DAPI (Invitrogen, Grand Island, NY). The primary antibody was detected using an Alexafluor 546 secondary antibody (Invitrogen, Grand Island NY).
2.6 Optimization of Contrast Agent Concentration and
Exposure Time
Cortical neurons seeded in 4-well plates were treated with 10 µM CPT (Sigma Aldrich, Oakville, ON) for 24 hours to induce apoptosis. Cells were then exposed to different concentrations of the contrast agent for varying lengths of time. Before imaging, cells were washed 3 times with warm Hanks buffered saline solution (HBSS; Invitrogen, Grand Island, NY).
2.7 Contrast Agent Toxicity
neurons seeded in 4-well plates were incubated with 10 µM of the contrast agent for 4, 8, or 24 hours. Control cells were incubated in regular culture media without the addition of contrast agent. At the end of the incubation period, Hoechst 33342 (1.62 µM; Sigma Aldrich, Oakville, ON) and PI (500 nM; Sigma Aldrich, Oakville, ON) were added directly to the culture medium and cells were not washed before imaging. Cell viability was assessed using Image J software to determine the proportion of nuclei that exhibited PI negative staining. A minimum of 800 cells was scored for each treatment and the data represent the mean and standard error from three different experiments.
2.8 Cellular Uptake and Retention of Contrast Agent in
Apoptotic Neurons
Primary neurons were seeded in confocal dishes and treated with either CPT or MPP+ (both from Sigma Aldrich, Oakville, ON) at 10 µM concentration for 24 h. Stock solutions of CPT and MPP+ were diluted in culture media immediately before adding to cultures. CPT stock was stored at -20°C and fresh MPP+ stock was made before each addition to cell media. Control cells remained in regular culture medium for 24 hours. For inhibitor studies, 50 µM of the caspase-3 inhibitor Z-DEVD-FMK (EMD Millipore, Etobicoke, ON) was added to culture media 1 hour prior to treatment with either CPT or MPP+.
Neurons were incubated with 10 µM contrast agent for 4 h prior to imaging (20 h after adding CPT or MPP+). The contrast agent was diluted in culture media before adding to
cultures. Before imaging, neurons were washed three times with warm HBSS (Invitrogen, Grand Island, NY) to remove free-floating contrast agent and reduce background. Cells were subsequently stained with Hoechst 33342 (1.62 µM; Sigma Aldrich, Oakville, ON) and PI (500 nM; Sigma Aldrich, Oakville, ON) and imaged live.
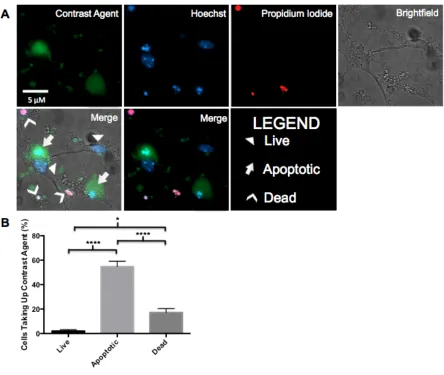
apoptotic and dead cells were defined by examining nuclear morphology in Hoechst 33342 and PI stained cells. Cells exhibiting pyknotic and/or fragmented nuclei with negative PI staining were characterized as apoptotic. Cells displaying healthy diffuse nuclei with negative PI staining were characterized as healthy. Cells with positive PI staining (regardless of nuclear morphology) were considered dead. The proportion of cells retaining contrast agent within each population of apoptotic, living or dead cells was quantified by analyzing the number of cells in each population that retained the contrast agent and appeared bright green. A minimum of 200 cells was characterized as apoptotic, living or dead in each experiment and assessed for contrast agent uptake. The data
represent the mean and standard error of the percentage of neurons retaining the contrast agent within each population from four independent experiments.
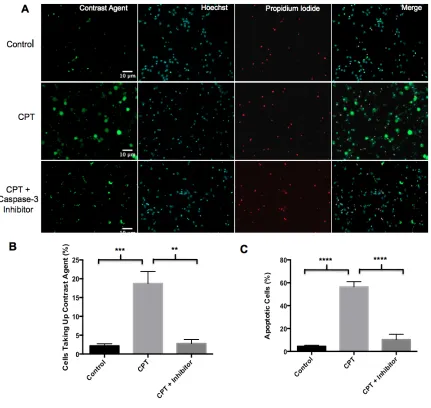
To compare contrast agent uptake between control neurons, neurons induced to undergo apoptosis and neurons induced to undergo apoptosis in the presence of a caspase-3 inhibitor, images were acquired using the 20× objective lens. Image J was used to count the total number of nuclei in each image field. The proportion of cells that retained the contrast agent was quantified by counting the number of cells that appeared bright green and dividing by the total number of nuclei. A minimum of 500 cells was counted for each treatment and the data represent the mean and standard error from three different
experiments. To evaluate apoptosis in each condition, images were acquired using the 40× objective lens. The proportion of nuclei displaying negative PI staining and typical apoptotic nuclear morphology was scored. A minimum of 160 cells was evaluated for each treatment and the data represent the mean and standard error from three different experiments.
2.9 Cellular Uptake and Retention of Contrast Agent in
Necrotic Neurons
Immediately before imaging, cells were washed three times with warm HBSS
(Invitrogen, Grand Island, NY) and subsequently stained with Hoechst 33342 (1.62 µM; Sigma Aldrich, Oakville, ON) and PI (500 nM; Sigma Aldrich, Oakville, ON). Image J was used to count the total number of nuclei and PI positive nuclei in each image field. The proportion of cells that retained the contrast agent was quantified by counting the number of cells that appeared bright green and dividing by the total number of nuclei. A minimum of 650 cells was counted for each treatment and the data represent the mean and standard error from four different experiments.
2.10 1-Methyl-4-Phenyl-1,2,3,6-Tetrahydropyridine Injections
Ten to twelve week old male C57Bl/6 mice weighing 25-30 g were used for the MPTP injections (Charles River, Wilmington, MA). Mice were habituated for 7 days prior to starting injections. Animals were housed 2-4 per cage in a temperature-controlled room in a 12 h light/12 h dark cycle with free access to food and water.
MPTP-HCl (Sigma Aldrich, Oakville, ON) was dissolved in sterile 0.9% NaCl.
Experimental mice received intraperitoneal (IP) injections of 30 mg/kg MPTP once per day for five consecutive days. Control mice were injected IP with 0.9% NaCl. Three days after the final MPTP injection mice were injected with the contrast agent.
Mice were anesthetized with 4% isofluorane and oxygen. A tail-vein catheter was established and a saline flush was performed to ensure that the catheter was accurately placed. Mice were injected intraveneously with 80 µL of 1 mM contrast agent. One mouse from each the MPTP-treated and control group was not injected with contrast agent to allow for comparison of background auto-fluorescence.
paraformaldehyde (PFA; Sigma Aldrich, Oakville, ON). The brains were dissected and fixed by immersion in PBS/4% paraformaldehyde for 24 h at 4°C.
2.11 Histological Analysis of MPTP-Treated and Control
Mice
Following fixation, mouse brains were paraffin embedded. A Microm HM 335 E Microtome (Thermo Scientific, Mississauga, ON) was used to coronally cut through the SN at a thickness of 5 µM. Sections were mounted on glass slides and stained with an antibody against tyrosine hydroxylase (1:500; Abcam, Toronto, ON). Primary antibody was detected with a secondary antibody conjugated to horseradish peroxidase and developed with a diaminobenzidine (DAB) stain using Vectastain ABC kit (Vectorlabs). To detect DNA fragmentation, slides were stained with the Click-iT Alexa Fluor 594 TUNEL assay (Invitrogen; Grand Island, NY) according to manufacturers instructions. To analyze contrast agent distribution, slides were counterstained with hematoxylin.
2.12 Statistical Analysis
Data are presented as the mean ± SEM with n values representing the number of independent cell cultures or individual animals. For cellular experiments, each n value was obtained by averaging at least 8 images taken from random fields in each
Chapter 3
3
Results
3.1 N2A Cells Do Not Easily Undergo Chemical-Induced
Apoptosis
To evaluate the ability of our contrast agent to label apoptotic cells we needed a method for inducing apoptotic cell death in culture. N2A cells are a mouse neuroblastoma cell line that demonstrate neuronal morphology (Tremblay et al., 2010). It has previously been shown that it is possible to induce apoptosis in N2A cells using a variety pro-apoptotic drugs (Sheehan et al., 1997; Ito et al., 2004; Li et al., 2007; Galehdar et al., 2010; Wang et al., 2010). Therefore, we treated N2A cells with different pro-apoptotic drugs and evaluated their ability to induce apoptosis. After treatment with the drugs, cells were fixed and stained for activated caspase-3 and counterstained with 4’,6-Diamidino-2-Phenylindole (DAPI). Apoptosis was assessed based on nuclear morphology and caspase-3 activation.
3.2 Mouse Primary Cortical Neurons Undergo
Chemical-Induced Apoptosis
In the previous study, the N2A neuroblastoma cell line displayed significant resistance to regular apoptotic stimuli. In order to develop a model for inducing apoptosis in culture we turned to mouse primary cortical neurons. Primary neurons are known to be more sensitive to cell death and apoptotic stimuli than cell lines, making them a better candidate to model apoptosis. Figure 5 displays a representative image depicting NeuN immunostaining in the primary neuronal culture. Immunostaining for NeuN demonstrated that > 95% of the nuclei counted in the primary culture stained positive for NeuN,
confirming that the majority of cells in primary culture were neurons.
When treated with 10 µM CPT for 24 hours, mouse primary cortical neurons appeared to readily undergo apoptosis. Immunocytochemistry with an antibody against activated caspase-3 demonstrated widespread caspase-3 activation throughout CPT-treated neurons. The nuclear stain DAPI revealed many neurons with pyknotic and fragmented nuclei, typical of apoptosis (Fig 6A). This was in contrast to control neurons that displayed healthy, diffuse nuclear staining and minimal caspase-3 activation (Fig. 6A). Additionally, high power images (40×) revealed that caspase-3 activation was specific to neurons that displayed either pyknotic or fragmented nuclei (Fig. 6B). This confirms our ability to assess apoptosis and caspase-3 activation based on nuclear morphology.
3.3 Contrast Agent Optimization
The purpose of the next experiment was to determine the optimal contrast agent
Figure 5. NeuN immunostaining in mouse primary cortical neuron culture. Primary corticalneurons were fixed and immunostained for NeuN and counterstained with DAPI. More than 95% of nuclei stained positive for NeuN, demonstrating that the majority of cells in culture were neurons.
Figure 7 displays representative images of contrast agent uptake at each concentration and at each length of time. All images were taken using the same settings and intensity. Agent uptake appeared to occur in a concentration dependent manner and increasing the incubation period with the contrast agent increased the number of cells that retained the agent. Increasing the contrast agent concentration beyond 10 µM greatly increased the amount of background fluorescence. For this reason it was determined that exposing neurons to 10 µM of the contrast agent for 4 hours were the optimal conditions for detecting apoptosis.