Role of the excitation energy of the compound nucleus in binary
decay processes
H. Pa¸sca1,2,, A.V. Andreev1, G.G. Adamian1, and N.V. Antonenko1
1Joint Institute for Nuclear Research, 141980 Dubna, Russian Federation
2“Babe¸s-Bolyai” University, Faculty of Physics, 400084 Cluj-Napoca, Romania
Abstract.Employing the improved scission-point model, the isotopic and excitation en-ergy trends of the charge distribution of fission fragments are studied in fission of even-even Th isotopes at low and high excitation energies.
1 Introduction
As known, with increasing neutron number of fissioning even-even Th isotopes the transition from one-peaked to two-peaked charge distribution of fission fragments occurs through transient three-peaked shape in which the symmetric and asymmetric components of the distribution have almost equal weights [1]. The general opinion is that the competition between symmetric and asymmetric fission modes is related to the deformed shells. However, in the case of high-energy neutron-induced fission of238U [2], the experimental data show that the mass distribution maintains two-peaked shape
even at neutron energies of 50–60 MeV. At these excitation energies, the shell effects are expected to
be washed out, and the nucleus is supposedly left with a dominant symmetric mode, that is contrary to the experiments. The experimental data on fission of180Hg [3] also suggest that the asymmetric mass
distribution can not be anticipated only from the microscopic effects in the fragments. Our aim is
to explain the transformation of the charge distribution with neutron number in the electro-magnetic-induced fission (Eγ=11 MeV) of Th isotopes and to predict the charge distributions at large excitation energies. The fission is described within the improved scission-point model [4]. The most important ingredient of the model is the potential energy of system as a function of charge (mass) asymmetry, deformations of the fission fragments, and internuclear distance. The knowledge of the deformations of nascent fragments at scission point is also crucial.
2 Statistical scission-point model
The statistical scission-point model relies on the assumption that the statistical equilibrium is estab-lished at scission where the observable characteristics of fission process are formed. At the scis-sion point the decaying system is modeled by two uniformly charged, nearly touching coaxial el-lipsoids - the fission fragments forming the dinuclear system (DNS). By taking into consideration the volume conservation, the system is completely defined by the mass and charge numbers (Ai,Zi)
of the fragments, deformation parameters of fragments, βi, and interfragment distance R. Here,
the index i designates the light or heavy fragment of the DNS (i = L,H). The potential energy
U = BL+BH+V of the DNS consists of the binding energies Biof the fragments and the mutual
fragment-fragment interaction potentialV[4]. The binding energyBi =UiLD+δUishellof each
frag-ment consists of the excitation-energy-dependent liquid-drop energyULD
i and deformation-dependent
shell-correction termδUishell calculated with the two-center shell model. The damping of the shell corrections with excitation energy is taken into account. The interaction potential V = VN +VC
consists of the Coulomb interaction potential VC of the two uniformly charged ellipsoids and
nu-clear interaction potential VN in the double-folding form [4]. The interaction potential presents
an inner potential pocket and external barrier which prevents the system from decay. The barrier,
Bq f(Ai,Zi, βi)=V(Ai,Zi, βi,Rb)−V(Ai,Zi, βi,Rm), calculated as the difference of the interaction
po-tentials at the top of the external barrier [R=Rb(Ai,Zi, βi)] and at the bottom of the potential pocket
[R=Rm(Ai,Zi, βi)], prevents the decay of the DNS inR. The heightBq f of barrier has also an impact
on the yields. With increasing elongation and decreasing charge (mass) asymmetry the value ofBq f
decreases, the system becomes more unstable and decays. Because the dynamical treatment is not explicitly performed here, we simulate the dynamical effects by restricting the minimum value of the
height Bq f of the decay barrier. In the calculations, we take into consideration only those
configu-rations for which Bq f is larger than∼1 MeV. This condition restricts the highly deformed unstable
configurations in the (βL,βH) plane.
Because the thermal equilibrium is assumed at the scission point, the excitation energy
E∗(Ai,Zi, βi,Rm)=E∗
CN+UCN(A,Z, β)−U(Ai,Zi, βi,Rm)at scission is calculated as the initial
ex-citation energy of the fissioning nucleusE∗
CN plus the difference between the potential energies of
fissioning compound nucleusUCN(A,Z, β) and of the system at the scission pointU(Ai,Zi, βi,Rm)
[4]. Note that the value ofRmis taken directly from the interaction potential and it is
deformation-dependent, which allows us to have a precise definition of the scission configuration and excitation energy. The relative formation probability of the DNS with particular masses, charges and deforma-tions of the fragments is calculated as [4]:
w(Ai,Zi, βi,E∗)=N0exp
−U(Ai,Zi, βi,Rm)T+Bq f(Ai,Zi, βi)
, (1)
whereN0is the normalization factor. In Eq. (1), the temperature is calculated asT = √E∗/a, where
a = (AL+AH)/12 MeV−1 is the level density parameter, which seems to be a good approximation
for the systems studied here [4]. Note that in the literature various values foraare used (e.g. a =
(AL+AH)/12 toa=(AL+AH)/8). In our calculations, a single value of the temperatureis used at the
global potential minimum ofUbefore the shell damping. Variations of the level density parameter in this work lead to minute changes in the results.
In order to obtain the mass-charge distributionY(Ai,Zi,E∗) of fission fragments, one should
in-tegrate (1) over βL and βH. For the calculations of mass and charge distributions, the following
expressions are used:
Y(Ai,E∗)=
ZiY(Ai,Zi,E∗)
Zi,AiY(Ai,Zi,E∗)
,Y(Zi,E∗)=
AiY(Ai,Zi,E∗)
Zi,AiY(Ai,Zi,E∗)
. (2)
3 Results and discussions
In Fig. 1 the calculated mass distributions resulting from the spontaneous fission of even-even nu-clei Cf and Fm with A = 250−256 are depicted. The results seem to be in good agreement with
of the fragments, deformation parameters of fragments, βi, and interfragment distance R. Here,
the index i designates the light or heavy fragment of the DNS (i = L,H). The potential energy
U = BL+BH+V of the DNS consists of the binding energies Biof the fragments and the mutual
fragment-fragment interaction potentialV[4]. The binding energyBi =UiLD+δUishellof each
frag-ment consists of the excitation-energy-dependent liquid-drop energyULD
i and deformation-dependent
shell-correction termδUishellcalculated with the two-center shell model. The damping of the shell corrections with excitation energy is taken into account. The interaction potential V = VN +VC
consists of the Coulomb interaction potential VC of the two uniformly charged ellipsoids and
nu-clear interaction potential VN in the double-folding form [4]. The interaction potential presents
an inner potential pocket and external barrier which prevents the system from decay. The barrier,
Bq f(Ai,Zi, βi)=V(Ai,Zi, βi,Rb)−V(Ai,Zi, βi,Rm), calculated as the difference of the interaction
po-tentials at the top of the external barrier [R=Rb(Ai,Zi, βi)] and at the bottom of the potential pocket
[R=Rm(Ai,Zi, βi)], prevents the decay of the DNS inR. The heightBq f of barrier has also an impact
on the yields. With increasing elongation and decreasing charge (mass) asymmetry the value ofBq f
decreases, the system becomes more unstable and decays. Because the dynamical treatment is not explicitly performed here, we simulate the dynamical effects by restricting the minimum value of the
height Bq f of the decay barrier. In the calculations, we take into consideration only those
configu-rations for which Bq f is larger than∼1 MeV. This condition restricts the highly deformed unstable
configurations in the (βL,βH) plane.
Because the thermal equilibrium is assumed at the scission point, the excitation energy
E∗(Ai,Zi, βi,Rm) =E∗
CN+UCN(A,Z, β)−U(Ai,Zi, βi,Rm)at scission is calculated as the initial
ex-citation energy of the fissioning nucleusE∗
CN plus the difference between the potential energies of
fissioning compound nucleus UCN(A,Z, β) and of the system at the scission pointU(Ai,Zi, βi,Rm)
[4]. Note that the value ofRmis taken directly from the interaction potential and it is
deformation-dependent, which allows us to have a precise definition of the scission configuration and excitation energy. The relative formation probability of the DNS with particular masses, charges and deforma-tions of the fragments is calculated as [4]:
w(Ai,Zi, βi,E∗)=N0exp
−U(Ai,Zi, βi,Rm)T+Bq f(Ai,Zi, βi)
, (1)
whereN0is the normalization factor. In Eq. (1), the temperature is calculated asT = √E∗/a, where
a = (AL+AH)/12 MeV−1 is the level density parameter, which seems to be a good approximation
for the systems studied here [4]. Note that in the literature various values fora are used (e.g. a =
(AL+AH)/12 toa=(AL+AH)/8). In our calculations, a single value of the temperatureis used at the
global potential minimum ofUbefore the shell damping. Variations of the level density parameter in this work lead to minute changes in the results.
In order to obtain the mass-charge distributionY(Ai,Zi,E∗) of fission fragments, one should
in-tegrate (1) over βL and βH. For the calculations of mass and charge distributions, the following
expressions are used:
Y(Ai,E∗)=
ZiY(Ai,Zi,E∗)
Zi,AiY(Ai,Zi,E∗)
,Y(Zi,E∗)=
AiY(Ai,Zi,E∗)
Zi,AiY(Ai,Zi,E∗)
. (2)
3 Results and discussions
In Fig. 1 the calculated mass distributions resulting from the spontaneous fission of even-even nu-clei Cf and Fm with A = 250−256 are depicted. The results seem to be in good agreement with
the experimental data compiled and shown schematically in Fig. 8 of Ref. [5]. The calculated
Y(%) 0 0.02 0.04 0.06 0.08 0.1 0.12 A
100 120 140 160
256Fm Y(%) 0 0.02 0.04 0.06 0.08 0.1 0.12 A
100 120 140 160
250Fm Y(%) 0 0.02 0.04 0.06 0.08 0.1 0.12 A
100 120 140 160
256Cf Y(%) 0 0.02 0.04 0.06 0.08 0.1 0.12 A
100 120 140 160
254Cf Y(%) 0 0.02 0.04 0.06 0.08 0.1 0.12 A
100 120 140 160
254Fm Y(%) 0 0.02 0.04 0.06 0.08 0.1 0.12 A
100 120 140 160
252Fm Y(%) 0 0.02 0.04 0.06 0.08 0.1 0.12 A
100 120 140 160
252Cf Y(%) 0 0.02 0.04 0.06 0.08 0.1 0.12 A
100 120 140 160
250Cf
Figure 1.The calculated mass distributions in the spontaneous fission of the indicated even-even actinides.
Y (%) 0 8 16 24 204Rn Y (%) 0 8 16 0 8 16 206Rn 230U 0 8
16 232U
234U Y (%) 0 8 16 24 Z
30 40 50 60 208Rn
0 8 16
Z
30 40 50 60
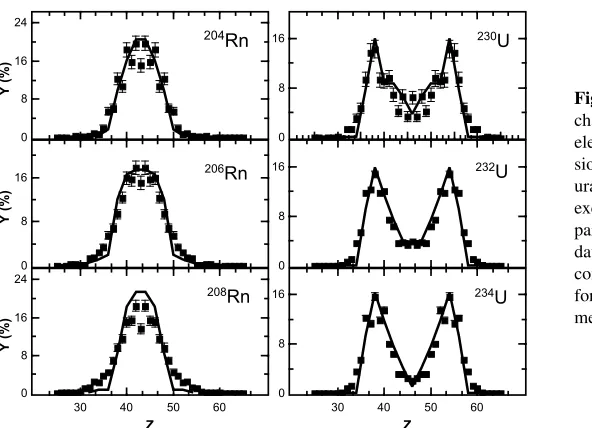
Figure 2. The calculated charge distributions (lines) for electro-magnetic-induced fis-sion of the indicated radon and uranium isotopes at 11 MeV excitation energy are com-pared with the experimental data [1] (symbols). The lines connect the calculated points for even-even fission frag-ments.
charge distributions resulting from the electro-magnetic-induced (Eγ = 11 MeV) fission of even-even204,206,208Rn,230,232,234U, and222,224,226,228Th nuclei are compared with the experimental data of
Ref. [1] in Figs. 2 and 3. For the isotopes of Rn (Fig. 2) and222Th (Fig. 3), the fragment charge
distributions are clearly symmetric, with a single prominent peak aroundZ/2, while the charge distri-butions of fissioning nuclei230,232,234U (Fig. 2) and228Th (Fig. 3) have two distinct asymmetric peaks.
The fission of the226Th nucleus shows a three-peaked distribution (Fig. 3). As seen, our model is
by studying the driving potential:
U(Zi)=
Ai
dβLdβHU(Ai,Zi, βi,Rm)w(Ai,Zi, βi,E∗)
Ai
dβLdβHw(Ai,Zi, βi,E∗)
(3)
averaged over the mass numberAi and deformationsβL,H. In the case of 222Th isotope the driving
potentialU(Zi)shows a deep minimum atZ/2=45. For the224Th nucleus,U(Zi)starts displaying
the formation of the second minimum around Kr–Sr, while for the226Th isotope, the second minimum
becomes almost as deep as the central (symmetric) one. Even though that the values of U(ZL =
36−38)is slightly higher thanU(ZL =44), the corresponding yields are the same. This is easily
explained by the fact that in (βL, βH) plane, the minima for Kr–Sr are wider than those for Ru–
Pd [4]. For the228Th nucleus, the asymmetric minima become deeper, facilitating the asymmetric
fragmentations, but the central minimum still remains.
To understand the conditions under which the mass-asymmetric minimum appears in the driving potential, we analyze all components of the driving potential: the liquid-drop energyULD(Z
i) =
ULD
L +UHLD, the interaction potential V(Zi) = VC+VN, and the shell-correction energy
δUshell(Z
i)=δULshell+δUHshell(Fig. 4).
Figure 3. Left side: the same as in Fig. 2, but for Th isotopes. Right side: the calculated components of the driving potentialsU(Zi)at 11 MeV (solid black lines) excitation energy of the initial compound nucleus for
indicated fissioning thorium isotopes. The liquid-drop energyULD(dashed blue lines), the nucleus-nucleus
interaction potentialV(dotted lines), and the shell-correction energyδUshell(dashed red lines) are normalized to the zero energy atZL=44. The values ofδUshellandULD+Vare scaled by a factor of 5, for visibility.
The liquid-drop energy increases globally when the charge (mass) number deviates fromZCN/2
(ACN/2). The interaction potential has the opposite global behavior. These two components depend
on deformations of the DNS nuclei that create local minima in theULD(Z
i)andV(Zi). The larger
deformations result in the smaller interaction energy and the larger liquid-drop energy. The position of minimum in the (βL,βH) plane depends on the shell corrections. For the nuclei withZL=40−44, the
shell effects are relatively weak becauseZL(NL) is midway between proton (neutron) shell closures.
This leads to an almost pure liquid drop behavior of the scission configuration and larger deformations of the fragments. Thus, the asymmetric minimum in the driving potential appears due to the interplay between the liquid-drop energy and the nucleus-nucleus interaction potential. The shell effects also
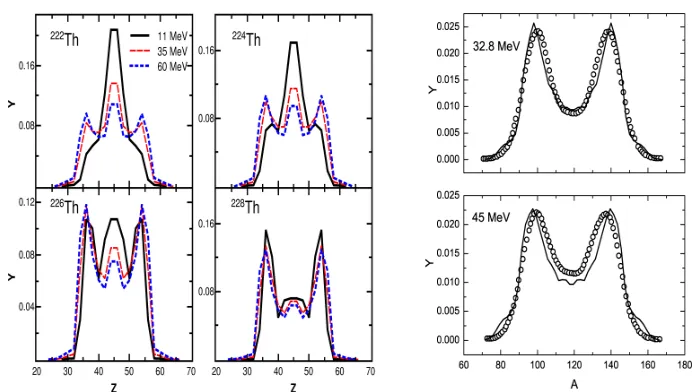
Figure 4.Left side: the calculated charge distributions for222,224,226,228Th isotopes at 11, 35, and 60 MeV exci-tation energies of the initial compound nucleus. Right side: the calculated mass distribution resulting from the 238U(n,f) reaction at the indicated energies. The experimental data are from [2].
indirectly affect (through the deformations of nuclei) the appearance of the asymmetric minimum.
The direct role of the shell effects is expressed by changing the position and depth of this minimum
in the driving potential. For example, for226Th, atZL=34, 36, and 38 the DNS nuclei are near magic
nuclei withNL =50 andNH =82. This implies high values of their stiffness parameter and so the
minimum in the (βL,βH) plane is situated at small deformations. As a result, atZL = 34−38 the
Vdecreases faster than theULDincreases. AtZ
L<34 the increase of theULDovercompensates
the decrease of theV, and, correspondingly, the asymmetric minimum appears atZL = 34. The
shell corrections cause the shift of the minimum fromZL =34 toZL =36 and make this minimum
deeper in the driving potential (Fig. 3). It is interesting to note that only in the cases of222,224Th the
shell-correction energyδUshell(Zi)diminishes the asymmetric minimum of the liquid-drop energy
plus the interaction potential in Fig. 3. With increasingN−Zof the fissioning nucleus the liquid-drop energy/interaction potential increases slower/faster with charge asymmetry. This is the reason of the
appearance of the pronounced asymmetric minimum in the cases of226,228Th.
The predicted charge distributions of fissioning nuclei222,224,226,228Th at large excitation energies
are given in the left part of Fig. 4. The calculated mass distributions of fissioning239U (lines) at
two excitation energies (mentioned in the figure legends), describing the experimental data [2] (open circles) are plotted in the right part of Fig. 4. The distributions widens with increasing excitation energy for all nuclei. For 222,224Th isotopes, the central peak recedes, and two asymmetric peaks
appear suppressing the symmetric mode. The charge distributions of226,228Th at higher excitation
energies (Fig. 4) emphasize the asymmetric aspect of the distribution, making the symmetric peak smaller and narrower, and the asymmetric maxima wider and taller. This is easily explained by the fact that with higher excitation energy the previously unaccessible asymmetric configurations are involved. The average driving potentials match the yields at 35 and 60 MeV excitation energy. At 60 MeV excitation energyU(Zi)has asymmetric minima resulting in larger yields of asymmetric
mode. The excitation energy reduces the shell effects that causes a widening of the minima in the
deformation space (βL,βH) and a migration of the minima in the potential-energy surface. In the case
faster than for the symmetric fragmentations. However, the influence of the excitation energy is not so dramatic. The deformationsβL(ZL) andβH(ZL) of fragments, corresponding to the asymmetric
minimum of the driving potential, do not change strongly, especially for the configurations with magic or close to magic nuclei Se–Kr [NL=50 andNH=82]. So, the deformations of the light nuclei with
ZL =34−36 remain to be smaller than the deformations of the DNS nuclei withZL =38−44. As a
result, theV(Zi)decreases faster than theULD(Zi)increases fromZL=38 toZL=34. AtZL<34 their
behaviors are opposite, and the minimum atZ =34 is produced. So, the asymmetric minimum in the
driving potential is produced due to the deformation effect. With increasing excitation energy of the
fissioning nucleus, the liquid-drop energyULD(Z
i)increases slower with charge asymmetry. This
leads to the pronounced asymmetric minimum in the cases of222,224Th.
4 Conclusions
In this paper it is shown that the improved scission-point model can be a suited tool for the description of the symmetric and asymmetric charge (mass) fragmentations resulting from the low-energy fission of different nuclei. The transition from a symmetric to an asymmetric fragmentation of Th nuclei
is attributed to the interplay between the competing liquid-drop surface energy and the interaction energy in the driving potential of these systems at the scission point. This interplay depends on the excitation energy and the isospin of the fissioning nucleus. The shell effects affect indirectly through
the deformations of nuclei on the appearance of the asymmetric minimum. The three-equal-peaked charge distribution is not the specific property of the226Th nucleus. The shape of the charge
distri-bution depends on the excitation energy. For the fissioning nucleus226Th at high excitation energies,
the charge distributions are well asymmetric but not the three-equal-peaked ones. The experimental verification of this unexpected effect is desirable.
References
[1] K.-H. Schmidt et al., Nucl. Phys. A665, 221 (2000) [2] I.V. Ryzhov et al., Phys. Rev. C83, 054603 (2011)
[3] A.N. Andreyev, M. Huyse, P. Van Duppen, Rev. Mod. Phys.85, 1541 (2013)
[4] H. Pa¸sca, A.V. Andreev, G.G. Adamian, N.V. Antonenko, Phys. Rev. C94, 064614 (2016); Phys. Lett. B760, 800 (2016); Eur. Phys. J. A52, 369 (2016)