Clinical Ophthalmology 2018:12 247–253
Clinical Ophthalmology
Dove
press
submit your manuscript | www.dovepress.com 247
O r i g i n a l r e s e a r C h
open access to scientific and medical research
Open access Full Text article
Long-term progression of visual field defects
and related factors in medically treated normal
tension glaucoma
Keiji Yoshikawa1
Kazunori santo2
hiroko hizaki2
Masayo hashimoto2
1Yoshikawa eye Clinic, Tokyo, 2Medical
affairs, santen Pharmaceutical Co. ltd., Osaka, Japan
Purpose: To analyze factors related to long-term progression of visual field defects (VFD) in patients with normal tension glaucoma (NTG) under medical therapy.
Patients and methods: Clinical data from 622 eyes of 311 primary open-angle glaucoma and NTG patients were collected from April 2006 to March 2016. Of these patients, those with normal intraocular pressure (IOP); glaucomatous VFD judged by Anderson’s criteria; corrected visual acuity $0.7; receiving more than 6 years medical therapy; having undergone $10 visual field tests performed at 6-month intervals using a Humphrey field analyzer (Swedish Interactive Threshold Algorithms standard, C 24-2 program); and having reliability coefficients of visual field testing ,33% and mean deviation (MD) more than -20 decibels in the initial visual field test were included in data analysis. The relationship between MD slope deterioration at final observation and consecutive decreases in MD value during the observation period, as well as clinical characteristics and IOP-related factors, were analyzed.
Results: Of 134 eyes in 134 NTG patients meeting all eligibility criteria, significant MD slope deterioration was observed in 80 eyes (59.7%). MD slope deterioration was significantly associated with consecutive decreases in MD values (Cochran–Armitage trend test: P=0.0000; univariate logistic regression analysis: P,0.0001). While no significant relationship was observed between central corneal thickness, refractive error, or prevalence of disc hemorrhage, consecutive decreases in MD value was significantly related to MD slope deterioration (univari-ate logistic regression analysis: P,0.0001). A reduction of IOP during the follow-up period was significantly related to nondeterioration of the MD slope (multivariate logistic regression analysis: P=0.0020).
Conclusion: In this 6-year observation of NTG patients treated with medical therapy, the occurrence of three or more consecutive decreases in MD value was significantly associated with visual field deterioration. Reduction in IOP was postulated to be contributing in the pre-vention of VFD progression.
Keywords: long-term follow-up, MD slope deterioration, consecutive decrease in MD value, intraocular pressure reduction
Introduction
Standard automated perimetry is typically employed for the assessment of glaucoma-tous visual field defects (VFD), as it provides a quantitative, objective assessment of the severity and progression of VFD.1 In order to manage glaucoma effectively, it is
critical to detect the progression of VFD in its earliest stages; however, this strategy requires frequent repeat testing of visual fields.2,3 We have previously reported that
three or more consecutive decreases in mean deviation (MD) could be an indicator of
Correspondence: Keiji Yoshikawa Yoshikawa eye Clinic, 1-3-1 nakamachi, Machida, Tokyo 194-0021, Japan Tel +81 42 739 0781
Fax +81 42 739 0782 email [email protected]
Journal name: Clinical Ophthalmology Article Designation: Original Research Year: 2018
Volume: 12
Running head verso: Yoshikawa et al
Running head recto: Progression of VFD in NTG DOI: http://dx.doi.org/10.2147/OPTH.S146455
Clinical Ophthalmology downloaded from https://www.dovepress.com/ by 118.70.13.36 on 21-Aug-2020
For personal use only.
Dovepress Yoshikawa et al
the early progression of VFD detected at the final observation in patients with primary open-angle glaucoma (POAG) and normal tension glaucoma (NTG).4
Reductions in intraocular pressure (IOP) may prevent visual field deterioration.4 While decrease in IOP has been
effective in preventing VFD progression in POAG eyes,5–7
a few studies have reported its contribution to preventing long-term VFD progression in NTG eyes.8–11 Accordingly,
we focused on NTG patients who had been treated with medi-cal therapy and followed for at least 6 years and analyzed the relationship between MD slope at final observation and consecutive decreases in MD values over time. We also assessed several factors that may affect VFD progression, such as disc hemorrhage (DH),12 refractive error,9 and central
corneal thickness (CCT),13 which were not investigated in
our previous report.
Patients and methods
study design
This was a retrospective study.
Patients
This study was conducted in compliance with the Declaration of Helsinki and Ethical Guidelines for Medical and Health Research Involving Human Subjects in Japan. All partici-pants provided written informed consent for data collection at the time of their initial visit. Prior to the present study, we gave the opportunity to participants to opt out of the study.
From April 2006 through March 2016, data were col-lected from 311 POAG and NTG patients undergoing treat-ment with topical glaucoma medications. Patients who had undergone routine ophthalmologic examinations during the follow-up period, including measurement of IOP and visual fields, were included in the study. Eligible patients fulfilled all of the following criteria: 1) diagnosis of NTG at baseline; 2) age 20 years or older at the start of the follow-up period; 3) measurement of baseline IOP by Goldmann applanation tonometry before the start of treatment; 4) testing of visual fields with a Humphrey field analyzer (Zeiss-Humphrey, San Leandro, CA, USA) without alteration of the strategy (Swedish Interactive Threshold Algorithms standard) or C 24-2 program; 5) accurately measurable IOP (excluding those with history of keratorefractive surgery, ocular injury, and keratoconus); 6) no history or complication of apparent reti-nal disease; and 7) MD greater than -20 decibels (dB) during visual field testing at the start of the follow-up period.
As parameters of VFD progression, MD slope deteriora-tion and consecutive decreases in MD value were calculated using data from reliable visual field tests for more than 6 years
($10 times at 6-month intervals) meeting the following two criteria: 1) fixation losses ,33%; and 2) false-positive or false-negative ,33%. Patients with a history of glaucoma surgery with a corrected visual acuity of ,0.7 were excluded. This study involved a single eye per patient. If both eyes satisfied all criteria, the eye with a lower MD value was included. There were no restrictions on the type or number of topical glaucoma medications used, and patients of both sexes were enrolled. Ultimately, 134 eyes of 134 patients met all eligibility criteria.
The study protocol was approved by the Institutional Review Board of Kyoyukai RiverSide Clinic in Sap-poro, Japan. This study was registered to UMIN (ID: UMIN000022334) in advance of data collection.
investigations
MD values and MD slope were calculated with the use of HfaFiles Version 5.0 software (Beeline, Tokyo, Japan). As previously reported, “deterioration of MD slope” was defined if the MD slope showed significantly (P,0.05) negative value calculated by the least-square method at the final visual field test.4 “Deterioration of MD value” was defined as a
decrease in the MD value by more than 0.05 dB between two consecutive tests. “Consecutive deterioration” was defined as a successive decrease in MD values between follow-up visits. Similarly, “triple deterioration” and “quadruple deteriora-tion” were defined as three or four consecutive decreases in MD value, respectively. The largest number of consecutive decreases was used for analysis.
In advance of initiation of treatment, IOP was measured four or more times, and baseline IOP was defined as the mean value of all IOP values excluding the first IOP measurement value. For the purposes of this study, “mean IOP” was defined as the mean of all IOP values measured every 3 months dur-ing the follow-up period. IOP fluctuation was calculated as the standard deviation (SD) of the mean follow-up IOP, and the maximum and minimum IOP during the follow-up period were also determined. The difference between baseline IOP and mean IOP was defined as ΔIOP, and the IOP reduction rate was determined by calculating ΔIOP as a percentage of baseline IOP. DH was assessed by ophthalmoscopy (Kowa, Nagoya, Japan) at each visit, and fundus photography (Kowa) was performed every 6 months. CCT was measured with Cirrus HD-OCT 400 Version 5.1 (Zeiss-Humphrey).
statistical analysis
Patients’ identifying information was concealed before data entry. The Cochran–Armitage trend test and logistic regres-sion analysis were performed to analyze the relationship
Clinical Ophthalmology downloaded from https://www.dovepress.com/ by 118.70.13.36 on 21-Aug-2020
Dovepress Progression of VFD in nTg
between MD slope and consecutive decreases in MD value.
Clinical characteristics (such as prevalence of DH) and IOP-related factors were compared between the two groups – patients with deterioration of MD slope and those without deterioration – using the Welch’s t-test, Fisher’s exact test, or the Wilcoxon rank-sum test depending on the scale of the data. The relationship between various factors and the deterioration of MD slope were evaluated with multivariate logistic regression analysis using the presence or absence of MD slope deterioration as the objective variable and the consecutive decrease of MD values or the IOP reduction rate versus baseline as explanatory variables.
Analyses were performed with EZR Version 1.32 soft-ware (Saitama Medical Center, Jichi Medical University, Saitama, Japan), which provides a graphical user interface for R (The R Foundation for Statistical Computing, Vienna, Austria). The level of significance was set at 5% (two-sided). All analyses were inspected by Satista Co. Ltd. (https://www.
satista.jp/medical/).
Results
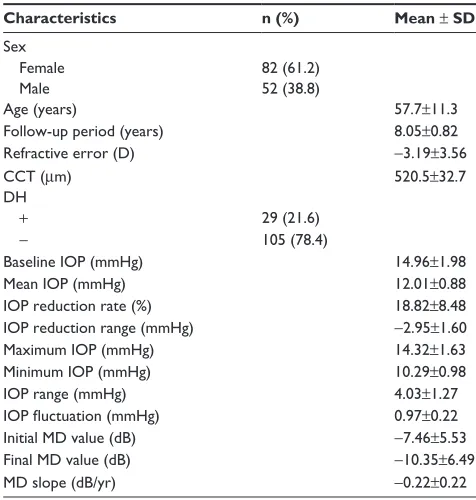
Of 622 eyes of 311 POAG and NTG patients, 134 eyes from 134 NTG patients fulfilled all eligibility criteria, consisting of 82 female and 52 male patients with a mean ± SD age of 57.7±11.3 years (range, 28–80 years; all results are given as mean ± SD [range] unless otherwise indicated). The follow-up period was 8.05±0.82 years (6–12 years). Baseline IOP was 14.96±1.98 mmHg (10.7–20.0 mmHg); refractive error was -3.19±3.56 diopters (D) (-13.3 to +6.8 D); and CCT was 520.5±32.7 μm (440–606 μm). The initial MD value was -7.46±5.53 dB (-19.11 to +1.15 dB), and the final MD value was -10.35±6.49 dB (-26.39 to +0.26 dB) (Table 1).
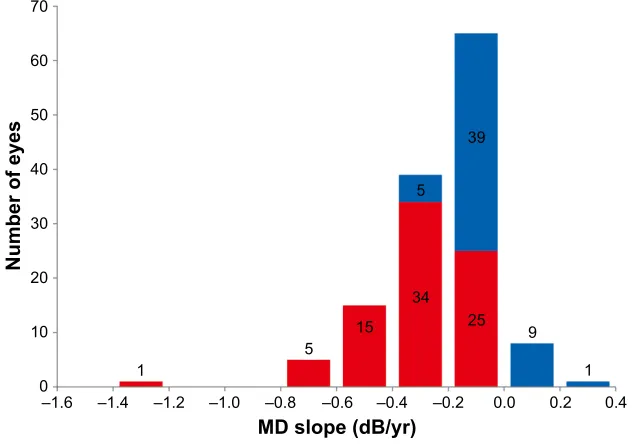
During the observation period, a consecutive decrease in MD values was observed in 97% of the eyes (130/134). Among these, a triple or quadruple consecutive decrease in MD values was observed in 54.5% of eyes (73/134) (Figure 1). We found significant deterioration of MD slope at the final observation in 59.7% of eyes (80/134); the mean change in MD slope was -0.22±0.22 dB/yr (Figure 2). A consecutive decrease in MD values was significantly correlated with deterioration of MD slope, both by trend analysis (P=0.0000) and univariate logistic regression analysis (odds ratio: 2.19; 95% confidence interval [CI]: 1.44–3.34; P,0.0001) (Table 2).
Mean IOP during the observation period was 12.01±0.88 mmHg (8.8–15.0 mmHg), and mean IOP fluctuation was 0.97±0.22 mmHg (0.6–2.0 mmHg). The IOP reduction rate relative to baseline was 18.82%±8.48% (-0.3% to 35.9%). DH was observed in 21.6% of eyes (29/134).
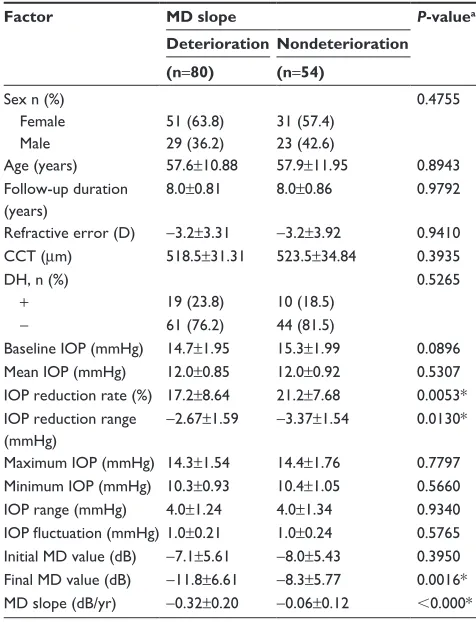
No significant differences in clinical characteristics were evident between groups with or without MD slope deteriora-tion. Although there was no significant difference in initial and observation period MD values between the two groups, MD slope was significantly steeper in the MD slope deterio-ration group than in the nondeteriodeterio-ration group (-0.32 dB/ yr versus -0.06 dB/yr; P,0.0001).
There were no significant differences in the prevalence of DH, degree of refractive error, and CCT between the two groups. However, the IOP reduction rate was significantly greater in the nondeterioration group than in the MD slope deterioration group (P=0.0053) (Table 3). Multivariate analy-sis revealed that the number of consecutive decreases in MD value was significantly associated with deterioration of the MD slope (odds ratio: 2.43; 95% CI: 1.55–3.80; P,0.0001), while IOP reduction rate was significantly associated with nondeterioration of MD slope (odds ratio: 0.92; 95% CI: 0.88–0.97; P=0.0020) (Table 4).
Discussion
During the 6-year follow-up period of the present study, the occurrence of three or more consecutive decreases in MD values was significantly related to MD slope deterioration in patients with NTG who were taking topical glaucoma medications. In contrast, reduction of IOP may play a role in the nondeterioration of MD slope.
Table 1 Patient characteristics, IOP data, and visual field data
Characteristics n (%) Mean ± SD
sex
Female 82 (61.2)
Male 52 (38.8)
age (years) 57.7±11.3
Follow-up period (years) 8.05±0.82
refractive error (D) -3.19±3.56
CCT (μm) 520.5±32.7
Dh
+ 29 (21.6)
- 105 (78.4)
Baseline iOP (mmhg) 14.96±1.98
Mean iOP (mmhg) 12.01±0.88
iOP reduction rate (%) 18.82±8.48
iOP reduction range (mmhg) -2.95±1.60
Maximum iOP (mmhg) 14.32±1.63
Minimum iOP (mmhg) 10.29±0.98
iOP range (mmhg) 4.03±1.27
IOP fluctuation (mmHg) 0.97±0.22
initial MD value (dB) -7.46±5.53
Final MD value (dB) -10.35±6.49
MD slope (dB/yr) -0.22±0.22
Notes: Mean ± SD number of visual field tests: 15.7±3.6 (range, 11–29). Mean ± sD number of iOP measurements: 37.8±4.4 (range, 23–41).
Abbreviations: CCT, central corneal thickness; Dh, disc hemorrhage; iOP, intraocular pressure; MD, mean deviation; sD, standard deviation.
Clinical Ophthalmology downloaded from https://www.dovepress.com/ by 118.70.13.36 on 21-Aug-2020
Dovepress Yoshikawa et al
Figure 2 Distribution of number of eyes with MD slope value at the final visual field test.
Notes: At the final visual field test, significantly negative MD slope was observed in 80 (59.7%: red column) of 134 eyes, but MD slope deterioration was not significant in 54 eyes (40.3%: blue column). all 21 eyes with MD slope of lower than -0.4 dB/year showed significant deterioration. Of 102 eyes with MD slope was less than -0.4 dB/year, however, 59 eyes (57.8%) appeared to be significant MD slope deterioration.
Abbreviation: MD, mean deviation.
Number of eyes
–1.6 –1.4
1 5
15 34
25 39
5
9
1 –1.2 –1.0 –0.8
MD slope (dB/yr)–0.6 –0.4 –0.2 0.0 0.2 0.4
60 70
50
40
30
20
0 10
Figure 1 Distribution of number of eyes in which consecutive decrease in MD value was observed.
Notes: Of 130 eyes in which consecutive decrease in MD value was observed during the follow-up period, the number of two consecutive was 57 eyes (43.8%). Three consecutive and four or more consecutive was observed in 39 eyes (30.0%) and 34 eyes (26.2%), respectively.
Abbreviation: MD, mean deviation.
1XPEHURIFRQVHFXWLYHGHWHULRUDWLRQVRI0'
1XPEHURIH\HV
In a previous study, we reported that three or more con-secutive decreases in MD during follow-up is a risk factor for significant deterioration of MD slope in patients with POAG and NTG, and that eyes with MD slope nondeterio-ration had significantly higher rates of reduction in IOP.4
However, our previous study included POAG patients in whom a decrease of abnormally elevated IOP is likely to
prevent VFD progression; in contrast, IOP levels are within the normal range in NTG patients. In the present study, we examined a variety of factors that may affect VFD progres-sion in patients with NTG.
Significant deterioration of the MD slope occurred in 59.3% of patients with NTG. Previous long-term observa-tional studies of NTG have indicated that progression of VFD
Clinical Ophthalmology downloaded from https://www.dovepress.com/ by 118.70.13.36 on 21-Aug-2020
Dovepress Progression of VFD in nTg
Table 2 results of trend analysis and univariate logistic regression analysis
Consecutive decrease of MD
MD slope Total
Deterioration Nondeterioration n (%) n (%) n (%)
#1 2 (50.0) 2 (50.0) 4 (3.0)
2 23 (40.4) 34 (59.6) 57 (42.5)
3 26 (66.7) 13 (33.3) 39 (29.1)
$4 29 (85.3) 5 (14.7) 34 (25.4)
Total 80 (59.7) 54 (40.3) 134
P-value:
,0.0001
Value Odds ratio (95% CI) P-value
Consecutive decrease of MD
2.19 (1.44–3.34) ,0.0001
Notes: Objective variable: presence or absence of MD slope deterioration. explanatory variables: consecutive deterioration of VFD.
Abbreviations: CI, confidence interval; IOP, intraocular pressure; MD, mean deviation; VFD, visual field defects.
Table 3 Comparison of variables between groups with and without MD slope deterioration
Factor MD slope P-valuea
Deterioration Nondeterioration (n=80) (n=54)
sex n (%) 0.4755
Female 51 (63.8) 31 (57.4)
Male 29 (36.2) 23 (42.6)
age (years) 57.6±10.88 57.9±11.95 0.8943
Follow-up duration (years)
8.0±0.81 8.0±0.86 0.9792
refractive error (D) -3.2±3.31 -3.2±3.92 0.9410
CCT (μm) 518.5±31.31 523.5±34.84 0.3935
Dh, n (%) 0.5265
+ 19 (23.8) 10 (18.5)
- 61 (76.2) 44 (81.5)
Baseline iOP (mmhg) 14.7±1.95 15.3±1.99 0.0896 Mean iOP (mmhg) 12.0±0.85 12.0±0.92 0.5307 iOP reduction rate (%) 17.2±8.64 21.2±7.68 0.0053* iOP reduction range
(mmhg)
-2.67±1.59 -3.37±1.54 0.0130*
Maximum iOP (mmhg) 14.3±1.54 14.4±1.76 0.7797 Minimum iOP (mmhg) 10.3±0.93 10.4±1.05 0.5660
iOP range (mmhg) 4.0±1.24 4.0±1.34 0.9340
IOP fluctuation (mmHg) 1.0±0.21 1.0±0.24 0.5765 initial MD value (dB) -7.1±5.61 -8.0±5.43 0.3950 Final MD value (dB) -11.8±6.61 -8.3±5.77 0.0016* MD slope (dB/yr) -0.32±0.20 -0.06±0.12 ,0.000*
Notes: aWelch’s t-test except sex, Dh (Fisher’s exact test); *Values indicate those
results that are statistically significant at the P,0.05 level.
Abbreviations: CCT, central corneal thickness; Dh, disc hemorrhage; iOP, intraocular pressure; MD, mean deviation; sD, standard deviation.
Table 4 results of multivariate logistic regression analysis
Value Odds ratio (95% CI) P-value
Consecutive decrease of MD 2.43 (1.55–3.80) ,0.0001 iOP reduction rate (%) 0.92 (0.88–0.97) 0.0020
Notes: Objective variable: presence or absence of MD slope deterioration. explanatory variables: consecutive deterioration of VFD, iOP reduction rate versus baseline.
Abbreviations: CI, confidence interval; IOP, intraocular pressure; MD, mean deviation; VFD, visual field defects.
occurs in approximately 50% of patients (46.3%–53%).8,10,14
Progression of NTG can also be assessed by morphological changes.15 However, trend analysis and calculation of the MD
slope are generally employed for assessment of VFD, since
the definition of progression according to morphological data has not been fully established. According to a defini-tion of VFD deterioradefini-tion as MD slope exceeding 0.5 dB/yr, Komori et al10 reported a frequency of VFD progression of
53%. In the present study, incidence of VFD progression was 59%, which was slightly higher than previous reports.8–11 We
defined VFD progression as a significant decrease in MD slope determined by regression analysis; mean MD slope value was -0.32 dB/yr. Even in normal individuals, MD values decline by 0.06–0.08 dB/yr with increasing age.16
VFD progression criteria in the present study, therefore, were considered appropriate for NTG patients under long-term observation. Trend analysis and the odds ratio of univariate logistic regression analysis for consecutive decreases of MD versus deterioration of MD slope was 2.26, indicating that the deterioration of the MD slope was significantly related to consecutive decrease in MD values. Thus, consecutive decreases in MD values predict subsequent worsening of VFD in NTG patients, and suggest the necessity of additional treatment.
DH,8,10 myopia,9 and CCT17 are documented risk
factors for VFD progression in NTG. However, some studies have shown these factors to be unrelated to VFD progression.14,18–20 In our current study, no apparent
differ-ence was observed among these factors when compared between groups (eyes with deterioration of MD slope and those with nondeterioration). The multiple disparate pathologies of NTG may be responsible for varying results among different studies.
Factors related to IOP, in contrast, have shown consistent relationships to the progression of VFD in most previous reports. However, there are differences among IOP-related factors, ie, peak IOP,14 changes in IOP,21 or the IOP
reduc-tion rate,8 and their degree of influence over VFD
progres-sion. In our study, only IOP reduction rate was significantly greater in patients without MD slope deterioration than in those with deterioration.
Long-term studies of NTG have reported baseline IOPs of 15–16 mmHg and mean IOPs during the observation
Clinical Ophthalmology downloaded from https://www.dovepress.com/ by 118.70.13.36 on 21-Aug-2020
Dovepress Yoshikawa et al
period of 13–14 mmHg.8–10,14 In the present study,
base-line IOP was not significantly different between the MD slope deterioration group and the nondeterioration group (14.7 mmHg versus 15.4 mmHg), but the rates of IOP reduction during the observation period were significantly different between groups. However, the numerical differ-ence in rates was not large -17.2% IOP reduction rate in the MD slope deterioration group and 21.5% in the nonde-terioration group – suggesting that other factors may need to be considered. Accordingly, we conducted multivariate logistic regression analysis to statistically examine the rela-tionships among variables that were significant according to univariate analysis. Since this was a retrospective obser-vational study, we calculated the odds ratio rather than the risk ratio. Our results demonstrated that progression of VFD was related to the number of consecutive decreases in MD value, while the IOP reduction rate was related to nondete-rioration of VFD.
We also investigated predictions of future VFD dete-rioration in NTG patients with the naïve Bayes method.22
Assuming that consecutive decreases in MD values and reduction of IOP occur independently, 10,000 simulations were conducted, and a classification rule (deterioration/ nondeterioration) was prepared. From this, the concordance rate was 69.8% and its 95% CI was 69.6%–70.0%. Effective methods for predicting the progression of glaucomatous VFD have not yet been established. For example, the concordance rate of ophthalmologists for predicting progression of VFD is nearly 60%.23 Therefore, the present simulation was
sup-portive of consecutive decreases in MD values and IOP reduction rate as prognostic factors for VFD progression in NTG patients.
Conclusion
In the present study population, a 20% reduction of IOP from baseline may slow the progression of VFD, a result that emphasizes the importance of controlling IOP in patients with NTG.
Acknowledgments
This was an investigator–industry collaborative study, funded by Santen Pharmaceutical Co., Ltd. (Osaka, Japan). Santen Pharmaceutical Co. Ltd. participated in the design of the study, suggestions of the statistical method, inter-pretation of the data, and preparation and review of the manuscript, but had no role in the collection and analysis of data.
Disclosure
Santo K, Hizaki H, and Hashimoto M are employees of Santen Pharmaceutical Co., Ltd. The authors report no other conflicts of interest in this work.
References
1. Heijl A, Lindgren G, Olsson J. A package for the statistical analysis of visual fields. Doc Ophthalmol Proc Ser. 1987;49:153–168.
2. Chauhan BC, Garway-Heath DF, Goñi FJ, et al. Practical recommen-dations for measuring rates of visual field change in glaucoma. Br J
Ophthalmol. 2008;92(4):569–573.
3. Crabb DP, Garway-Heath DF. Intervals between visual field tests when monitoring the glaucomatous patient: wait-and-see approach. Invest
Ophthalmol Vis Sci. 2012;53(6):2770–2776.
4. Naito T, Yoshikawa K, Mizoue S, et al. Relationship between consecu-tive deterioration of mean deviation value and progression of visual field defect in open-angle glaucoma. Clin Ophthalmol. 2015;9:2217–2222. 5. Chandler PA. Long-term results in glaucoma therapy. Am J Ophthalmol.
1960;49(2):221–246.
6. Grant WM, Burke JF Jr. Why do some people go blind from glaucoma?
Ophthalmology. 1982;89(9):991–998.
7. Brubaker RF. Delayed functional loss in glaucoma. LII Edward Jackson Memorial Lecture. Am J Ophthalmol. 1996;121(5):473–483. 8. Kim M, Kim DM, Park KH, Kim TW, Jeoung JW, Kim SH. Intraocular
pressure reduction with topical medications and progression of normal-tension glaucoma: a 12-year mean follow-up study. Acta Ophthalmol. 2013;91(4):e270–e275.
9. Sakata R, Aihara M, Murata H, et al. Contributing factors for progression of visual field loss in normal-tension glaucoma patients with medical treatment. J Glaucoma. 2013;22(3):250–254.
10. Komori S, Ishida K, Yamamoto T. Results of long-term monitoring of normal-tension glaucoma patients receiving medical therapy: results of an 18-year follow-up. Graefes Arch Clin Exp Ophthalmol. 2014;252(12): 1963–1970.
11. Lee J, Kong M, Kim J, Kee C. Comparison of visual field progression between relatively low and high intraocular pressure groups in normal tension glaucoma patients. J Glaucoma. 2014;23(8):553–560. 12. Kitazawa Y, Shirato S, Yamamoto T. Optic disc hemorrhage in
low-tension glaucoma. Ophthalmology. 1986;93(6):853–857.
13. Viswanathan D, Goldberg I, Graham SL. Relationship of change in central corneal thickness to visual field progression in eyes with glau-coma. Graefes Arch Clin Exp Ophthalmol. 2013;251(6):1593–1599. 14. Erdem E, Williams A, Kuchar SD, Waisbourd M, Spaeth GL.
Long-term (.8 years) evaluation of progression in patients with low-pressure glaucoma. Eur J Ophthalmol. 2015;25(6):490–495.
15. Banegas SA, Antón A, Morilla A, et al. Evaluation of the retinal nerve fiber layer thickness, the mean deviation, and the visual field index in progressive glaucoma. J Glaucoma. 2016;25(3):e229–e235. 16. Suzumura H, Yoshikawa K, Mizoue S, Hyodo R, Kimura T. Assessment
of retinal sensitivity using a time-saving strategy in normal individuals.
Clin Ophthalmol. 2012;6:1873–1878.
17. Gordon MO, Beiser JA, Brandt JD, et al. The Ocular Hypertension Treatment Study: baseline factors that predict the onset of primary open-angle glaucoma. Arch Ophthalmol. 2002;120(6):714–720. 18. Mitchell P, Hourihan F, Sandbach J, Wang JJ. The relationship between
glaucoma and myopia: the Blue Mountains Eye Study. Ophthalmology. 1999;106(10):2010–2015.
19. Medeiros FA, Sample PA, Zangwill LM, Bowd C, Aihara M, Weinreb RN. Corneal thickness as a risk factor for visual field loss in patients with preperimetric glaucomatous optic neuropathy. Am J Ophthalmol. 2003;136(5):805–813.
20. Sohn SW, Song JS, Kee C. Influence of the extent of myopia on the pro-gression of normal-tension glaucoma. Am J Ophthalmol. 2010;149(5): 831–838.
Clinical Ophthalmology downloaded from https://www.dovepress.com/ by 118.70.13.36 on 21-Aug-2020
Clinical Ophthalmology
Publish your work in this journal
Submit your manuscript here: http://www.dovepress.com/clinical-ophthalmology-journal Clinical Ophthalmology is an international, peer-reviewed journal covering all subspecialties within ophthalmology. Key topics include: Optometry; Visual science; Pharmacology and drug therapy in eye diseases; Basic Sciences; Primary and Secondary eye care; Patient Safety and Quality of Care Improvements. This journal is indexed on
PubMed Central and CAS, and is the official journal of The Society of Clinical Ophthalmology (SCO). The manuscript management system is completely online and includes a very quick and fair peer-review system, which is all easy to use. Visit http://www.dovepress.com/ testimonials.php to read real quotes from published authors.
Dovepress
Dove
press
Progression of VFD in nTg
21. Fukuchi T, Yoshino T, Sawada H, et al. The relationship between the mean deviation slope and follow-up intraocular pressure in open-angle glaucoma patients. J Glaucoma. 2013;22(9):689–697.
22. Yager RR. An extension of the naive Bayesian classifier. Inf Sci. 2006;176(5):577–588.
23. Lin AP, Katz LJ, Spaeth GL, et al. Agreement of visual field interpretation among glaucoma specialists and comprehensive oph-thalmologists: comparison of time and methods. Br J Ophthalmol. 2011;95(6):828–831.
Clinical Ophthalmology downloaded from https://www.dovepress.com/ by 118.70.13.36 on 21-Aug-2020