VALD: the meeting point of data producers and data
users
Tatiana Ryabchikova1*, Yury Pakhomov1and Nikolai Piskunov2
1 Institute of Astronomy, Russian Academy of Sciences, Moscow, Russia; [email protected],
2 Department of Physics and Astronomy, Division of Astronomy and Space Physics, Uppsala University,
Uppsala, Sweden; [email protected]
* Correspondence: [email protected]; Tel.: +7-495-951-3980
Version June 27, 2018 submitted to
Abstract:Vienna Atomic Line Database (VALD) contains data on atomic and molecular energy levels 1
and parameters of spectral lines required for stellar spectra analysis. Hundreds of millions lines for 2
fine spectral synthesis and for opacity calculations are collected in present version of VALD (VALD3). 3
Critical evaluation of the data and the diversity of extraction tools support high popularity of VALD 4
among users. The data model of VALD3 incorporates obligatory links to the bibliography making 5
our database more attractive as publishing platform for data producers. The VALD data quality and 6
completeness are constantly improving allowing better reproduction of stellar spectra. To illustrate 7
continuous evolution of the data content we present a comparative analysis of the recent experimental 8
and theoretical atomic data for Fe-group elements, which will be included in the next VALD release. 9
This release will also include a possibility for extracting the line data with full isotopic and hyperfine 10
structures. 11
Keywords:stellar spectra; atomic and molecular data; databases. 12
1. Introduction 13
Spectroscopy is one of the main tools for detecting various species and probing physical 14
conditions in the Universe. Stellar spectroscopy provides the information about basic stellar parameters 15
(temperature, gravity, abundances, velocities) and combined with theoretical models and astrometric 16
data it reveals stellar populations and their evolution. However, for correct interpretation of the 17
observed spectra one needs accurate parameters of many spectral lines, which are imprinted in 18
the emergent radiation. The most prominent and sensitive spectral features are sensitive to stellar 19
parameter and thus we need large amount of reliable data and the means for selecting relevant 20
information for our targets. This huge amount of data is collected in specialised databases (DB) of 21
atomic and molecular line parameters. Vienna Atomic Line Database (VALD) created in 1995 [1] by
22
astrophysists quickly became one of the most popular DB for the analysis of stellar spectra. The second 23
version, VALD2 [2], was running since 1999, and VALD3 [3] started its work since 2015. 24
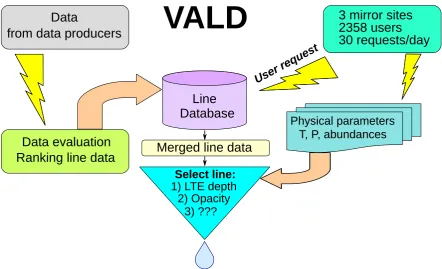
Throughout its development VALD became a meeting point of data producers and data users. 25
Figure1represents schematically VALD structure. VALD team critically analyses every new atomic
26
and molecular parameter dataset ("line list" in VALD terminology) that we receive from data producers 27
by comparing spectral fits to high-precision spectra of reference stars (the Sun, Sirius, Procyon, etc). At 28
this point we establish the rank for each data type in the new line list that is then included in VALD. 29
In this way we save all previous datasets so that we can reproduce the results from earlier releases. 30
The new data is seamlessly integrated in the extraction delivering the best content according to our 31
evaluation. We regularly check our quality assessments against other centres and groups (e.g. NIST), 32
constantly collect feedback from data users and discuss methodology in forums such as VAMDC 33
(www.vamdc.org). VALD team ranking is compiled in the so-called default VALD configuration. 34
Users get the possibility to create their own copy of configuration where they can adjust the ranking 35
parameters. The requested data is returned to the user by e-mail or ftp. 36
VALD
User
req
uest
Line
Database
Physical parameters
T, P, abundances
Select line:
1) LTE depth
2) Opacity
3) ???
3 mirror sites
2358 users
30 requests/day
Data evaluation
Ranking line data
Data
from data producers
Merged line data
Figure 1.Schematic presentation of VALD database structure.
2. Data extraction 37
The VALD users appreciate the variety of data extraction tools. It is possible to examine the full 38
VALD collection of parameters for individual spectral line and to get their combination to a final 39
output ("Show Line ONLINE"), to extract all available data for a certain chemical species in a chosen 40
spectral range ("Extract Element"), to get data for all species selected spectral range ("Extract All"), and 41
to extract data for spectral lines noticeable in the emergent radiation of a star with a given effective 42
temperature, surface gravity and metallicity ("Extract Stellar"). This last extraction tool is particularly 43
popular among stellar spectroscopists because it allows to get lines with the most significant imprint 44
on the stellar flux. It provides the estimated line strength and selects minimal data set for successful 45
spectral synthesis. 46
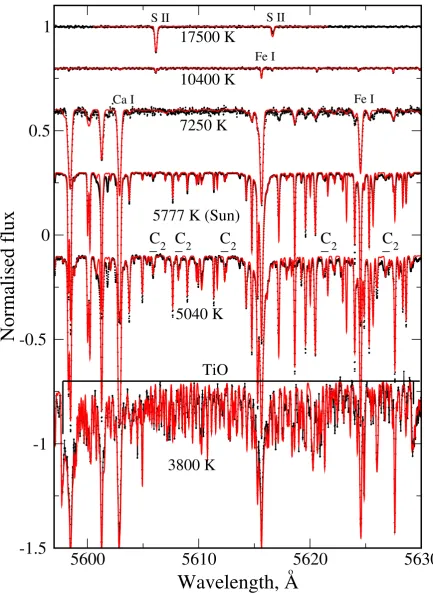
Figure2demonstrates the level of completeness of VALD and the efficiency of its extraction
47
tools. We show the comparison of the high-resolution observations with synthetic spectra for stars 48
of different effective temperatures: ιHer (Teff=17500 K), 21 Peg (10400 K), HD 32115 (7250 K), Sun
49
(5777 K),δEri (5040 K) and M1-dwarf UCAC4 443-054906 (3800 K). Spectra ofιHer, 21 Peg, HD 32115
50
were obtained with the Echelle SpectroPolarimetric Device for the Observation of Stars (ESPaDOnS) 51
attached at the 3.6m Canada-France-Hawaii Telescope (CFHT) and were taken from the ESPaDOnS 52
archive1.δEri and UCAC4 443-054906 were observed with the HARPS spectrograph at the ESO 3.6m
53
telescope at La Silla. These were retrieved from the ESO archive2. For the Sun we used the Kitt Peak
54
Solar Atlas [4]. Synthetic calculations were based on the VALD3 data extracted for each star using
55
"Extract Stellar" tool. 56
5600
5610
5620
5630
Wavelength, A
o-1.5
-1
-0.5
0
0.5
1
Normalised flux
S II
S II
Ca I
Fe I
Fe I
17500 K
10400 K
7250 K
5777 K (Sun)
C
2
C
2
C
2
C
2
C
2
5040 K
3800 K
TiO
Figure 2.Calculated spectra for different effective temperatures (solid red line) in comparison with the observations (black dots). Atomic parameters were extracted from VALD with the "Extract Stellar" extraction tool. Spectra are shifted in y-axis for better presentation.
While in the hottest star,ιHer, only 8 lines reach central depths over 1% relative to continuum in
57
Most of the observed features belong to the molecular lines, and the fact that both atomic and molecular 59
line parameters are retrieved through the same interface makes VALD the most efficient ’work horse’ 60
for stellar spectroscopic analysis. The only other data collection by R. Kurucz3containing both atomic 61
and molecular line data does not offer "Extract Stellar"-like query option. 62
Another important new feature in VALD3 is propagation of bibliographic links. Each VALD3 63
record includes the source reference complemented with optional references to measured wavelength, 64
oscillator strength and isotopic shifts. During the extraction records from different line lists describing 65
the same transition are merged according to the ranking scheme. Thus, the output record may contain 66
entries from several different sources. In VALD3 the bibliographic keys follow the merging procedure 67
so that each field of the output record contains a matching reference. In the final stage of extraction 68
VALD3 collects BibTeX entries matching unique reference keys and delivers them to the user in form 69
of a separate BibTeX file. 70
3. Iron analysis 71
Iron is one of the most important element in stellar spectroscopy. It is a reference element for 72
metallicity of stars and for chemical evolution of the Galaxy. Therefore the accuracy of iron abundance 73
determination is particularly important. With the present quality of high-resolution spectroscopic 74
observations this task is very sensitive to the accuracy of spectral line parameters. NIST Atomic 75
Spectra Database (ASD) [5] assigns the highest accuracy estimates of 3-5% for the Oxford laboratory
76
measurements of Fe I transition probabilities [6–10]. Independent laboratory data of the Hannover
77
group [11,12] show small but systematic difference from the Oxford measurements (see Figure3, left 78
panel). The claimed uncertainties of the Hannover data are 7-15% and this internal estimate agrees 79
with the one by NIST. For common lines in both sets of measurements NIST recommends the use of 80
Oxford values. The differences between Oxford and Hannover transition probabilities are shown in 81
Figure3(left panel). Recently new laboratory data for Fe I transition probabilities were published
82
by spectroscopy groups of Wisconsin University (USA) and Imperial College (UK): Ruffoniet al.[13],
83
Den Hartoget al.[14], and Belmonteet al.[15]. A comparison between the Wisconsin + IC data and
84
Hannover transition probabilities is also shown in Figure3(left panel). No systematic difference is
85
visible. We performed Fe abundance measurements in the solar atmosphere with different sets of 86
transition probabilities: Oxford, Hannover and IC [15]. Abundances are displayed in Figure3(right
87
panel). We get systematically lower Fe abundance with Hannover and IC transition probabilities 88
compared to that derived with the Oxford data. Careful analysis of all data sets using spectra of other 89
than the Sun reference stars is required to establish a best final list of Fe I experimental transition 90
probabilities recommended for abundance determinations in stellar atmospheres. This work will be 91
done for the next VALD release. 92
0 1 2 3 4
Excitation energy, eV
-0.5 -0.4 -0.3 -0.2 -0.1 0 0.1 0.2 0.3 0.4 0.5
∆
log gf
log gf (Oxford) - log gf (Hannover) log gf (IC+W) - log gf (Hannover)
0 1 2 3 4 5
Excitation energy, eV
-5 -4.9 -4.8 -4.7 -4.6 -4.5 -4.4 -4.3 -4.2 -4.1 -4
log(N
Fe
/N
tot
)
SUN (Teff = 5777 K)
Blackwell et al. (Oxford): -4.52 +/- 0.05 Bard, Kock, Kock (Hannover): -4.59 +/- 0.04 Belmonte et al. (2017 - IC) : -4.63 +/- 0.08
Figure 3.Left panel: Comparison of different sets of the laboratory transition probabilities. Dashed lines show mean values of the differences.
Right panel: Fe abundance in the solar atmosphere derived with the Oxford, Hannover and IC sets of transition probabilities. Linear regressions for each set of data are indicated by solid lines.
Laboratory data are available for a limited number of spectral lines while one needs much more 93
lines for theoretical presentation of the observed spectra. The most part of line parameters come from 94
theoretical calculations. Recently, Peterson & Kurucz [16,17] performed an extensive analysis of Fe I 95
level structure based on high quality stellar spectra which resulted in newly classified energy levels and 96
new Fe I lines potentially detectable in stellar spectra. At present more than 1100 classified levels are 97
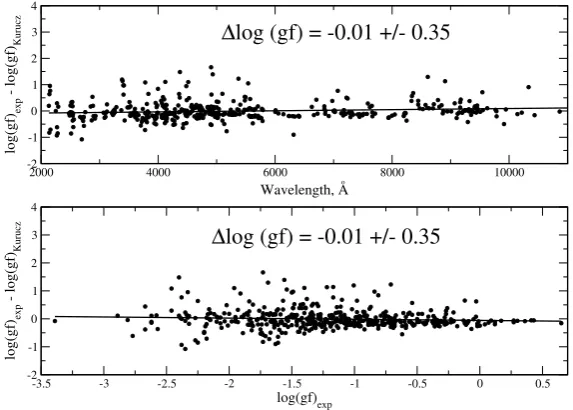
known with ten levels having energies above Fe I ionisation potential. To check the uncertainties of the 98
theoretical data we compared transition probabilities calculated by R. Kurucz4with the experimental
99
measurements by Wisconsin + IC. 100
2000 4000 6000 8000 10000
Wavelength, Ao
-2 -1 0 1 2 3 4
log(gf)
exp
- log(gf)
Kurucz
-3.5 -3 -2.5 -2 -1.5 -1 -0.5 0 0.5
log(gf)exp
-2 -1 0 1 2 3 4
log(gf)
exp
- log(gf)
Kurucz
∆
log (gf) = -0.01 +/- 0.35
∆
log (gf) = -0.01 +/- 0.35
Figure 4.Left panel: Comparison between the experimental transition probabilities of Wisconsin+IC and Kurucz’ theoretical calculations as a function of wavelength (top panel) and excitation energy (bottom panel). Linear regressions are indicated by solid lines.
Figure4 shows a comparison between experimental (∼500 lines) and theoretical transition 101
probabilities. There is no systematic differences. The absolute scales seems to match, although 102
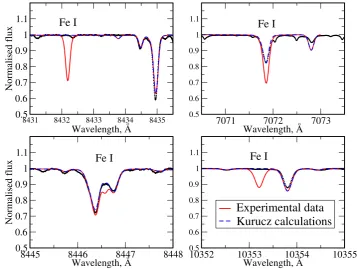
the dispersion of the theoretical data is rather large. The deviation exceeds 2 dex for a few lines. 103
However, laboratory measurements may be erroneous, too, and such comparisons could reveal the 104
errors. In 4 cases the laboratory data were clearly incorrect and had to be replaced by the theoretical 105
calculations. These cases are demonstrated in Figure5. 106
All of the examples presented so far illustrated the process of critical data evaluation in VALD. 107
8431 8432 8433 8434 8435
Wavelength, Ao 0.5
0.6 0.7 0.8 0.9 1 1.1
Normalised flux
7071 7072 7073
Wavelength, Ao
0.5 0.6 0.7 0.8 0.9 1 1.1
8445 8446 8447 8448
Wavelength, Ao 0.5
0.6 0.7 0.8 0.9 1 1.1
Normalised flux
10352 10353 10354 10355
Wavelength, Ao
0.5 0.6 0.7 0.8 0.9 1 1.1
Experimental data
Kurucz calculations
Fe I
Fe I
Fe I
Fe I
Figure 5.Comparison of the synthetic spectrum calculations made with experimental (red solid line) and theoretical (blue dashed line) transition probabilities to the solar flux observations (black dots).
4. Hyperfine splitting in VALD 108
Transition probability defines spectral line intensity. The lines of an element/isotope with an 109
odd mass number are splitted into components due to multipolar interaction of the nuclear magnetic 110
dipole moment with the magnetic field created by the electron shell. This effect known as hyperfine 111
splitting (hfs) may produce significant change to the line shape and increase line intensity, which has 112
to be taken into account in precision spectral analysis. We created a special SQLite database with data 113
for hfs calculations collected from the literature. These data include species names, energy of levelsE, 114
total angular momentJ, magnetic momentI, and the hfs constantsAandB(see, for more details [18]). 115
Full hfs-pattern on-the-fly calculations will soon be offered as an option for VALD3 "Extract Stellar" 116
0 0.2 0.4 0.6 0.8 1
Normalised flux
5341 5341.5 0
0.2 0.4 0.6 0.8 1
6449.5 6450 6450.5
Wavelength, A
oFe I Mn I
Ca I
Co I
Co I Co I Co I Co I
Mn I
Fe I
Co I
Ca I
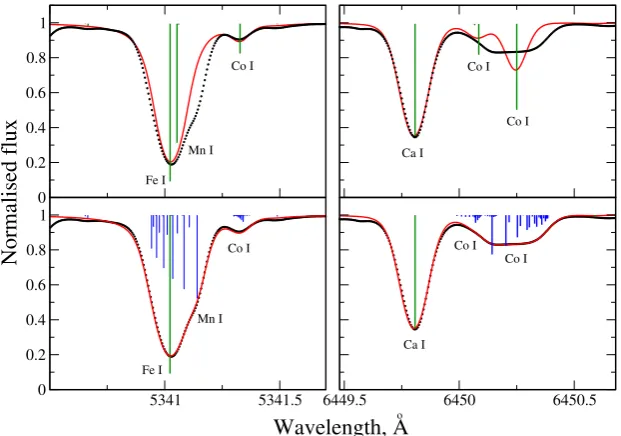
Figure 6. Hyperfine splitting in Mn I and Co I solar lines. Synthetic spectrum calculations without hfs are shown in top panels while the same calculations with hfs taken into account are shown in the bottom panels. The position of the non-splitted lines is indicated by vertical green lines, the hfs-patterns are indicated by vertical blue lines. Observations are shown by black dots.
Figure6demonstrates the importance of hfs for accurate fitting of spectral features. Atomic
118
data for synthetic calculations with hfs components were extracted from Moscow VALD3 mirror site5
119
where hfs-extraction is running in a test mode. AandBconstants were taken from Dembczy ´nskiet al.
120
[19], Ba¸saret al.[20] for Mn I line and from Guthöhrlein and Keller [21], Pickering [22] for Co I lines. 121
5. Discussion 122
The consistent development of the VALD data content and software reached the point where we 123
can reliably model stellar spectra across all spectral types. The flexible extraction tools tune to user 124
requirements have proven to be very popular. In fact, the VALD3 estimate of the central line depth in 125
"Extract Stellar" mode is frequently used in science publications, e.g. when combining many spectral 126
lines in search for binarity or weak magnetic fields. Massive efforts invested in data consistency 127
verification and standardisation of energy level description as part of the VALD3 transition payed 128
off by reducing the amount of erroneous data and development of the robust merging algorithm 129
for overlapping data. It also opened new possibilities for NLTE calculation etc. The new accurate 130
bibliographic system simplifies the referencing of the original work by data producers making VALD an 131
attractive platform for publishing new data. Large projects working on combination of heterogeneous 132
atomic and molecular data (e.g. VAMDC) look at VALD as model for bibliographic system and data 133
evaluation. 134
6. Conclusions 135
VALD is an established source of atomic and molecular data for astronomical and particularly 136
stellar spectroscopy. It is the most complete data collection for temperatures encountered in stellar 137
atmospheres and circumstellar medium. Regular updates and critical evaluation of the new data 138
ensures best quality data is delivered to the user. In the same time, flexible referencing system allows 139
to trace the original reference of every data entry in the final selection. New features, such as isotopic 140
splitting and hyperfine splitting will soon be available to the users improving the quality of the spectral 141
synthesis. Substantial progress in theoretical atomic and molecular models is bringing the quality of 142
the computed transition probabilities closer to the laboratory measurements further improving the 143
completeness of of our line lists. 144
Acknowledgments:Current research was supported by the Fundamental Research Program No.28 of Presidium 145
of the RAS. 146
Author Contributions:T.R. performed Iron analysis and wrote the main text of the paper; Yu.P. provided hfs 147
calculations and made plots; N.P. designed and further developped VALD to its current version, implemented to 148
the text of the paper. 149
Conflicts of Interest:“The authors declare no conflict of interest.” 150
Abbreviations 151
The following abbreviations are used in this manuscript: 152
153
NIST National Institute of Standards and Technology IC Imperial College
VAMDC Virtual Atomic and Molecular Data Centre 154
References 155
1. Piskunov, N.E.; Kupka, F.; Ryabchikova, T.A.; Weiss, W.W.; Jeffery, C.S. VALD: The Vienna Atomic Line 156
Data Base. A&AS1995,112, 525. 157
2. Kupka, F.; Piskunov, N.; Ryabchikova, T.A.; Stempels, H.C.; Weiss, W.W. VALD-2: Progress of the Vienna 158
Atomic Line Data Base.A&AS1999,138, 119–133. 159
3. Ryabchikova, T.; Piskunov, N.; Kurucz, R.L.; Stempels, H.C.; Heiter, U.; Pakhomov, Y.; Barklem, P.S. A 160
major upgrade of the VALD database. Phys. Scr2015,90, 054005. 161
4. Kurucz, R.L.; Furenlid, I.; Brault, J.; Testerman, L.Solar flux atlas from 296 to 1300 nm; New Mexico: National 162
Solar Observatory, 1984. 163
5. Kramida, A.; Ralchenko, Yu.; Reader, J.; and NIST ASD Team. NIST Atomic Spectra Database (ver. 5.5.6), 164
[Online]. Available:https://physics.nist.gov/asd[2018, June 18]. National Institute of Standards and 165
Technology, Gaithersburg, MD., 2018. 166
6. Blackwell, D.E.; Ibbetson, P.A.; Petford, A.D.; Shallis, M.J. Precision measurement of relative oscillator 167
strengths. IV - Attainment of 0.5 per cent accuracy: Fe I transitions from levels a5 D/0-4/ /0.00-0.12 eV/. 168
MNRAS1979,186, 633–650. 169
7. Blackwell, D.E.; Petford, A.D.; Shallis, M.J. Precision measurement of relative oscillator strengths. VI -170
Measures of Fe I transitions from levels a5 F/1-5/ /0.86-1.01 eV/ with an accuracy of 0.5 per cent. MNRAS
171
1979,186, 657–668. 172
8. Blackwell, D.E.; Petford, A.D.; Shallis, M.J.; Simmons, G.J. Precision Measurement of Relative Oscillator 173
Strengths - Part Eight - Measures of FEI Transitions from Levels A3F2-4/1.49-1.61EV with an Accuracy of 174
1%. MNRAS1980,191, 445. 175
9. Blackwell, D.E.; Petford, A.D.; Shallis, M.J.; Simmons, G.J. Precision measurement of relative oscillator 176
strengths. IX - Measures of Fe I transitions from levels a5 P1-3 /2.18-2.28 eV/, a3 P2 /2.28 eV/, a3 P0,1 177
/2.49-2.42 eV/, z7 D1-5 0 /2.48-2.40 eV/ and a3 H4-6 /2.45-2.40 eV/. MNRAS1982,199, 43–51. 178
10. Blackwell, D.E.; Booth, A.J.; Haddock, D.J.; Petford, A.D.; Leggett, S.K. Measurement of the oscillator 179
strengths of very weak 1 eV Fe I lines.MNRAS1986,220, 549–553. 180
11. Bard, A.; Kock, A.; Kock, M. Fe I oscillator strengths of lines of astrophysical interest.Astron. and Astrophys.
181
1991,248, 315–322. (BKK). 182
12. Bard, A.; Kock, M. Fe I oscillator strengths for lines with excitation energies between 3 and 7eV.Astron.
183
and Astrophys.1994,282, 1014–1020. (BK). 184
13. Ruffoni, M.P.; Den Hartog, E.A.; Lawler, J.E.; Brewer, N.R.; Lind, K.; Nave, G.; Pickering, J.C. Fe I oscillator 185
strengths for the Gaia-ESO survey. MNRAS2014,441, 3127–3136,[arXiv:astro-ph.SR/1404.5578]. 186
14. Den Hartog, E.A.; Ruffoni, M.P.; Lawler, J.E.; Pickering, J.C.; Lind, K.; Brewer, N.R. Fe I Oscillator Strengths 187
15. Belmonte, M.T.; Pickering, J.C.; Ruffoni, M.P.; Den Hartog, E.A.; Lawler, J.E.; Guzman, A.; Heiter, 189
U. Fe I Oscillator Strengths for Transitions from High-lying Odd-parity Levels. ApJ2017, 848, 125, 190
[arXiv:astro-ph.SR/1710.07571]. 191
16. Peterson, R.C.; Kurucz, R.L. New Fe I Level Energies and Line Identifications from Stellar Spectra.ApJS
192
2015,216, 1,[arXiv:astro-ph.SR/1406.0933]. 193
17. Peterson, R.C.; Kurucz, R.L.; Ayres, T.R. New Fe I Level Energies and Line Identifications from Stellar 194
Spectra. II. Initial Results from New Ultraviolet Spectra of Metal-poor Stars.ApJS2017,229, 23. 195
18. Pakhomov, Y.; Piskunov, N.; Ryabchikova, T. VALD3: Current Developments. Stars: From Collapse to 196
Collapse; Balega, Y.Y.; Kudryavtsev, D.O.; Romanyuk, I.I.; Yakunin, I.A., Eds., 2017, Vol. 510,Astronomical
197
Society of the Pacific Conference Series, p. 518,[arXiv:astro-ph.IM/1710.10854]. 198
19. Dembczy ´nski, J.; Ertmer, W.; Johann, U.; Penselin, S.; Stinner, P. Laser-Rf double-resonance studies of the 199
hyperfine structure of metastable atomic states of55Mn. Zeitschrift fur Physik A Hadrons and Nuclei1979, 200
291, 207–218. 201
20. Ba¸sar, G.; Ba¸sar, G.; Acar, G.; Öztürk, I.K.; Kröger, S. Hyperfine Structure Investigations of Mn I. Part 202
I: Experimental and Theoretical Studies of the Hyperfine Structure in the Even Configurations. Physica
203
Scripta2003,67, 476. 204
21. Guthöhrlein, G.H.; Keller, H.P. Doppler-free laserspectroscopic investigations of hyperfine structure in the 205
atomic cobalt spectrum. Zeitschrift fur Physik D Atoms Molecules Clusters1990,17, 181–193. 206
22. Pickering, J.C. Measurements of the Hyperfine Structure of Atomic Energy Levels in CO i. Astrophysical
207