Study of multipion production in np-interaction
at intermediate energies
AlexanderJerusalimov1,∗,SusannaArakelian1,AlexanderBelyaev1,VladimirLadygin1, and AlexanderTroyan1
1Joint Institute for Nuclear Research, Dubna, Russia
Abstract.The reactions of the multipion production in np-interactions were
studied at the momenta of incident neutrons from 1.73 to 5.20 GeV/c. The
pions multiplicity of the studied reactions was from 2 to 6. It was shown that the characteristics of the reactions were satisfactory described within the framework of OPER-model (One Pion Reggeizied Exchange). Additionally the diagrams of one baryon exchange (OBE) were used for a better description of the data at
the momenta of incident neutrons below 3 GeV/c.
1 Introduction
Multi pion production in NN collisions is one way to obtain information about the NN,πN andππstates, including:
- dibaryons (including I=2 in ppπ),
- dipions (narrowσ-meson,ππstates with I=2), - pentaquarks (I=5/2, S=+1),
- missing resonances etc.
An important task is to test the models of pion production in NN-interactions such as Valencia model [4], Xu Cao model [5], (OPER+OBE) model [6–8].
Various modifications of the one pion exchange models (OPE) are used to describe the experimental data of the inelastic NN-, N ¯N- andπN-interactions. Parameters of these models are different for various processes and even for concrete reactions at various energies.
The most developed and detailed model of Reggeiziedπ-meson exchange is the model elaborated at ITEP [6]. The advantages of this model are:
- small number of free parameters (3 in our case), - wide region of the described energies (2÷200 GeV),
- calculated values are automatically normalized to the reaction cross-section.
2 Experiment
The neutron-proton interactions were studied by using the neutron beam and liquid hydrogen bubble (target) at the JINR Synchrophasotron [1]. Unique complete and precise data were obtained. It allowed one to carry out a detailed study of inelastic np interactions in a wide
range of energies using the quasimonochromatic neutrons with P0<2.5% under condition of
4πgeometry.
The accuracy of the momentum and scattering angle reconstruction for the secondary charged particles wasσp/p ∼2% and σΘ ∼ 10 mrad, respectively. The separation of the
reaction channels was carried out by the standardχ2procedure using the corresponding con-straint equations [3].
A detailed description of the data processing and reaction channels separation was pre-sented in [2].
3
2
π
production
The reactionsnp→npπ+π−,np→ppπ−π0andnp→dπ+π−were studied at the momenta of
incident neutrons P0=1.73, 2.23, 3.83 and 5.20 GeV/c. The cross sections of the considered
reactions were presented in [2].
3.1 Reactionnp→ npπ+π−
This reaction is characterized by the plentiful production of∆1232-resonance and a number of
N∗and∆∗resonances in Nππsystem.
The main diagrams describing the reaction are the following:
n
p
N
N
π
π π
n
p
N
N
π
π π
n
p N
N
π
π
π
n
p
N N
π
π π
π
OPER22 OPERh OPER13
Figure 1.Main OPER diagrams for the reactionnp→npπ+π−
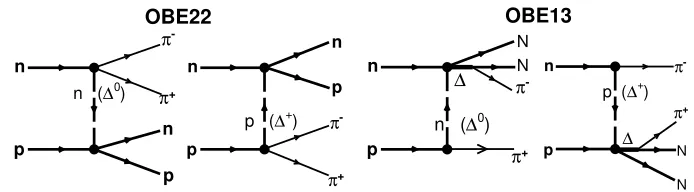
At the momentum of incident neutrons P0 <3.0 GeV/c it is also necessary to take into
account the diagrams of one-baryon exchange (OBE):
n
p
n
p -π
+ π
) 0
∆
n (
n
p N
N
-π
+
π
) +
∆
p (
∆ n
p
n
p
-π
+ π
) +
∆
p (
n
p
N N
-π
+ π ) 0 ∆ n (
∆
OBE22 OBE13
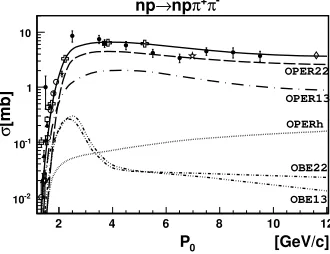
The contributions of these diagrams into the reaction are presented in Fig.3.
[GeV/c]
0
P
2 4 6 8 10 12
[mb] σ -2 10 -1 10 1 10 -π + π np → np OPER22 OPER13 OPERh OBE22 OBE13
Figure 3.The contribution of the diagrams in
Figs.1and 2into the reactionnp→npπ+π−. Open
crosses present our data
The results of the study of the reactionnp → npπ+π− at P0=5.20 GeV/c are presented
in Fig. 4. One can see a good agreement between the experimental data and theoretical calculations. The signal ofρ-meson production is not observed inππ-combinations..
Entries 5612 [GeV/c2]
π N M 1.5 2 ] 2 b/0.04 GeV/c µ /dM [ σ d 0 500 1000 1500 2000
Entries 5612
+ π p, M + π p -π n
Entries 5612 ]
2 [GeV/c π N M 1.5 2 ] 2 b/0.04 GeV/c µ /dM [ σ d 0 200 400 600 800
Entries 5612
-π p, M -π p + π n
Entries 5612 [GeV/c2]
π π
N M
1.5 2 2.5
] 2 b/0.04 GeV/c µ /dM [ σ d 0 200 400 600
Entries 5612 -π , + π p, M -π + π p -π + π n Mean 0.6291
RMS 0.23
] 2 [GeV/c π π M 0.5 1 ] 2 b/0.04 GeV/c µ /dM [ σ d 0 100 200 300 400 500
Mean 0.6291 RMS 0.23
-π + π
Entries 2806
* N Θ
cos -1 -0.5 0 0.5 1
b/0.1] µ [ Θ /cos σ d 0 1000 2000
Entries 2806
neutrons
)
n *
Θ
cos( Mean -0.3469
* N Θ
cos -1 -0.5 0 0.5 1
b/0.1] µ [ Θ /dcos σ d 0 1000 2000
Mean -0.3469 ) p * Θ cos( protons
Mean 0.1658
* π
Θ
cos -1 -0.5 0 0.5 1
b/0.1] µ [ Θ /dcos σ d 0 200 400 600 800 1000
Mean 0.1658 -mesons
-π
Mean -0.1782
* π
Θ
cos -1 -0.5 0 0.5 1
b/0.1] µ [ Θ /dcos σ d 0 200 400 600 800 1000
Mean -0.1782
-mesons + π ) + π * Θ cos(
Figure 4.The distributions from the reactionnp→npπ+π−
at P0=5.20 GeV/c. Solid line – calculations
using OPER-model
The diagrams in Fig.1, however, were insufficient to get a full description of the reaction np→ npπ+π−at lower energies. The study of effective mass spectra of np-combinations at
P0=2.23 and 1.73 GeV/c (Fig.5) has shown a clear peak near the threshold. Therefore the
model of Redgge poles with baryon exchange (OBE, see Fig2.) was used to describe these features.
Mean 1.989
1.9 2 2.1 2.2
] 2 b/0.010 GeV/c µ /dM [ σ d 0 50 100 150 200
Mean 1.989
a)
Mean 1.916
1.9 2 2.1
] 2 b/0.010 GeV/c µ /dM [ σ d 0 50
100 Mean 1.916
b)
Figure 5.The effective mass spectra
from the reactionnp→npπ+π−
at
a) P0=2.23 and b) 1.73 GeV/c.
The combined (OPER+OBE)-model allows one to get a good description of the charac-teristics of the reactionnp→npπ+π−at the momenta of incident neutrons in a region from
P0=1.73 to P0=5.2 GeV/c.
More detailed results of the study of this reaction were presented in [9,10].
3.2 Reactionnp→ ppπ−π0
We have also got a good description of the characteristics of the reactionnp→ ppπ−π0using the diagrams similar to the diagrams for the reactionnp→npπ+π−. The details of this study
were presented in [9].
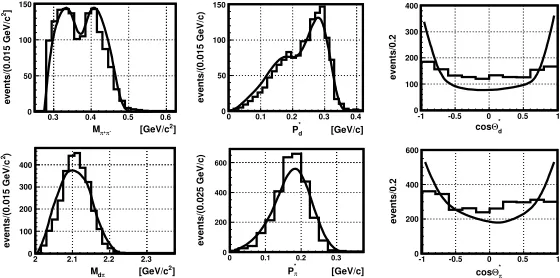
3.3 Reactionnp→ d pi+π−
The reaction np → dπ+π− is characterized by a fusion of neutron and proton into the
deuteron. Thus it seems to be reasonable to take into account OBE diagrams shown in Fig.6 to describe the experimental data of this reaction:
n
p
d
-π
+ π
n p
n
p d
-π
+ π
n p
n
p
d -π
+ π
n p
Figure 6. Diagrams corresponding to the reactionnp → dπ+π−
in the framework of the one baryon exchange (OBE) model
In Fig. 7 one can see clear peaks in the masses ofπ+π−-combinations close to∼350 and∼400 MeV/c2 (so called ABC and DEF anomaly). These effects, momenta and mass distributions are good reproduced within framework of OBE model. But the theoretical curve for angular distributions of deuteron and pions are too sharp. It is necessary to develop further the OBE model to improve the description of the experimental data.
Mean 0.3693 RMS 0.05266
] 2 [GeV/c
-π
+
π
M
0.3 0.4 0.5 0.6
]
2
events/(0.015 GeV/c
0 50 100 150
Mean 0.3693 RMS 0.05266
Mean 0.2297 RMS 0.06995
[GeV/c] d * P
0 0.1 0.2 0.3 0.4
events/(0.015 GeV/c)
0 50 100 150
Mean 0.2297 RMS 0.06995
Mean -0.01352 RMS 0.6075
d *
Θ
cos
-1 -0.5 0 0.5 1
events/0.2
0 100 200 300 400
Mean -0.01352 RMS 0.6075
Mdpi Entries 18 Mean 2.109 RMS 0.0376
] 2 [GeV/c
π d M
2 2.1 2.2 2.3
)
2
events/(0.015 GeV/c
0 100 200 300 400
Mdpi Entries 18 Mean 2.109 RMS 0.0376
Ppi Entries 13 Mean 0.1724 RMS 0.0458
[GeV/c]
π * P
0 0.1 0.2 0.3
events/(0.025 GeV/c)
0 200 400 600
Ppi Entries 13 Mean 0.1724 RMS 0.0458
Mean -0.01492 RMS 0.5986
π *
Θ
cos
-1 -0.5 0 0.5 1
events/0.2
0 200 400 600
Mean -0.01492 RMS 0.5986
Figure 7.The distributions for the reactionnp→dπ+π−
atP0=1.73 GeV/c. Solid line – calculations
As far as dipion masses concerned from the reactionnp→dπ+π−atP
0=2.23 GeV/c, it
is difficult to say that ABC and DEF bumps are confidently observed. Obviously it is due to insufficient statistics.
The details of the study of this reaction were presented in [9].
4 3
π
and 4
π
production
The reactionsnp→ ppπ+π−π−,np→ ppπ+π−π−π0andnp→npπ+π+π−π−were studied at
the momenta of incident neutrons P0=3.83, 4.42 and 5.20 GeV/c. The cross sections of the
considered reactions were presented in [2].
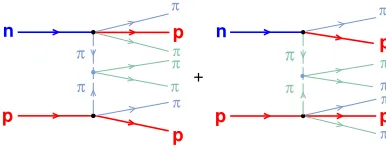
The following diagrams were taken into account to calculate the characteristics of the reactionsnp→NN3πandnp→NN4π:
n
p
N
N π
π π
a)
π
n
p
N
N π
π π
c)
π n
p N
N
π π π
b)
π
Figure 8.Diagrams of OPER model for the reactions of 3πand 4πmeson production in np interactions
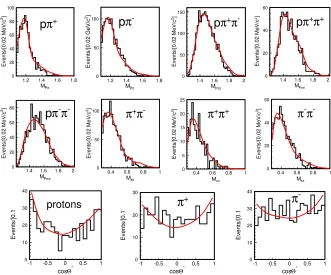
4.1 Reactionnp→ ppπ+π−π−
The results of the calculations using OPER model for the reactionnp→ppπ+π−π−are shown in Fig.9for the data atP0=5.2 GeV/c.
Entries 11582
] 2 [GeV/c
π
N M
1.2 1.4 1.6 1.8 2
)
2
Events/(0.02 GeV/c
0 500 1000
Entries 11582 M(p,pi+)
+ π
p
Entries 23164
] 2 [GeV/c
π
N M
1.2 1.4 1.6 1.8 2
)
2
Events/(0.02 GeV/c
0 500 1000
Entries 23164
M(p,pi-)
-π
p
Entries 23164
] 2 [GeV/c
π π
N M
1.5 2
)
2
Events/(0.02 GeV/c
0 200 400 600 800
Entries 23164
M(p,pi+,pi-)
-π + π
p
Entries 11582
] 2 [GeV/c
π π
M
0.4 0.6 0.8 1 1.2
)
2
Events/(0.02 GeV/c
0 200 400 600
Entries 11582
M(pi+,pi-)
-π + π
Entries 5791
] 2 [GeV/c
π π
M
0.4 0.6 0.8 1 1.2
)
2
Events/(0.02 GeV/c
0 100 200 300
Entries 5791
M(pi-,pi-)
-π
-π
Entries 5791
] 2 [GeV/c
π π π
M
0.5 1 1.5
)
2
Events/(0.02 GeV/c
0 50 100 150 200 250
Entries 5791
M(pi+,pi-,pi-)
-π -π + π
Entries 11582
*
Θ
cos
-1 -0.5 0 0.5 1
Events/0.1
0 500 1000 1500 2000
Entries 11582
cosT*(p)
protons
Entries 5791
*
Θ
cos
-1 -0.5 0 0.5 1
Events/0.1
0 100 200 300 400 500
Entries 5791
cosT*(pi+)
+ π
Entries 11582
*
Θ
cos
-1 -0.5 0 0.5 1
Events/0.1
0 200 400 600 800 1000
Entries 11582
cosT*(pi-)
-π
Figure 9. The distributions for the reactionnp→ ppπ+π−π−
at P0=5.20 GeV/c. Solid line –
One can see a good agreement between the experimental data and theoretical calculations. Also a good description was obtained for this reaction at the incident momenta P0=3.83 and
4.42 GeV/c. The details of the study of this reaction were presented in [9].
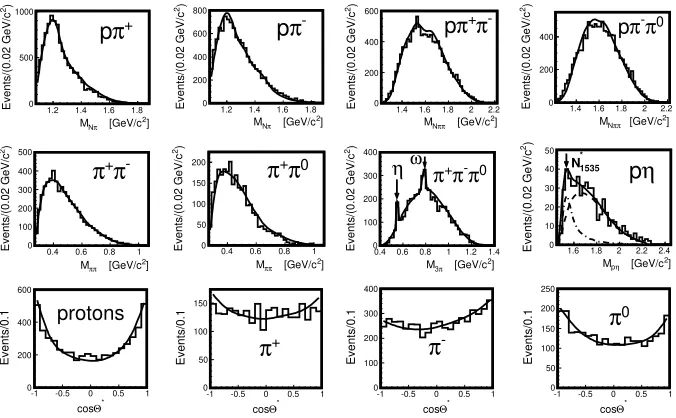
4.2 Reactionnp→ ppπ+π−π−π0
The results of the calculations using OPER model for the reactionnp → ppπ+π−π−π0 are
shown in Fig.10for the data atP0=5.20 GeV/c.
Entries 10668
] 2 [GeV/c π N M
1.2 1.4 1.6 1.8
)
2
Events/(0.02 GeV/c 0 500 1000
Entries 10668
M(p,pi+)
+
π
p
Entries 10668
] 2 [GeV/c π N M
1.2 1.4 1.6 1.8
)
2
Events/(0.02 GeV/c 0 200 400 600 800
Entries 10668
M(p,pi-)
-π
p
Entries 10668
] 2 [GeV/c π π N M
1.4 1.6 1.8 2 2.2
)
2
Events/(0.02 GeV/c 0 200 400 600
Entries 10668
M(p,pi+,pi-)
-π
+π
p
Entries 10668
] 2 [GeV/c π π N M
1.4 1.6 1.8 2 2.2
)
2
Events/(0.02 GeV/c 0 200 400
Entries 10668
M(p,pi-,pi0) 0 π -π p
Entries 5334
] 2 [GeV/c π π M
0.4 0.6 0.8 1
)
2
Events/(0.02 GeV/c 0 100 200 300 400 500
Entries 5334
M(pi+,pi-)
-π
+π
Entries 2667
] 2 [GeV/c π π M
0.4 0.6 0.8 1
)
2
Events/(0.02 GeV/c 0 50 100 150 200
Entries 2667
M(pi+,pi0)
0
π
+π
Entries 5334
] 2 [GeV/c π 3 M
0.4 0.6 0.8 1 1.2 1.4
)
2
Events/(0.02 GeV/c 0 100 200 300 400
Entries 5334
M(pi+,pi-,pi0) 0 π -π + π ηω
Entries 546
] 2 [GeV/c η p M
1.6 1.8 2 2.2 2.4
)
2
Events/(0.02 GeV/c 0 10 20 30 40 50
Entries 546
M(p,eta)
η
p
1535 * NEntries 5334
*
Θ
cos
-1 -0.5 0 0.5 1
Events/0.1
0 200 400 600
Entries 5334
cosT*(p)
protons
Entries 2667
*
Θ
cos
-1 -0.5 0 0.5 1
Events/0.1
0 50 100 150
Entries 2667
cosT*(pi+)
+
π
Entries 5334
*
Θ
cos
-1 -0.5 0 0.5 1
Events/0.1 0 100 200 300 400
Entries 5334
cosT*(pi-)
-π
Entries 2667
*
Θ
cos
-1 -0.5 0 0.5 1
Events/0.1 0 50 100 150 200 250
Entries 2667
cosT*(pi0)
0
π
Figure 10. The distributions for the reactionnp → ppπ+π−π−π0 at P
0=5.20 GeV/c. Solid line –
calculations using OPER model
One can see a good agreement between the experimental data and theoretical calcula-tions. A clear signals ofη0andω0mesons production are observed at the masses ofπ+π−π0
combinations. To describe these peaks, the following diagrams were taken into account:
n p p p -π η 0 π b) 1535 *+ N n p p p -π η 0 π a) 1535 *+ N n p p p 0 π ω 0 ρ -π d) n p p p ω + π -ρ -π c)
Figure 11.Diagrams of OPER model for the reactionsnp→ppπ−η0andnp→ppπ−ω0
The diagrams a) and b) describeη0-meson production through the production ofN∗
1535
resonance inπNinteraction with the consequent decayN∗
1535→Nη
0. The "hanged" diagrams
c) and d) describeω0meson production due to π-ρ interaction.
The results at P0=4.42 GeV/c and P0=3.83 GeV/c are not presented due to a poor
statis-tics. But OPER model also described satisfactorily the experimental distributions and the signals ofη0andω0meson production at these energies.
4.3 Reactionnp→ npπ+π+π−π−
We have also got a good description of the characteristics of the reactionnp→npπ+π+π−π−.
The details of this study were presented in [9].
5 5
π
and 6
π
production
The reactionsnp→ ppπ+π+π−π−π−,np→ ppπ+π+π−π−π−π0andnp→npπ+π+π+π−π−π− were studied at the momenta of incident neutrons P0=5.20 GeV/c. The cross sections of these
reactions were presented in Tab.1.
Table 1.Cross-sections of 5πand 6πmeson production
reaction cross-section (µb)
np→ ppπ+π+π−π−π− 18.7±4.1 np→ ppπ+π+π−π−π−π0 3.6±1.0 np→npπ+π+π+π−π−π− 3.7±1.0
The only reaction np → ppπ+π+π−π−π− was studied in details. Other reactions (6π production) have had too poor statistics.
The following diagrams were taken into account to calculate the characteristics of the reaction of 5π-meson production:
n
p
p
p
π
π π
-π
π
π
π
n
p
p p
π
π
π
π
π
π
π
+
Figure 12.Diagrams of OPER model for the reactionnp→ppπ+π+π−π−π−
Fig.13shows a good agreement between the experimental data and theoretical calcula-tions by means of OPER-model.
6 Conclusion
Multiπ-meson production in np-interactions is provided by the excitation and decay of∆∗ -and N∗-resonances (taken from PWA and GIM).
The large peripherality of the secondary hadrons leads to the idea of using some exchange models (π, P, etc.)
consid-DelPP
π P M
1.2 1.4 1.6 1.8
]
2
Events/[0.02 MeV/c
0 20 40 60 80 100
DelPP +
π
p
Del0
π P M
1.2 1.4 1.6 1.8
]
2
Events/[0.02 GeV/c
0 50 100
Del0
-π
p
Ppipi1
π π P M
1.4 1.6 1.8 2
]
2
Events/[0.02 MeV/c
0 50 100 150
Ppipi1
-π
+π
p
Ppipi2
π π P M
1.4 1.6 1.8 2
]
2
Events/[0.02 MeV/c
0 20 40 60
Ppipi2 +
π
+π
p
Ppipi3
π π P M
1.4 1.6 1.8 2
]
2
Events/[0.02 MeV/c
0 20 40 60 80
Ppipi3
-π
-π
p
pipi1
π π M
0.4 0.6 0.8 1
]
2
Events/[0.02 MeV/c
0 50 100
pipi1
-π
+π
pipi2
π π M
0.4 0.6 0.8 1
]
2
Events/[0.02 MeV/c
0 5 10 15 20 25
pipi2
+
π
+π
pipi3
π π M
0.4 0.6 0.8 1
]
2
Events/[0.02 MeV/c
0 20 40 60
pipi3
-π
-π
CSTP
*
Θ
cos
-1 -0.5 0 0.5 1
Events/[0.1
0 10 20 30 40
CSTP protons
CSTpip
*
Θ
cos
-1 -0.5 0 0.5 1
Events/[0.1
0 10 20 30
CSTpip
+
π
CSTpim
*
Θ
cos
-1 -0.5 0 0.5 1
Events/[0.1
0 10 20 30 40
CSTpim
-π
Figure 13. The distributions for the reactionnp → ppπ+π+π−π−π−
at P0=5.20 GeV/c. Solid line –
calculations using OPER model
OPER-model allows one to get a good description of the characteristics from 2 up to 6 pion production in np interactions. At lower energies ( P0<3 GeV/c) it is necessary to take into account another mechanism of the reactions (such as OBE-model).
(OPER+OBE)-model can be used as an efficient tool to simulate various reactions of hadron interactions: NICA project, HADES set-up, intranuclear interactions (hA and AA).
References
[1] A.P.Gasparian et al. Prib.Tekh.Eksp.,77, 2, 37 (1977) [2] C.Besliu et al. Sov.J.Nucl.Phys.43, 565 (1986)
[3] J.P. Berge, F.T. Solmitz and H.D. Taft, Rev.Sci.Instrum.32, 338 (1961) [4] L. Alvarez-Ruso, E. Oset, E. Hernandez. NP A633, 519 (1998) [5] Xu Cao, Bing-Song Zou and Hu-Shan Xu. PR C81, 065201 (2010) [6] L.A. Ponomarev, Sov.J.Part.Nucl.7, 70 (1976)
[7] A.P. Jerusalimov, arXiv:1203.3330[nucl-th] (2012). A.P. Jerusalimov, arXiv:1208.3982[nucl-th] (2012)
[8] A.B. Kaidalov and A.F. Nilov, Sov.J.Nucl.Phys. 41, 490 (1985). Sov.J.Nucl.Phys.52, 1060 (1990)