_____________________________________________________________________________________________________ *Corresponding author: E-mail: [email protected];
ISSN: 2231-0614, NLM ID: 101570965
SCIENCEDOMAIN international
www.sciencedomain.org
Relationship between the Inclination of Adjacent
Teeth Caused by Vertical Malposition of the Second
Primary Molar – in Relation to Development Stage of
First Molar
Shoji Takahashi
1*, Shigeru Watanabe
1, Koji Watanabe
1, Akihiro Nakamura
1,
Reina Odai
1and Takashi Sasabe
11
Department of Human Development and Fostering, Division of Pediatric Dentistry, Shool of Dentistry, Meikai University,Japan.
Authors’ contributions
This work was carried out in collaboration among all authors. Authors ST and SW designed the study and wrote the protocol. Authors SW and KW wrote the first draft of the manuscript. Author AN managed the literature searches. Authors RO and TS analyzed the data. All authors read and approved the final manuscript.
Article Information
DOI: 10.9734/BJMMR/2017/29480 Editor(s): (1) Joao Paulo Steffens, Department of Stomatology, Federal University of Parana, Brazil. (2)Manuele Mancini, Department of Restorative Dentistry and Endodontics, University of Rome “Tor Vergata,” Rome, Italy. (3)Masahiro Hasegawa, Department of Orthopaedic Surgery, Mie University Graduate School of Medicine, 2-174 Edobashi, Tsu City, Mie, 514-8507,Japan. Reviewers: (1) Bhavesh D. Trivedi, L. N. Mithila University, India. (2)Jorge Paredes Vieyra, Autanoma University of California, Mexico. (3)V. Rajashekar Reddy, Rajiv Gandhi University of Health Sciences, India. Complete Peer review History:http://www.sciencedomain.org/review-history/17162
Received 14th September 2016 Accepted 22nd November 2016 Published 8th December 2016
ABSTRACT
Aims: Mesial inclination of first molar caused by vertical malposition of the second primary molar is
often untreated but this may create severe problems. To obtain an objective guideline for treatment of such cases, the relationship between degree of mesial inclination and developmental phase of first molar was analyzed.
Study Design: Ten boys and six girls who exhibited vertical malposition of the second primary
molar were analyzed. At their first visit oral checklists and panoramic radiographs were obtained.
Place and Duration of Study: Department of Human Development & Fostering, Division of
Pediatric Dentistry, School of Dentistry, Meikai University.
Methodology: Oral checklists were used at their first visit and panoramic radiographs were taken
by Veraview Epocs X-550 (Morita/Kyoto). The radiographs were output as films by DRY PIX7000 (Fujifilm Medical/Tokyo). Examinations were conducted on the degree of development of the second bicuspid germ affected by a submerged second deciduous tooth, the presence of malposition, the degree of development of first molar and presence of tooth root resorption in the second primary molar, based on the panoramic radiographs.
Results: A significant positive correlation occurred between (i) second primary molar space and
degree of formation of the first molar (p<0.01); (ii) the angle between tooth axes of the first primary molar and first molar and amount of formation of the first molar (p<0.05); The vertical positional relationship between the second primary molar and the second bicuspid germ Proximity values showed larger values on the affected side; Retarded formation by 54% was recognized in the formation of the second bicuspid.
Conclusion: The prognosis for treatment success may depend on the degree of first molar
formation.
Keywords: Malposition; second primary molar; first molar; radiograph.
1. INTRODUCTION
Deciduous molars with vertical malposition include impacted deciduous teeth, in which the tooth crown stays at the oral submucosa or in the jawbone without erupting even after a certain period of time of the eruption, and submerged deciduous teeth, which are located at the gingival margin or a position lower than that from any cause [1,2]. With its relatively high emergence frequency of submerged deciduous teeth, ranging from 1 to 9% [3-5], attention must be paid to the influence on successive permanent teeth, inclination of adjacent teeth and extrusion of opposing teeth [6-8]. However, submerged deciduous teeth are often overlooked and left untreated, and many cases have been reported where they deteriorate over time, causing difficulty of treatment if appropriate care wasn’t provided in the initial stage [9-12].
Even though many clinical reports regarding impacted or submerged deciduous teeth have been made, most of them are nothing more than an introduction of treatment methods for the malposition of deciduous teeth and inclination in successive permanent teeth associated with the malposition. In this study, we attempted to analyze the degree of mesial inclination of teeth adjacent to the second primary molar caused by incorrect vertical position in relation to the developmental stage of the first molar, aiming to obtain more objective guidelines for diagnosis and treatment of such cases.
2. METHODOLOGY
Among diagnosed children who had visited the pediatric dentistry outpatient department of this
university, 16 of the affected children (10 boys, 6 girls) were recruited who exhibited severe vertical malposition in the second primary molar based on the criterion advocated by Brearley et al. [6]. The average age of these cases at the time of diagnosis was 7 years and 5 months.
2.1 Examination of Cases
As the data for the analyses, oral checklists were used at their first visit and panoramic radiographs, which were taken by Veraview Epocs X-550 (Morita/Kyoto) and output as films by DRY PIX7000 (Fujifilm Medical/Tokyo). Examinations were conducted on the degree of development of the second bicuspid germ affected by a submerged second deciduous tooth, the presence of malposition, the degree of development of first molar and presence of tooth root resorption in the second primary molar, based on the panoramic radiographs. We conducted the following analyses.
2.2 Quantitative Analysis on Tooth
Inclination
2.2.1 The relationship between the second primary molar space and amount of formation of the first molar
The degree of space narrowing (DSN) of the second primary molar was calculated according to the following equation:
DSN = 1 − 6
mesial contour of the first molar, the widest mesial contour of the second primary molar and the widest distal contour of the second primary molar, respectively (Fig. 1).
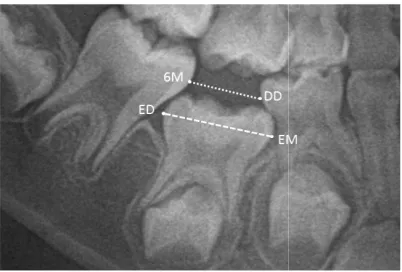
Fig. 1. The degree of space narrowing (DSN) DSN of the second primary molar was calculated by dividing the distance between DD and 6M to the
distance between EM and ED
The distance between DD and 6M corresponds to the mesiodistal width of the second primary molar tooth crown when the DSN value is zero and the shortage of space grows as the value increases.
Furthermore, the relationship between the DSN of the second primary molar and the amount of formation of the first molar by using Spearman’s rank-correlation coefficient were examined. Nolla’s stages of tooth development
used for evaluating the amount of formation of the first molar.
2.2.2 Time-dependent change in angle between tooth axes of the first primary molar and first molar
Defining the tooth axes for both teeth as the straight lines from the midpoint of the mesiodistal maximum diameter of the tooth crown to that of the distance between apices, respectively, the angle ABA between the extended lines was calculated (Fig. 2). The relationship between the obtained angle and amount of formation of the first molar was examined by using Spearman’s rank-correlation coefficient.
2.2.3 Relationship between the degree of second primary molar eruption and DSN
The subjects were classified into two groups for the second primary molar, namely the “partial
Takahashi et al.; BJMMR, 19(2): 1-9, 2017; Article
mesial contour of the first molar, the widest mesial contour of the second primary molar and the widest distal contour of the second primary
Fig. 1. The degree of space narrowing (DSN) DSN of the second primary molar was calculated by
dividing the distance between DD and 6M to the distance between EM and ED
The distance between DD and 6M corresponds width of the second primary molar tooth crown when the DSN value is zero and the shortage of space grows as the value
Furthermore, the relationship between the DSN of the second primary molar and the amount of sing Spearman’s correlation coefficient were examined. Nolla’s stages of tooth development [13]were used for evaluating the amount of formation of
dependent change in angle between tooth axes of the first primary
Defining the tooth axes for both teeth as the straight lines from the midpoint of the mesiodistal maximum diameter of the tooth crown to that of the distance between apices, respectively, the angle ABA between the extended lines was calculated (Fig. 2). The relationship between the obtained angle and amount of formation of the by using Spearman’s
Relationship between the degree of second primary molar eruption and
The subjects were classified into two groups for the second primary molar, namely the “partial
eruption group” and the “impaction group”, and the average values of both DSNs were compared. Based on the confirmation of eruption of either the cusp of the second primary molar or the part of the tooth crown by an oral checklist, it was determined whether the subjects fell under the category of “partial eruption” or “impaction”.
Fig. 2. The angle between tooth axes of the first primary molar and first molar
DO: midocclusal point of first primary molar. 6O: midocclusal point of first permanent molar. CA6, CAD: midpoint of mesiodistal diameter of the apices of
first permanent molar and first primary molar, respectively. Long axes of the adjacent teeth were determined by joining the points 6O and CA6, DO and
CAD and extending superiorly and inferiorly. The angle ABA formed by the convergence of these axes
2.2.4 Vertical positional relationship between second primary molar and second bicuspid germ
Proximity values (hereinafter refered to as PV) between the second primary molar and second bicuspid germ on the affected side an
the healthy side in the same jaw were compared. PV was calculated according to the following equation:
PV = 1 −
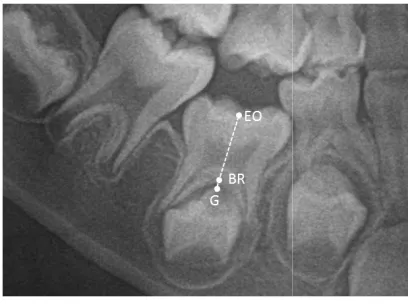
BR, G and EO indicate the branching point of the second primary molar tooth root, the intersection point of the extended straight line from EO to BR and second bicuspid germ, and the mesiodistal midpoint of the second primary molar occlusal surface, respectively (Fig. 3).
This means that the branching part of the second primary molar and second bicuspid germ is contact with each other when the PV is 1.
; Article no.BJMMR.29480
ction group”, and the average values of both DSNs were compared. Based on the confirmation of eruption of either the cusp of the second primary molar or the part of the tooth crown by an oral checklist, it was determined whether the subjects fell under
category of “partial eruption” or “impaction”.
The angle between tooth axes of the first primary molar and first molar (ABA) DO: midocclusal point of first primary molar. 6O: permanent molar. CA6, mesiodistal diameter of the apices of first permanent molar and first primary molar,
Long axes of the adjacent teeth were joining the points 6O and CA6, DO and CAD and extending superiorly and inferiorly. The
the convergence of these axes
Vertical positional relationship between second primary molar and second
Proximity values (hereinafter refered to as PV) between the second primary molar and second bicuspid germ on the affected side and that on the healthy side in the same jaw were compared. PV was calculated according to the following
BR, G and EO indicate the branching point of the second primary molar tooth root, the intersection point of the extended straight line from EO to BR and second bicuspid germ, and the mesiodistal midpoint of the second primary molar occlusal
At the same time, the relationship between the PV and the amount of formation of the second bicuspid on both sides was also examined. Nolla’s stages of tooth development were used for evaluating the amount of formation of the second bicuspid.
2.2.5 The amount of formation of the second bicuspid
The amounts of formation of the second bicuspid on the affected side and on the healthy side of the same jaw were compared. In this case, those among the subjects who had been affected on both right and left sides on the same jaw were excluded.
3. RESULTS AND DISCUSSION
3.1 Results
The correlation between the DSN and the amount of formation of the first molar is shown in a scatter diagram (Fig. 4). A significant correlation occurred between the two (p
When the amount of formation of the first molar was at 6th stage and 7th stage of Nolla’s tooth development, the DSN was at around 0.15 and 0.33 respectively.
Fig. 3. Proximity values (PV)
PV was calculated by dividing the distance between BR and G to the distance between EO and G
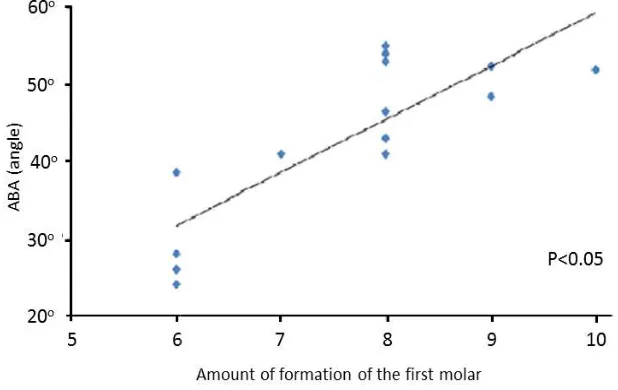
The correlation between the angle ABA and the amount of formation of the first molar is shown in a scatter diagram (Fig. 5). There was a significant correlation between the two (p<0.05).
At the same time, the relationship between the PV and the amount of formation of the second n both sides was also examined. Nolla’s stages of tooth development were used for evaluating the amount of formation of the
The amount of formation of the second
The amounts of formation of the second bicuspid affected side and on the healthy side of the same jaw were compared. In this case, those among the subjects who had been affected on both right and left sides on the same jaw were
SSION
The correlation between the DSN and the
amount of formation of the first molar is shown in a scatter diagram (Fig. 4). A significant
correlation occurred between the two (p<0.01). When the amount of formation of the first molar age and 7th stage of Nolla’s tooth development, the DSN was at around 0.15 and
Proximity values (PV)
by dividing the distance between BR and G to the distance between EO and G
The correlation between the angle ABA and the amount of formation of the first molar is
shown in a scatter diagram (Fig. 5). There was a significant correlation between the two
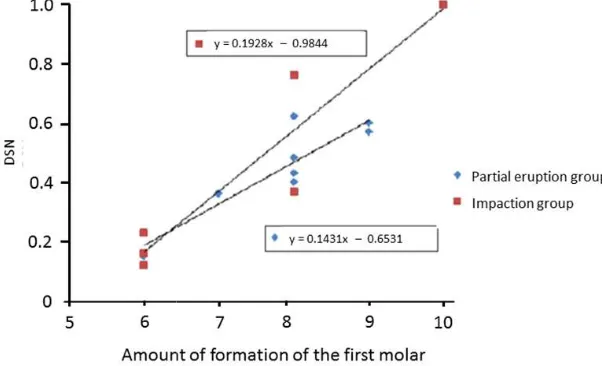
Sixteen of the subject teeth were categorized into two groups as the “partial eruption group and “impaction group”. By examining the relationships between the amount of formation of the first molar and the DSN of both groups on the scatter diagram (Fig. 6), the expression for the linear approximated curve proved to be y = 0.1431x – 0.6531 for the “partial eruption group” and y = 0.1928x – 0.9844 for the “impaction group”. In comparison with the slopes of the linear approximated curve of both groups, the slope of the “impaction group” was larger than that of the “partial eruption group”, showing a tendency for DSN to increase over time.
The comparison of PVs between the affected side and healthy side on the same jaw is shown in Table 1. Comparing 10 sites on the affected side of 10 of the qualified subjects with those on the healthy side, the impacted or submerged second primary molar and successive second bicuspid tooth germ tended to get closer than those cases on the healthy side, show
PV values in all sections on the affected side. As a result of examining the relationship between the PV and the amount of formation of the second bicuspid by using a scatter diagram (Fig. 7), the linear curve was expressed as y = 0.0014x + 0.8634 on the affected side and y = 0.0142x + 0.5768 on the healthy side, showing larger values on the healthy side than the affected side in comparison with the slope between the two sides. While the PV increased on the healthy side over time, it did not change much on the affected side.
Table 1. Comparison of PV of the affected/ healthy side on the same jaw
Case Affected side Normal side
1 0.86 0.72 2 0.84 0.71 4 (Right) 0.86 * 5 0.82 0.60 6 0.85 0.69 7 0.84 0.55 13 0.86 0.62 14 0.88 0.69 15 (Upper) 0.92 0.62 15 (Lower) 0.86 0.65 16 0.84 0.63
*In case4, both sides of mandibular second primary molar were affected, and analysed only the right side.
Left side was impossible to analyse because of the malposition of the succedaneous
Sixteen of the subject teeth were categorized partial eruption group”
. By examining the relationships between the amount of formation of the first molar and the DSN of both groups on the tter diagram (Fig. 6), the expression for the linear approximated curve proved to be y = 0.6531 for the “partial eruption group” 0.9844 for the “impaction group”. In comparison with the slopes of the both groups, the slope of the “impaction group” was larger than that of the “partial eruption group”, showing a tendency for DSN to increase over time.
The comparison of PVs between the affected side and healthy side on the same jaw is shown Comparing 10 sites on the affected side of 10 of the qualified subjects with those on the healthy side, the impacted or submerged second primary molar and successive second bicuspid tooth germ tended to get closer than those cases on the healthy side, showing larger PV values in all sections on the affected side. As a result of examining the relationship between the PV and the amount of formation of the second bicuspid by using a scatter diagram (Fig. 7), the linear curve was expressed as y =
-.0014x + 0.8634 on the affected side and y = 0.0142x + 0.5768 on the healthy side, showing larger values on the healthy side than the affected side in comparison with the slope between the two sides. While the PV increased did not change
Comparison of PV of the affected/ healthy side on the same jaw
Normal side 0.72 0.71 * 0.60 0.69 0.55 0.62 0.69 0.62 0.65 0.63
*In case4, both sides of mandibular second primary molar were affected, and analysed only the right side.
Fig. 4. Correlation between DSN and amount of formation of the first molar A significant correlation occurred between
Fig. 5. Correlation between ABA and amount of formation of the first molar There was a significant correlation between
Comparing the amount of formation of the second bicuspid as a successive permanent tooth for 13 teeth of 12 of the subjects, retarded formation was recognized in 7 teeth (54%) among them. Adding a further two teeth in which the tooth germ was not recognized, possible adverse effects of malposition of the second primary molar on successive permanent tooth germ formation has been suggested in 9 out of 15 teeth with a ratio of 60%.
Takahashi et al.; BJMMR, 19(2): 1-9, 2017; Article
Fig. 4. Correlation between DSN and amount of formation of the first molar A significant correlation occurred between the DSN and the amount of formation of the first molar
Correlation between ABA and amount of formation of the first molar There was a significant correlation between the angle ABA and the amount of formation of the first molar
(p<0.05)
Comparing the amount of formation of the second bicuspid as a successive permanent tooth for 13 teeth of 12 of the subjects, retarded formation was recognized in 7 teeth (54%)
among them. Adding a further two teeth in was not recognized,
possible adverse effects of malposition of the second primary molar on successive
permanent tooth germ formation has been suggested in 9 out of 15 teeth with a ratio of
3.2 Discussion
3.2.1 Measurements on panoramic radio graphs
While panoramic radiographs have frequently been used for screening as a dental examination measure, it is difficult to perform measurements based on absolute amount due to its less standard property than that of cephalometric radiographs. Even with the recent remarkable
; Article no.BJMMR.29480
Fig. 4. Correlation between DSN and amount of formation of the first molar
the DSN and the amount of formation of the first molar (p<0.01)
Correlation between ABA and amount of formation of the first molar the angle ABA and the amount of formation of the first molar
panoramic
improvement in sharpness of digitalized images, quantification is believed to be difficult.
Rejebian [14] has reported that reliable diagnosis is possible in mixed dentition periods after examining the enlargement ratio of each tooth based on comparisons of actual measured lengths of plaster models and removed bicuspid teeth with measurements on the films. Alpern [15] has also reported similar results by
Fig. 6. Relationship between DSN and the amount of formation of the first molar of two groups, ‘Partial eruption’ and ‘complete disappearance’
By examining the relationships between the amount of formation of the first molar and the DSN of
eruption group” and “impaction group”, the expression for the linear approximated curve proved to be y = 0.1431x – 0.6531 for the “partial eruption group” and y = 0.1928x
Fig. 7. Relationship between PV and the amount of forma
The linear curve was expressed as y =
healthy side, showing larger values on the healthy side than the affected side in
improvement in sharpness of digitalized images, quantification is believed to be difficult.
Rejebian [14] has reported that reliable diagnosis is possible in mixed dentition periods after atio of each tooth based on comparisons of actual measured lengths of plaster models and removed bicuspid teeth with measurements on the films. Alpern [15] has also reported similar results by
performing a measurement using a dry skull. It has also been reported that angle measurements on panoramic radiograph films had good correlation with those on lateral cephalometric radiographs [16]. For convenience in a clinical study, Becker et al. [7-9] have reported that results with high reliability were obtained in quantitative measurements of various irregularities caused by submerged second primary molar by using panoramic radiographs.
Relationship between DSN and the amount of formation of the first molar of two groups, ‘Partial eruption’ and ‘complete disappearance’
between the amount of formation of the first molar and the DSN of
the expression for the linear approximated curve proved to be y = 0.1431x 0.6531 for the “partial eruption group” and y = 0.1928x – 0.9844 for the “impaction group”
Fig. 7. Relationship between PV and the amount of formation of the second premolar of the affected/ normal side
he linear curve was expressed as y = -0.0014x + 0.8634 on the affected side and y = 0.0142x + 0.5768 on the healthy side, showing larger values on the healthy side than the affected side in comparison with the slope
between the two sides
performing a measurement using a dry skull. It ported that angle measurements on panoramic radiograph films had good correlation with those on lateral cephalometric radiographs [16]. For convenience in a clinical 9] have reported that
results with high reliability were obtained in quantitative measurements of various
irregularities caused by submerged second primary molar by using panoramic radiographs.
Relationship between DSN and the amount of formation of the first molar of two groups,
between the amount of formation of the first molar and the DSN of the “partial the expression for the linear approximated curve proved to be y = 0.1431x
0.9844 for the “impaction group”
tion of the second premolar of the
Takahashi et al.; BJMMR, 19(2): 1-9, 2017; Article no.BJMMR.29480
As all of the digitized panoramic radiographs of the subject cases in the study were taken with the same equipment under the same conditions and the analysis was performed based on formulas expressed by proportions, it is believed that quantitative measurements were performed with reliability.
3.2.2 Vertical malposition
Among the children who were the subjects in the study and had severe vertical malposition in the second primary molar, the patient of the earliest case visited this department for the first time on March 2001 and another patient of the latest case on October 2011. Judging from about 5,400 new patients who visited this department during the period, the expression rate of severe vertical malposition in the second primary molar is assumed to be approximately 0.33% in this department. Messer et al. [10] have reported 12 cases of severe malposition in the second primary molar observed among 1,641 subject patients, showing a slightly higher value than that of our result.
The frequency of development of submerged deciduous tooth has been reported to be higher in Caucasians than in Black and Asian people by Albers [17]. With no difference in the frequency between males and females reported in epidemiological studies until now [17], it has been reported that it appears far more frequently in lower deciduous molars among other teeth, especially most frequently in the first primary molar[3-5].
3.2.3 Adverse effects on tooth row occlusion
The mean age at the initial visit of the 16 affected children for this study was 7 years and 5 months ± 23 months. On the other hand, the second primary molar is considered to erupt at around 2 years and 5 months in the upper jaw and 2 years and 3 months in the lower jaw. Considering the divergence of approximately 5 years between the two, the abnormality may have been left untreated for a long period of time.
Classification of Nolla’s tooth development is one of the numerical means of evaluating tooth development and is used in daily clinical practice in pediatric dentistry. Considering the results of our present study, the DSN was at around 0.15 and 0.33 when the amount of formation of the first molar was at 6th and 7th stage of Nolla’s tooth development, respectively. When the
eruption space for successive second bicuspid has a width of around 6.8 mm on average, it may be believed that the DSN may be allowed up to around 0.34 since about 3.5 mm is allowable as a loss for the average mesiodistal width of 10.3 mm of the second primary molar. From these results, it is inferred that the available arch space for eruption for the second bicuspid is unlikely to run short as long as the amount of formation of the first molar is at around the 7th stage, or in other words until a tooth crown or one-third of tooth root is completed. On the other hand, it was believed that failure may be more likely to occur in replacement of lateral segment teeth due to lack of available arch space for the eruption for the second bicuspid if the amount of formation of the first molar was at 7th or higher stage.
By classifying second primary molars at incorrect position into two groups, the “partial eruption group” and the “impaction group”, and performing similar examinations on their changes over time, the result showed that the inclination of the linear approximated curve, in other words, the speed of aggravation in the eruption position grew larger in the “impaction group” than in the “partial eruption group”, indicating a tendency of difference in the DSN between the two groups to increase over time. It has also indicated that the more submerged is a second primary molar with vertical malposition, the more is it likely to aggravate over time, causing various subsequent symptoms since the completely impacted second primary molar is located lower than those partially erupted.
3.2.4 Prevention of malocclusion
Vertical malposition of a second primary molar induces two major problems to occlusion. One is inclination of an adjacent first molar, and the other is defective development of a subsequent second bicuspid.
For second primary molars, it was also believed to be necessary to discover and diagnose as quickly as possible and to begin treatments since malposition in the second primary molar may be more likely to adversely affect the formation of the second bicuspid germ and eruption. For example, a submerged second primary molar induces imperfect development of the second bicuspid. In case submerged second primary molar was found, it should be removed, and then, a distal shoe space maintainer could be applied.
As Wang CY et al. [1] and Gündüz K et al. [2] reported, primary tooth impaction is quite rare hence the number of the child patient who took part in this study was not necessarily enough, so the authors should keep making efforts to increase the number of the data.
Dentists should evaluate and diagnose malocclusion in children to guide their development of occlusion normal. Though there is a limit to evaluate three-dimensional positional relation of the teeth in a two-dimensional radiograph, dentists should minimize exposure of child patients. With those circumstances, it was suggested that the present study will contribute to performing occlusal guidance.
4. CONCLUSION
A correlation has been recognized between the decrease in space for the second primary molar caused by submerged deciduous tooth and the amount of formation of the first molar. It has been suggested that it may be possible to predict prognosis with treatment based on the degree of the first molar formation.
CONSENT
All authors declare that written informed consent was obtained from the parents of the patient for publication of this paper and accompanying images.
ETHICAL APPROVAL
This study was conducted after obtaining approval from the ethical committee of Meikai University School of Dentistry (A1118) and from the parents of the patients.
COMPETING INTERESTS
Authors have declared that no competing interests exist.
REFERENCES
1. Wang CY, Wu WC, Huang CS. A second deciduous molar impacted in right maxillary sinus: A long-term follow-up. Chang Gung Med J. 2000;23:788-93. 2. Gündüz K, Muğlali M, Inal S. Total
impaction of deciduous maxillary molars: Two case reports. J Contemp Dent Pract. 2007;8:64-71.
3. Pindborg JJ. Pathology of the dental hard tissues. Copenhagen: Munksgaard; 1970. 4. Joanna D, Norman T. The etiology,
prevalence, and sequelae of infraocclusion of primary molars. ASDC J Dent Child. 1991;58:481-3.
5. Kennedy DB. Treatment strategies for ankylosed primary molars. Eur Arch Paediatr Dent. 2009;10:201-10.
6. Brearley L, McKibben H. Ankylosis of primary molar teeth. 1. Prevalence and characteristics. ASDC J Dent Child. 1973;40:54-63.
7. Becker A, Reuben MK. The effects of infraocclusion: Part 1. Tilting of the adjacent teeth and local space loss. Am J Orthod Dentfac Orthop. 1992;102:257-64. 8. Becker A, Reuben MK. The effects of
infraocclusion: Part 2. The type of movement of the adjacent teeth and their vertical development. Am J Orthod Dentfac Orthop. 1992;102:302-9.
9. Becker A, Reuben MK. The effects of infraocclusion: Part 3. Dental arch length and the midline. Am J Orthod Dentfac Orthop. 1992;102:257-64.
10. Messer LB, Cline JT. Ankylosed primary molars: Results and treatment recommendations from an eight-year longitudinal study. Ped Dent. 1980;2:37-47,.
11. Biederman W. Etiology and treatment of tooth ankylosis. Am J Orthod. 1962;48: 670-84.
12. Krakowiak FJ. Ankylosed primary molars. J Dent Child. 1978;45:288-92.
13. Nolla CM. The development of the permanent teeth. J Dent Child. 1960;27:254-66.
Takahashi et al.; BJMMR, 19(2): 1-9, 2017; Article no.BJMMR.29480
15. Alpern MC. Analysis of panoramic cephalometrics using a skeletal cephalostat. Angle Orthod. 1979;49:110-20. 16. Altonen M, Haavikko K, Mattila K.
Development position of lower third molar
in relation to gonial angle and lower se-cond molar. Angle Orthod. 1977;4:249-55. 17. Albers DD. Ankylosis of teeth in the
developing dentition. Quint Int. 1986;17: 303-8.
_________________________________________________________________________________
© 2017 Takahashi et al.; This is an Open Access article distributed under the terms of the Creative Commons Attribution License (http://creativecommons.org/licenses/by/4.0), which permits unrestricted use, distribution, and reproduction in any medium, provided the original work is properly cited.
Peer-review history: