Inducing Fine-Grained Semantic Classes via
Hierarchical and Collective Classification
Altaf Rahman and Vincent Ng
Human Language Technology Research Institute University of Texas at Dallas
{altaf,vince}@hlt.utdallas.edu
Abstract
Research in named entity recognition and mention detection has typically involved a fairly small number of semantic classes, which may not be adequate if seman-tic class information is intended to sup-port natural language applications. Moti-vated by this observation, we examine the under-studied problem of semantic sub-type induction, where the goal is to au-tomatically determine which of a set of 92 fine-grained semantic classes a noun phrase belongs to. We seek to improve the standard supervised approach to this prob-lem using two techniques: hierarchical classification and collective classification. Experimental results demonstrate the ef-fectiveness of these techniques, whether or not they are applied in isolation or in combination with the standard approach.
1 Introduction
Semantic class determination refers to the task of classifying a noun phrase (NP), be it a name or a nominal, as one of a set of pre-defined se-mantic classes. A sese-mantic class classifier is a basic text-processing component in many high-level natural language processing (NLP) applica-tions, including information-extraction (IE) sys-tems and question-answering (QA) syssys-tems. In recent years, supervised semantic class determi-nation has been tackled primarily in the context of (1) coreference resolution (e.g., Ng (2007), Huang et al. (2009)), where semantic classes are induced and subsequently used to disallow coreference be-tween semantically incompatible NPs, and (2) the
mention detection task in the ACE evaluations
(e.g., Florian et al. (2004; 2006)), where the goal is to identify the boundary of a mention (i.e., a noun phrase that belongs to one of the pre-defined ACE semantic classes), its mention type (e.g., pro-noun, name), and its semantic class. The output of a mention detector is then used by downstream IE components, which typically include a coref-erence resolution system and a relation extraction system. Owing in part to its potentially large in-fluence on downstream IE components, accurate semantic class determination is crucial.
Over the years, NLP researchers have focused on a relatively small number of semantic classes in both NE recognition and mention detection: seven classes in the MUC-6 and MUC-7 NE recognition task, four classes in the CoNLL 2002 and 2003 NE recognition shared task, and seven classes in the ACE 2005 mention detection task. Given that one of the uses of semantic class information is to support NLP applications, it is questionable whether this purpose can be adequately served by such a small number of semantic classes. For ex-ample, given the question “Which city was the first Olympic Games held in?”, it would be help-ful for a QA system to know which NEs are cities. However, virtually all of the existing NE recog-nizers and mention detectors can only determine whether an NE is a location or not.
IE systems in the ACE and AQUAINT programs. These 92 semantic subtypes have been used to manually annotate the NPs in the BBN Entity Type
Corpus (Weischedel and Brunstein, 2005). Given
the availability of this semantic subtype-annotated corpus, we adopt a supervised machine learn-ing approach to semantic subtype determination. Specifically, given (the boundary of) an NP, we train a classification model to determine which of the 92 semantic subtypes it belongs to.
More importantly, we seek to improve the stan-dard approach to semantic subtype induction de-scribed above by proposing two techniques. The first technique, collective classification, aims to address a common weakness in the standard su-pervised learning paradigm, where a classifier classifies each instance independently of the oth-ers and is unable to exploit any relational informa-tion between a pair (or a subset) of the instances that may be helpful for classification. The sec-ond technique, hierarchical classification, exploits the observation that these 92 semantic subtypes can be grouped into a smaller number of coarse-grained semantic types (henceforth semantic su-pertypes). With this two-level hierarchy, learning can proceed in a sequential fashion: given an NP, we first determine its semantic supertype and then classify it as one of the semantic subtypes that fall under the predicted supertype in the hierar-chy. Empirical results show that these two tech-niques, when applied in isolation to the standard learning approach to subtype induction, can sig-nificantly improve its accuracy, and the best result is achieved when they are applied in combination. The rest of the paper is organized as follows. Section 2 provides an overview of the 92 seman-tic subtypes and the evaluation corpus. In Sec-tion 3, we present our baseline semantic subtype classification system. Sections 4 and 5 introduce collective classification and hierarchical classifi-cation respectively, and describe how these two techniques can be used to improve the baseline semantic subtype classifier. We show evaluation results in Section 6 and conclude in Section 7.
2 Semantic Subtypes
As noted before, each name and nominal in the
BBN Entity Type Corpus is annotated with one of
the 92 semantic subtypes. In our experiments, we use all the 200 Penn Treebank Wall Street Journal articles in the corpus, yielding 17,292 NPs that are annotated with their semantic subtypes.
Table 1 presents an overview of these subtypes. Since they have been manually grouped into 29 supertypes, we also show the supertypes in the ta-ble. More specifically, the first column shows the supertypes, the second column contains a brief de-scription of a supertype, and the last column lists the subtypes that correspond to the supertype in the first column. In cases where a supertype con-tains only one subtype (e.g.,PERSON), the super-type is not further partitioned into different sub-types; for classification purposes, we simply treat the subtype as identical to its supertype (and hence the two always have the same name). A detailed description of these supertypes and subtypes can be found in Weischedel and Brunstein (2005). Fi-nally, we show the class distribution: the paren-thesized number after each subtype is the percent-age of the 17,292 NPs annotated with the subtype.
3 Baseline Classification Model
We adopt a supervised machine learning approach to train our baseline classifier for determining the semantic subtype of an NP. This section describes the details of the training process.
Training corpus. As mentioned before, we use the Wall Street Journal articles in the BBN Entity Type Corpus for training the classifier.
Training instance creation. We create one training instance for each annotated NP, NPi, which is either a name or a nominal, in each train-ing text. The classification of an instance is its an-notated semantic subtype value, which is one of the 92 semantic subtypes. Each instance is repre-sented by a set of 33 features1, as described below.
1. Mention String (3): Three features are de-rived from the string ofNPi. Specifically, we em-ploy the NP string as a feature. If NPi contains more than one token, we create one feature for each of its constituent tokens. Finally, to distin-guish the different senses of a nominal, we create
Supertype Brief Description Subtypes PERSON Proper names of people. Person (9.2). PERSON DESC Any head word of a common noun Person Desc (16.8).
referring to a person or group of people.
NORP This type is named after its subtypes: Nationality (2.9), Religion (0.1), Political (0.6), nationality, religion, political, etc. Other (0.1).
FACILITY Names of man-made structures, including Building (0.1), Bridge (0.02), Airport (0.01), infrastructure, buildings, monuments, Attraction (0.01), Highway Street (0.05), camps, farms, mines, ports, etc. Other (0.1).
FACILITY DESC Head noun of a noun phrase describing Building (0.5), Bridge (0.05), Airport (0.01), buildings, bridges, airports, etc. Highway Street (0.2), Attraction (0.02), Other (0.5). ORGANIZATION Names of companies, government Government (3.6), Corporation (8.3), Political (0.5),
agencies, educational institutions and Educational (0.3), Hotel (0.04), City (0.01), other institutions. Hospital (0.01), Religious (0.1), Other (0.7). ORG DESC Heads of descriptors of companies, Government (2.1), Corporation (4.3), Political (0.2),
educational institutions and other Educational (0.1), Religious (0.1), Hotel (0.1), governments, government agencies, etc. City (0.01), Hospital (0.02), Other (0.7). GPE Names of countries, cities, states, Country (4.2), City (3.2), State Province (1.4),
provinces, municipalities, boroughs. Other (0.1).
GPE DESC Heads of descriptors of countries, cities, Country (0.8), City (0.3), State Province (0.3), states, provinces, municipalities. Other (0.1).
LOCATION Names of locations other than GPEs. River (0.03), Lake Sea Ocean (0.05), Region (0.2), E.g., mountain ranges, coasts, borders, Continent (0.1), Other (0.2).
planets, geo-coordinates, bodies of water.
PRODUCT Name of any product. It does not Food (0.01), Weapon (0.02), Vehicle (0.2), include the manufacturer). Other (0.2).
PRODUCT DESC Descriptions of weapons and vehicles Food (0.01), Weapon (0.2), Vehicle (0.97), only. Cars, buses, machine guns, missiles, Other (0.02).
bombs, bullets, etc.
DATE Classify a reference to a date or period. Date (7.99), Duration (1.9), Age (0.5), Other (0.4). TIME Any time ending with A.M. or P.M. Time (0.5).
PERCENT Percent symbol or the actual word percent. Percent (2.07).
MONEY Any monetary value. Money (2.9).
QUANTITY Used to classify measurements. E.g., 4 1D (0.11), 2D (0.08), 3D (0.1), Energy (0.01), miles, 4 grams, 4 degrees, 4 pounds, etc. Speed (0.01), Weight (0.1), Other (0.04). ORDINAL All ordinal numbers. E.g., First, fourth. Ordinal (0.6).
CARDINAL Numerals that provide a count or quantity. Cardinal (5.1).
EVENT Named hurricanes, battles, wars, sports War (0.03), Hurricane (0.1), Other (0.24). events, and other named events.
PLANT Any plant, flower, tree, etc. Plant (0.2). ANIMAL Any animal class or proper name of an Animal (0.7).
animal, real or fictional.
SUBSTANCE Any chemicals, elements, drugs, and Food (1.1), Drug (0.46), Chemical (0.23), Other (0.9). foods. E.g., boron, penicillin, plutonium.
DISEASE Any disease or medical condition. Disease (0.6). LAW Any document that has been made into Law (0.5).
a law. E.g., Bill of Rights, Equal Rights.
LANGUAGE Any named language. Language (0.2).
CONTACT INFO Address, phone. Address (0.01), Phone (0.04).
GAME Any named game. Game (0.1).
WORK OF ART Titles of books, songs and other creations. Book (0.16), Play (0.04), Song (0.03), Painting (0.01), Other (0.4).
Table 1: The 92 semantic subtypes and their corresponding supertypes.
a feature whose value is the concatenation of the head ofNPiand its WordNet sense number.2
2
We employ the sense number that is manually annotated for each NP in the WSJ corpus as part of the OntoNotes project (Hovy et al., 2006).
governing verb.3 Finally, to distinguish the differ-ent senses of the governing verb, we create a fea-ture whose value is the concatenation of the verb and its WordNet sense number.
3. Semantic (5): We employ five semantic fea-tures. First, if NPi is an NE, we create a feature whose value is the NE label ofNPi, as determined by the Stanford CRF-based NE recognizer (Finkel et al., 2005). However, ifNPiis a nominal, we cre-ate a feature that encodes the WordNet semantic class of which it is a hyponym, using the manu-ally determined sense of NPi.4 Moreover, to im-prove generalization, we employ a feature whose value is the WordNet synset number of the head noun of a nominal. If NPi has a governing verb, we also create a feature whose value is the Word-Net synset number of the verb. Finally, ifNPi is a nominal, we create a feature based on its WordNet
equivalent concept. Specifically, for each entity
type defined in ACE 20055, we create a list con-taining all the word-sense pairs in WordNet (i.e., synsets) whose glosses are compatible with that entity type.6 Then, givenNPiand its sense, we use these lists to determine if it belongs to any ACE 2005 entity type. If so, we create a feature whose value is the corresponding entity type.
4. Morphological (8). If NPi is a nominal, we create eight features: prefixes and suffixes of length one, two, three, and four.
5. Capitalization (4): We create four cap-italization features to determine whether NPi
IsAllCap,IsInitCap,IsCapPeriod, and
IsAllLower(see Bikel et al. (1999)).
6. Gazetteers (8): We compute eight gazetteer-based features, each of which checks whetherNPi
is in a particular gazetteer. The eight dictionaries contain pronouns (77 entries), common words and words that are not names (399.6k), person names (83.6k), person titles and honorifics (761),
vehi-3
We also employ the semantic role that is manually anno-tated for each NP in the WSJ corpus in OntoNotes.
4
The semantic classes we considered are person, location, organization, date, time, money, percent, and object.
5
The ACE 2005 entity types include person, organization, GPE, facility, location, weapon, and vehicle.
6Details of how these lists are constructed can be found in Nicolae and Nicolae (2006).
cle words (226), location names (1.8k), company names (77.6k), and nouns extracted from Word-Net that are hyponyms ofPERSON(6.3k).
7. Grammatical (2): We create a feature that encodes the part-of-speech (POS) sequence ofNPi obtained via the Stanford POS tagger (Toutanova et al., 2003). In addition, we have a feature that determines whetherNPiis a nominal or not.
We employ maximum entropy (MaxEnt) mod-eling7 for training the baseline semantic subtype
classifier. MaxEnt is chosen because it provides a probabilistic classification for each instance, which we will need to perform collective classi-fication, as described in the next section.
4 Collective Classification
One weakness of the baseline classification model is that it classifies each instance independently. In particular, the model cannot take into account re-lationships between them that may be helpful for improving classification accuracy. For example, if two NPs are the same string in a given doc-ument, then it is more likely than not that they have the same semantic subtype according to the “one sense per discourse” hypothesis (Gale et al., 1992). Incorporating this kind of relational infor-mation into the feature set employed by the base-line system is not an easy task, since each feature characterizes only a single NP.
To make use of the relational information, one possibility is to design a new learning procedure. Here, we adopt a different approach: we perform collective classification, or joint probabilistic in-ference, on the output of the baseline model. The idea is to treat the output for each NP, which is a probability distribution over the semantic sub-types, as its prior label/class distribution, and con-vert it into a posterior label/class distribution by exploiting the available relational information as an additional piece of evidence. For this purpose, we will make use of factor graphs. In this section, we first give a brief overview of factor graphs8, and show how they can be used to perform joint
7
inference for semantic subtype determination.
4.1 Factor Graphs
Factor graphs model optimization problems of an objective function g, which is a real-valued function ofnrandom variables X1, ..., Xn. We assume thatg can be decomposed into a product ofm factors. In other words,g(X1, ..., Xn) = f1(s1(X1, ..., Xn))...fm(sm(X1, ..., Xn)), where each factor fk is a real-valued function of some subset of X1, ... , Xn, denoted as sk(X1, ..., Xn). Eachfkcan be thought of as a feature function that computes the compatibility of an assignment of values to the variables in sk(X1, ..., Xn) with respect to a user-defined feature. Hence, a larger function value is more desirable, as it corresponds to a more compatible assignment of values to the variables involved.
A factor graph consists of two types of nodes: variable nodes and factor nodes. Each random variableXiis represented by a variable node, and each factor fk is represented by a factor node. Each factor nodefkis connected only to the nodes corresponding to sk. This results in a bipartite graph, where edges exist only between a variable node and a factor node.
Given this graph, there are several methods for finding an optimal assignment of the random vari-ablesX1, ..., Xnsuch that the objective function g is maximized. Exact inference using the sum-product algorithm (Kschischang et al., 2001) is possible if there are no cycles in the graph; other-wise a belief propagation algorithm, such as loopy belief propagation (Murphy et al., 1999), can be applied. Although there are no cycles in our factor graphs, we choose to use loopy belief propagation as our inferencer, since it performs approximate inference and is therefore computationally more efficient than an exact inferencer.
4.2 Application to Subtype Inference
To apply joint inference to semantic subtype in-duction, we create one factor graph for each test document, where each variable node is random variable Xi over the set of semantic subtype la-bels L and represents an NP, NPi, in the docu-ment. To retain the prior probabilities over the semantic subtype labelslq ∈Lobtained from the
baseline classification model, each variable node is given a factor f(Xi) = P(Xi = lq). If no additional factors that model the relation between two nodes/instances are introduced, maximizing the objective function for this graph (by maximiz-ing the product of factors) will find an assignment identical to the one obtained by taking the most probable semantic subtype label assigned to each instance by the baseline classifier.
Next, we exploit the relationship between two random variables. Specifically, we want to en-courage the inference algorithm to assign the same label to two variables if there exists a rela-tion between the corresponding NPs that can pro-vide strong epro-vidence that they should receive the same label. To do so, we create a pairwise fac-tor node that connects two variable nodes if the aforementioned relation between the underlying NPs is satisfied. However, to implement this idea, we need to address two questions.
First, which relation between two NPs can
pro-vide strong epro-vidence that they have the same se-mantic subtype? We exploit the coreference
re-lation. Intuitively, the coreference relation is a reasonable choice, as coreferent entities are likely to have the same semantic subtype. Here, we naively posit two NPs as coreferent if at least one of the following conditions is satisfied: (1) they are the same string after determiners are removed; (2) they are aliases (i.e., one is an acronym or abbreviation of the other); and (3) they are both proper names and have at least one word in com-mon (e.g., “Delta” and “Delta Airlines”).9
Second, how can we define a pairwise factor, fpair, so that it encourages the inference
algo-rithm to assign the same label to two nodes? One
possibility is to employ the following definition:
fpair(Xi, Xj)
= P(Xi=lp, Xj=lq),where lp, lq ∈L
=
1 iflp=lq
0 otherwise
In essence, fpair prohibits the assignment of dif-ferent labels to the two nodes it connects. In our
experiments, however, we “improve”fpairby in-corporating semantic supertype information into its definition, as shown below:
fpair(Xi, Xj)
= P(Xi=lp, Xj =lq),where lp, lq ∈L
=
Psup(sup(lp)|NPi)Psup(sup(lq)|NPj) iflp=lq
0 otherwise
In this definition, sup(lq) is the supertype of lq according to the semantic type hierarchy shown in Section 2, andPsup(sup(lq)|NPj)is the proba-bility thatNPj belongs tosup(lq)according to the semantic supertype classification modelPsup(see Section 5 for details on how this model can be trained). In essence, we estimate the joint proba-bility by (1) assuming that the two events are inde-pendent, and then (2) computing each event using supertype information. Intuitively, this definition allowsfpairto favor those label assignments that are more compatible with the predictions ofPsup. After graph construction, we apply an infer-encer to compute a marginal probability distribu-tion over the labels for each node/instance in the graph by maximizing the objective functiong, and output the most probable label for each instance according to its marginal distribution.
5 Hierarchical Classification
The pairwise factor fpair defined above exploits supertype information in a soft manner, meaning that the most probable label assigned to an NP by an inferencer is not necessarily consistent with its predicted supertype (e.g., an NP may receive Ho-tel as its subtype even if its supertype isPERSON). In this section, we discuss how to use supertype information for semantic subtype classification in a hard manner so that the predicted subtype is consistent with its supertype.
To exploit supertype information, we first train a model, Psup, for determining the semantic su-pertype of an NP using MaxEnt. This model is trained in essentially the same way as the base-line model described in Section 3. In particular, it is trained on the same set of instances using the same feature set as the baseline model. The only difference is that the class value of each training instance is the semantic supertype of the associ-ated NP rather than its semantic subtype.
Next, we train 29 supertype-specific classifi-cation models for determining the semantic sub-type of an NP. For instance, theORGANIZATION -specific classification model will be used to clas-sify an NP as belonging to one of its subtypes (e.g., Government, Corporation, Political agen-cies). A supertype-specific classification model is trained much like the baseline model. Each in-stance is represented using the same set of fea-tures as in the baseline, and its class label is its semantic subtype. The only difference is that the model is only trained only on the subset of the instances for which it is intended. For instance, theORGANIZATION-specific classification model is trained only on instances whose class is a sub-type ofORGANIZATION.
After training, we can apply the supertype clas-sification model and the supertype-specific sub-type classification model to determine the se-mantic subtype of an NP in a hierarchical fash-ion. Specifically, we first employ the supertype model to determine its semantic supertype. Then, depending on this predicted semantic supertype, we use the corresponding subtype classification model to determine its subtype.
6 Evaluation
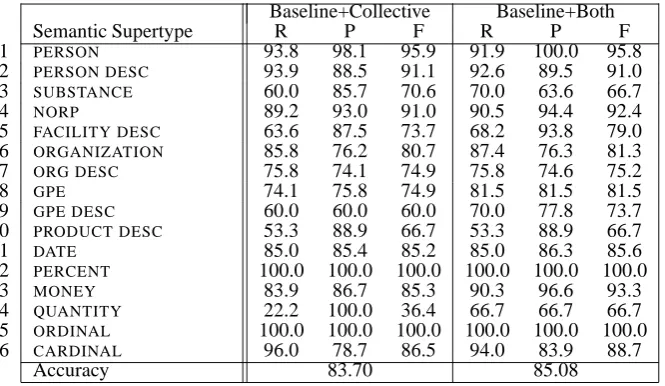
For evaluation, we partition the 200 Wall Street Journal Articles in the BBN Entity Type corpus into a training set and a test set following a 80/20 ratio. As mentioned before, each text in the Entity Type corpus has its NPs annotated with their se-mantic subtypes. Test instances are created from these texts in the same way as the training in-stances described in Section 3. To investigate whether we can benefit from hierarchical and col-lective classifications, we apply these two tech-niques to the Baseline classification model in iso-lation and in combination, resulting in the four sets of results in Tables 2 and 3.
Baseline only Baseline+Hierarchical
Semantic Supertype R P F R P F
1 PERSON 91.9 89.7 90.8 88.8 91.1 89.9
2 PERSON DESC 91.3 87.8 89.5 92.1 89.8 91.0 3 SUBSTANCE 60.0 66.7 63.2 70.0 58.3 63.6 4 NORP 87.8 90.3 89.0 91.9 90.7 91.3 5 FACILITY DESC 72.7 88.9 80.0 68.2 93.8 79.0 6 ORGANIZATION 76.6 73.8 75.2 78.5 73.2 75.8
7 ORG DESC 75.0 70.7 72.8 75.8 75.2 75.5
8 GPE 75.6 73.9 74.7 77.0 75.4 76.2
9 GPE DESC 60.0 75.0 66.7 70.0 70.0 70.0
10 PRODUCT DESC 53.3 88.9 66.7 53.3 88.9 66.7 11 DATE 85.0 85.0 85.0 84.5 85.4 85.0 12 PERCENT 100.0 100.0 100.0 100.0 100.0 100.0
13 MONEY 83.9 86.7 85.3 88.7 96.5 92.4
14 QUANTITY 22.2 100.0 36.4 66.7 66.7 66.7 15 ORDINAL 100.0 100.0 100.0 100.0 100.0 100.0 16 CARDINAL 96.0 77.4 85.7 94.0 81.0 87.0
Accuracy 81.56 82.60
Table 2: Results for Baseline only and Baseline with hierarchical classification.
Baseline+Collective Baseline+Both
Semantic Supertype R P F R P F
1 PERSON 93.8 98.1 95.9 91.9 100.0 95.8
2 PERSON DESC 93.9 88.5 91.1 92.6 89.5 91.0 3 SUBSTANCE 60.0 85.7 70.6 70.0 63.6 66.7 4 NORP 89.2 93.0 91.0 90.5 94.4 92.4 5 FACILITY DESC 63.6 87.5 73.7 68.2 93.8 79.0 6 ORGANIZATION 85.8 76.2 80.7 87.4 76.3 81.3
7 ORG DESC 75.8 74.1 74.9 75.8 74.6 75.2
8 GPE 74.1 75.8 74.9 81.5 81.5 81.5
9 GPE DESC 60.0 60.0 60.0 70.0 77.8 73.7
10 PRODUCT DESC 53.3 88.9 66.7 53.3 88.9 66.7 11 DATE 85.0 85.4 85.2 85.0 86.3 85.6 12 PERCENT 100.0 100.0 100.0 100.0 100.0 100.0
13 MONEY 83.9 86.7 85.3 90.3 96.6 93.3
14 QUANTITY 22.2 100.0 36.4 66.7 66.7 66.7 15 ORDINAL 100.0 100.0 100.0 100.0 100.0 100.0 16 CARDINAL 96.0 78.7 86.5 94.0 83.9 88.7
Accuracy 83.70 85.08
Table 3: Results for Baseline with collective classification and Baseline with both techniques.
supertypes with non-zero scores are shown. As we can see, only 16 of the 29 supertypes have non-zero scores.10 Among the “traditional” seman-tic types, the Baseline yields good performance for PERSON, but only mediocre performance for
ORGANIZATION and GPE. While additional ex-periments are needed to determine the reason, we speculate that this can be attributed to the fact that
PERSONandPERSON DESChave only one seman-tic subtype (which is the supertype itself), whereas
10
The 13 supertypes that have zero scores are all under-represented classes, each of which accounts for less than one percent of the instances in the dataset.
ORGANIZATION andGPEhave nine and four sub-types, respectively. The classification accuracy is shown in the last row of the table. As we can see, the Baseline achieves an accuracy of 81.56.
Results obtained when hierarchical classifica-tion is applied to the Baseline are shown in the third column of Table 2. In comparison to the Baseline, accuracy rises from 81.56 to 82.60. This represents an error reduction of 5.6%, and the dif-ference between these two accuracies is statisti-cally significant at thep= 0.04level.11
Results obtained when collective classification alone is applied to the Baseline are shown in the second column of Table 3. In this case, the prior probability distribution over the semantic subtypes that is needed to create the factor asso-ciated with each node in the factor graph is sim-ply the probabilistic classification of the test in-stance that the node corresponds to. In compar-ison to the Baseline, accuracy rises from 81.56 to 83.70. This represents an error reduction of 11.6%, and the difference is significant at the p = 0.01 level. Also, applying collective clas-sification to the Baseline yields slightly better re-sults than applying hierarchical classification to the Baseline, and the difference in their results is significant at thep= 0.002level.
Finally, results obtained when both hierarchi-cal and collective classification are applied to the Baseline are shown in the third column of Table 3. In this case, the prior distribution needed to create the factor associated with each node in the factor graph is provided by the supertype-specific classification model that is used to classify the test instance in hierarchical classification. In compar-ison to the Baseline, accuracy rises from 81.56 to 85.08. This represents an error reduction of 19.1%, and the difference is highly significant (p < 0.001). Also, applying both techniques to the Baseline yields slightly better results than ap-plying only collective classification to the Base-line, and the difference in their results is signifi-cant at thep= 0.003level.
6.1 Feature Analysis
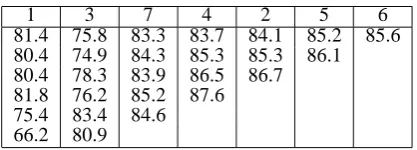
Next, we analyze the effects of the seven feature types described in Section 3 on classification ac-curacy. To measure feature performance, we take the best-performing system (i.e., Baseline com-bined with both techniques), begin with all seven feature types, and iteratively remove them one by one so that we get the best accuracy. The re-sults are shown in Table 4. Across the top line, we list the numbers representing the seven feature classes. The feature class that corresponds to each number can be found in Section 3, where they are introduced. For instance, “2” refers to the fea-tures computed based on the governing verb. The first row of results shows the system performance
1 3 7 4 2 5 6
81.4 75.8 83.3 83.7 84.1 85.2 85.6 80.4 74.9 84.3 85.3 85.3 86.1 80.4 78.3 83.9 86.5 86.7 81.8 76.2 85.2 87.6 75.4 83.4 84.6 66.2 80.9
Table 4: Results of feature analysis.
after removing just one feature class. In this case, removing the sixth feature class (Gazetteers) improves accuracy to 85.6, while removing the mention string features reduces accuracy to 81.4. The second row repeats this, after removing the gazetteer features.
Somewhat surprisingly, using only mention string, semantic, and grammatical features yields the best accuracy (87.6). This indicates that gazetteers, morphological features, capitalization, and features computed based on the governing verb are not useful. Removing the grammati-cal features yields a 3% drop in accuracy. After that, accuracy drops by 4% when semantic fea-tures are removed, whereas a 18% drop in accu-racy is observed when the mention string features are removed. Hence, our analysis suggests that the mention string features are the most useful fea-tures for semantic subtype prediction.
7 Conclusions
Acknowledgments
We thank the three anonymous reviewers for their invaluable comments on an earlier draft of the pa-per. This work was supported in part by NSF Grant IIS-0812261.
References
Bikel, Daniel M., Richard Schwartz, and Ralph M. Weischedel. 1999. An algorithm that learns what’s in a name. Machine Learning: Special Issue on
Natural Language Learning, 34(1–3):211–231.
Bunescu, Razvan and Raymond J. Mooney. 2004. Collective information extraction with relational markov networks. In Proceedings of the 42nd
An-nual Meeting of the Association for Computational Linguistics, pages 483–445.
Finkel, Jenny Rose, Trond Grenager, and Christopher Manning. 2005. Incorporating non-local informa-tion into informainforma-tion extracinforma-tion systems by Gibbs sampling. In Proceedings of the 43rd Annual
Meet-ing of the Association for Computational LMeet-inguis- Linguis-tics, pages 363–370.
Florian, Radu, Hany Hassan, Abraham Ittycheriah, Hongyan Jing, Nanda Kambhatla, Xiaoqiang Luo, Nicolas Nicolov, and Salim Roukos. 2004. A sta-tistical model for multilingual entity detection and tracking. In HLT-NAACL 2004: Main Proceedings, pages 1–8.
Florian, Radu, Hongyan Jing, Nanda Kambhatla, and Imed Zitouni. 2006. Factorizing complex mod-els: A case study in mention detection. In
Proceed-ings of the 21st International Conference on Com-putational Linguistics and the 44th Annual Meet-ing of the Association for Computational LMeet-inguis- Linguis-tics, pages 473–480.
Gale, William, Ken Church, and David Yarowsky. 1992. One sense per discourse. In Proceedings
of the 4th DARPA Speech and Natural Language Workshop, pages 233–237.
Hovy, Eduard, Mitchell Marcus, Martha Palmer, Lance Ramshaw, and Ralph Weischedel. 2006. Ontonotes: The 90% solution. In Proceedings of
the Human Language Technology Conference of the NAACL, Companion Volume: Short Papers, pages
57–60.
Huang, Zhiheng, Guangping Zeng, Weiqun Xu, and Asli Celikyilmaz. 2009. Accurate semantic class classifier for coreference resolution. In
Proceed-ings of the 2009 Conference on Empirical Methods in Natural Language Processing, pages 1232–1240.
Kschischang, Frank, Brendan J. Frey, and Hans-Andrea Loeliger. 2001. Factor graphs and the sum-product algorithm. IEEE Transactions on
Informa-tion Theory, 47:498–519.
Loeliger, Hans-Andrea. 2004. An introduction to factor graphs. IEEE Signal Processing Magazine, 21(1):28–41.
Murphy, Kevin P., Yair Weiss, and Michael I. Jordan. 1999. Loopy belief propagation for approximate in-ference: An empirical study. In Proceedings of the
Fifteenth Conference on Uncertainty in Artificial In-telligence, pages 467–475.
Ng, Vincent. 2007. Semantic class induction and coreference resolution. In Proceedings of the 45th
Annual Meeting of the Association of Computa-tional Linguistics, pages 536–543.
Nicolae, Cristina and Gabriel Nicolae. 2006. Best-Cut: A graph algorithm for coreference resolution. In Proceedings of the 2006 Conference on
Empiri-cal Methods in Natural Language Processing, pages
275–283.
Noreen, Eric W. 1989. Computer Intensive Methods
for Testing Hypothesis: An Introduction. John
Wi-ley & Sons.
Toutanova, Kristina, Dan Klein, Christopher D. Man-ning, and Yoram Singer. 2003. Feature-rich part-of-speech tagging with a cyclic dependency net-work. In HLT-NAACL 2003: Proceedings of the
Main Conference, pages 173–180.