Random-Walk Term Weighting
for Improved Text Classification
Samer Hassan and Carmen Banea Department of Computer Science
University of North Texas Denton, TX 76203
[email protected], [email protected]
Abstract
This paper describes a new approach for estimating term weights in a text classifi-cation task. The approach uses term co-occurrence as a measure of dependency between word features. A random walk model is applied on a graph encoding words and co-occurrence dependencies, resulting in scores that represent a quan-tification of how a particular word feature contributes to a given context. We argue that by modeling feature weights using these scores, as opposed to the traditional frequency-based scores, we can achieve better results in a text classification task. Experiments performed on four standard classification datasets show that the new random-walk based approach outperforms the traditional term frequency approach to feature weighting.
1 Introduction
Term frequency has long been adapted as a measure of term significance in a specific context (Robert-son and Jones, 1997). The logic behind it is that the more a certain term is encountered in a certain con-text, the more it carries or contributes to the mean-ing of the context. Due to this belief, term frequency has been a major factor in estimating the probabilis-tic distribution of features using maximum likeli-hood estimates and hence has been incorporated in a broad spectrum of tasks ranging from feature
selec-tion techniques (Yang and Pedersen, 1997; Schutze et al., 1995) to language models (Bahl et al., 1983).
In this paper we introduce a new measure of term weighting, which integrates the locality of a term and its relation to the surrounding context. We model this local contribution using a co-occurrence relation in which terms that co-occur in a certain context are likely to share between them some of their importance (or significance). Note that in this model the relation between a given term and its con-text is not linear, since the concon-text itself consists of a collection of other terms, which in turn have a dependency relation with their own context, which might include the original given term. In order to model this recursive relation we use a graph-based ranking algorithm, namely the PageRank random-walk algorithms (Brin and Page, 1998), and its Text-Rank adaption to text processing applications (Mi-halcea and Tarau, 2004). TextRank takes as in-put a set of textual entities and relations between them, and uses a graph-based ranking algorithm (also known as random walk algorithm) to produce a set of scores that represent the accumulated weight or rank for each textual entity in their context. The TextRank model was so far evaluated on three nat-ural language processing tasks: document summa-rization, word sense disambiguation, and keyword extraction, and despite being fully unsupervised, it has been shown to be competitive with other some-time supervised state-of-the-art algorithms.
In this paper, we show how TextRank can be used to model the probabilistic distribution of word features in a document, by making further use of the scores produced by the random-walk model.
Through experiments performed on a text classifi-cation task, we show that these random walk scores outperform the traditional term frequencies typically used to model the feature weights for this task.
2 Graph-based Ranking Algorithms
The basic idea implemented by an iterative graph-based ranking algorithm is that of “voting” or “rec-ommendation”. When one vertex links to another one, it is basically casting a vote for that other ver-tex. The higher the number of votes that are cast for a vertex, the higher the importance of the ver-tex. Moreover, the importance of the vertex casting a vote determines how important the vote itself is, and this information is also taken into account by the ranking algorithm. Hence, the score associated with a vertex is determined based on the votes that are cast for it, and the scores of the vertices casting these votes.
While there are several graph-based ranking algo-rithms previously proposed in the literature (Herings et al., 2001), we focus on only one such algorithm, namely PageRank (Brin and Page, 1998), as it was previously found successful in a number of applica-tions, including Web link analysis (Brin and Page, 1998), social networks (Dom et al., 2003), citation analysis, and more recently in several text process-ing applications (Mihalcea and Tarau, 2004), (Erkan and Radev, 2004).
Given a graph G = (V, E), let In(Va) be the set of vertices that point to vertexVa(predecessors), and letOut(Va)be the set of vertices that vertexVa points to (successors). The PageRank score associ-ated with the vertexVais then defined using a recur-sive function that integrates the scores of its prede-cessors:
S(Va) = (1−d) +d∗
X
Vb∈In(Va)
S(Vb)
|Out(Vb)| (1)
wheredis a parameter that is set between 0 and 11. The score of each vertex is recalculated upon each iteration based on the new weights that the neighbor-ing vertices have accumulated. The algorithm termi-nates when the convergence point is reached for all the vertices, meaning that the error rate for each ver-tex falls below a pre-defined threshold. Formally,
1
The typical value fordis 0.85 (Brin and Page, 1998), and this is the value we are also using in our implementation.
for a vertex Vi let Sk(Vi) be the rank or the score at iterationkandSk+1(V
i)be the score at iteration
k+ 1. The error rateERis defined as:
ER=Sk+1(Vi)−Sk(Vi) (2)
This vertex scoring scheme is based on a ran-dom walk model, where a walker takes ranran-dom steps on the graph G, with the walk being modeled as a Markov process – that is, the decision on what edge to follow is solely based on the vertex where the walker is currently located. Under certain con-ditions, this model converges to a stationary dis-tribution of probabilities, associated with vertices in the graph. Based on the Ergodic theorem for Markov chains (Grimmett and Stirzaker, 1989), the algorithm is guaranteed to converge if the graph is both aperiodic and irreducible. The first condition is achieved for any graph that is a non-bipartite graph, while the second condition holds for any strongly connected graph – property achieved by PageRank through the random jumps introduced by the(1−d)
factor. In matrix notation, the PageRank vector of stationary probabilities is the principal eigenvector for the matrixArow, which is obtained from the ad-jacency matrix A representing the graph, with all rows normalized to sum to 1: (P =AT
rowP). Intuitively, the stationary probability associated with a vertex in the graph represents the probability of finding the walker at that vertex during the ran-dom walk, and thus it represents the importance of the vertex within the graph. In the context of se-quence data labeling, the random walk is performed on the label graph associated with a sequence of words, and thus the resulting stationary distribution of probabilities can be used to decide on the most probable set of labels for the given sequence.
2.1 TextRank
Given a natural language processing task, the Text-Rank model includes four general steps for the application of a graph-based ranking algorithm to graph structures derived from natural language texts:
1. Identify text units that best define the proposed task and add them as vertices in the graph.
vertices in the graph. Edges can be directed or undirected, weighted or un-weighted.
3. Iterate the graph ranking algorithm to conver-gence.
4. Sort vertices based on their final score. Use the values attached to each vertex for ranking.
The strength of this model lies in the global repre-sentation of the context and its ability to model how the co-occurrence between features might propagate across the context and affect other distant features.
While TextRank has already been applied to sev-eral language processing tasks, we focus here on the keyword extraction task, since it best relates to our approach. The goal of a keyword extraction tool is to find a set of words or phrases that best describe a given document. The co-occurrence relation within a specific window is used to portray the correlation between words, which are represented as vertices in the graph. Two vertices are connected if their cor-responding lexical units co-occur within a window of at most N words, where N can be set to any value greater than two. The TextRank application to keyword extraction has also used different syn-tactic filters for vertex selection, including all open class words, nouns and verbs, nouns and adjectives, and others. The algorithm was found to provide the best results using nouns and adjectives with a win-dow size of two.
Our approach follows the same main steps as used in the TextRank keyword extraction application. We are however incorporating a larger number of lexical units, and we use different window sizes, as we will show in the following section.
3 TextRank for Term Weighting
The goal of the work reported in this paper is to study the ranking scores obtained using TextRank, and evaluate their potential usefulness as a new mea-sure of term weighting.
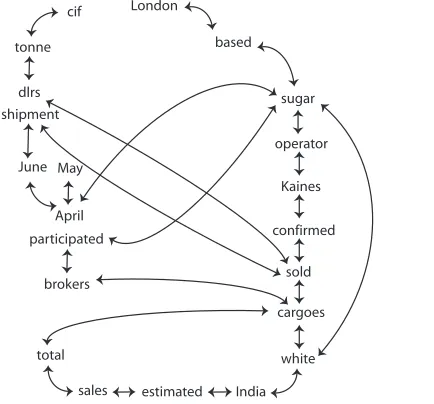
To understand how the random-walk weights (rw) might be a good replacement for the traditional term frequency weights (tf), consider the example in Figure 1. The example represents a sample doc-ument from the Reuters collection. A graph is con-structed as follows. If a term has not been previously seen, then a node is added to the graph to represent
this term. A term can only be represented by one node in the graph. An undirected edge is drawn be-tween two nodes if they co-occur within a certain window size. This example assumes a window size of two, corresponding to two consecutive terms in the text (e.g. London is linked to based).
London-based sugar operator Kaines Ltd
con-firmed it sold two cargoes of white sugar to India out of an estimated overall sales total of four or five cargoes in which other brokers participated. The sugar, for April/May and April/June shipment, was
sold at between 214 and 218 dlrs a tonne cif, it said.
Figure 1: Sample Reuters document
London
based
sugar
operator
Kaines
confirmed
sold
cargoes
white
India estimated sales
total brokers participated
April May June shipment
dlrs tonne
cif
Figure 2: Sample graph
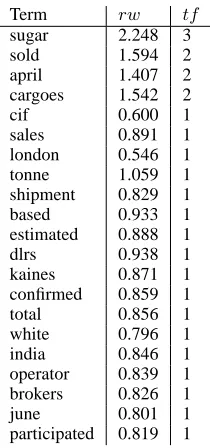
Table 1 shows thetf andrwweights, also plotted in Figure 3. By analyzing the rwweights, we can observe a non-linear correlation with thetfweights, with an emphasis given to terms surrounding impor-tant key term like e.g. “sugar” or “cargoes.” This spatial locality has resulted in higher ranks for terms like “operator” compared to other terms like “lon-don”2.
2
Term rw tf
Table 1:tf &rwscores
0
Figure 3:tf &rwplots
4 Experimental Setup
To evaluate our random-walk based approach to fea-ture weighting, we integrate it in a text classification algorithm, and evaluate its performance on several standard text classification data sets.
4.1 Random-Walk Term Weighting
Starting with a given document, we determine a ranking over the words in the document by using the approach described in Section 3.
First, we tokenize the document for punctuation, special symbols, word abbreviations. We also re-move the common words, using a list of approx-imately 500 frequently used words as used in the
Smart retrieval system3.
Next, the resulting text is processed to extract both
tf andrw weights for each term in the document. Note that we do not apply any syntactic filters, as it was previously done in applications of TextRank. Instead, we consider each word as a potential fea-ture. To determinetf we simply count the frequen-cies of each word in the document. To determine
rw, all the terms are added as vertices in a graph representing the document. A co-occurrence scan-ner is then applied to the text to relate the terms that co-occur within a given window size . For a given term, all the terms that fall in the vicinity of this term are considered dependent terms. This is rep-resented by a set of edges that connect this term to all the other terms in the window. Experiments are performed for window sizes of 2, 4, 6, and 8. Once the graph is constructed and the edges are in place, the TextRank algorithm is applied4. The result of the ranking process is a list of all input terms and their correspondingrwscores.
We then calculatetf.idf andrw.idf as follows:
tf.idf =tf∗logND
n
whereND represent the total number of documents in the collection andnis the number of documents in which the target term appeared at least once.
Similarly,
rw.idf =rw∗logND
n
These term weights (tf.idf or rw.idf) are then used to create a feature vector for each document. The vectors are fed to a traditional text classifica-tion system, using one of the learning algorithms de-scribed below. The results obtained usingtf.idfwill act as a baseline in our evaluation.
4.2 Text Classification
Text classification is a problem typically formulated as a machine learning task, where a classifier learns how to distinguish between categories in a given set
3
ftp://ftp.cs.cornell.edu/pub/smart.
4
using features automatically extracted from a collec-tion of training documents. There is a large body of algorithms previously tested on text classification problems, due also to the fact that this task is one of the testbeds of choice for machine learning algo-rithms. In the experiments reported here, we com-pare results obtained with four frequently used text classifiers – Rocchio, Na¨ıve Bayes, Nearest Neigh-bor, and Support Vector Machines, selected based on their diversity of learning methodologies.
Na¨ıve Bayes. The basic idea in a Na¨ıve Bayes text classifier is to estimate the probability of a category given a document using joint probabili-ties of words and documents. Na¨ıve Bayes as-sumes word independence, which means that the conditional probability of a word given a category is assumed to be independent of the conditional probability of other words given the same category. Despite this simplification, Na¨ıve Bayes classifiers were shown to perform surprisingly well on text classification (Joachims, 1997), (Schneider, 2004). While there are several versions of Na¨ıve Bayes classifiers (variations of multinomial and multivari-ate Bernoulli), we use the multinomial model (Mc-Callum and Nigam, 1998), which was shown to be more effective.
Rocchio. This is an adaptation of the relevance feedback method developed in information retrieval (Rocchio, 1971). It uses standard tf.idf weighted vectors to represent documents, and builds a pro-totype vector for each category by summing up the vectors of the training documents in each category. Test documents are then assigned to the category that has the closest prototype vector, based on a cosine similarity. Text classification experiments with different versions of the Rocchio algorithm showed competitive results on standard benchmarks (Joachims, 1997), (Moschitti, 2003).
KNN. K-Nearest Neighbor is one of the earliest text categorization approaches (Makoto and Takenobu, 1995; Masand et al., 1992). The algorithm classifies a test document based on the best class label identi-fied for the nearest K-neighbors in the training doc-uments. The best class label is chosen by weighting the class of each similar training document with its similarity to the target test document.
SVM. Support Vector Machines (Vapnik, 1995) is a state-of-the-art machine learning approach based
on decision plans. The algorithm defines the best hyper-plan which separates set of points associated with different class labels with a maximum-margin. The unlabeled examples are then classified by de-ciding in which side of the hyper-surface they re-side. The hyper-plan can be a simple linear plan as first proposed by Vapnik, or a non-linear plan such as e.g. polynomial, radial, or sigmoid. In our eval-uation we used the linear kernel since it was proved to be as powerful as the other kernels when tested on text classification data sets (Yang and Liu, 1999).
4.3 Data Sets
In our experiments we use Reuters-21578,
W ebKB, 20N ewsgroups, and LingSpam
datasets. These datasets are commonly used for text classification evaluations (Joachims, 1996; Craven et al., 1998; Androutsopoulos et al., 2000; Mihalcea and Hassan, 2005).
Reuter-21578. This is a publicly available subset of the Reuters news, containing about 120 categories. We use the standard ModApte data split (Apte et al., 1994). The unlabeled documents were discarded and only the documents with one or more class la-bels were used in the classification experiments. WebKB. This is a data set collected from com-puter science departments of various universities by the CMU text learning group. The dataset contains seven class labels which are Project, Student, De-partment, Faculty, Staff, Course, and Other. The Other label was removed from the dataset for evalu-ation purposes. Most of the evaluevalu-ations in the liter-ature have been performed on only four of the cate-gories (Project, Student, Faculty, and Course) since they represent the largest categories. However, since we wanted to see how our system behaves when only a few training examples were available as e.g. in the Staff and the Department classes, we performed our evaluations on two versions ofW ebKB: one with the four categories version (W ebKB4) and one with the six categories (W ebKB6).
20-Newsgroups. This is a collection of 20,000 mes-sages from 20 different newsgroups, corresponding to different topics or subjects. Each newsgroup has about 1000 message split into 400 test and 600 train documents.
al-low for 10-fold cross validation. Each collection has roughly 300 spam and legitimate messages. There are four versions of the corpus standing for bare, stop-word filtered, lemmatized, and stop-word and lemmatized. We use the bare collection with a stan-dard 10-fold cross validation.
4.4 Performance Measures
To evaluate the classification system we used the tra-ditional accuracy measure defined as the number of correct predictions divided with the number of eval-uated examples.
We also use the correlation coefficient (ρ) as a diversity measure to evaluate the dissimilarity between the weighting models. Pairwise diver-sity measures have been traditionally used to mea-sure the statistical independence among ensemble of classifiers (Kuncheva and Whitaker, 2003). Here, we use them to measure the correlation between our random-walk approach and the traditional term fre-quency approach. The typical setting in which the pairwise diversity measures are used is a set of dif-ferent classifiers which are used to classify the same set of feature vectors or documents over a given dataset. In our evaluation we use the same classifier to evaluate two different sets of feature vectors that are produced by different weighting features: therw
random walk weighting, and thetf term frequency weighting. Since the two feature vector collections are evaluated by one classifier at a time, the resulted diversity scores will reflect the diversity of the two systems.
LetDi andDj be two feature weighting models with the following contingency table.
Dj correct=Y Dj correct=N
Di correct=Y a b
Di correct=N c d
Table 2:Di&DjContingency table
The correlation coefficient (ρ) is defined as:
ρij =
ad−bc
p
(a+b)(c+d)(a+c)(b+d)
5
The symbol†indicates a statistically significant result using
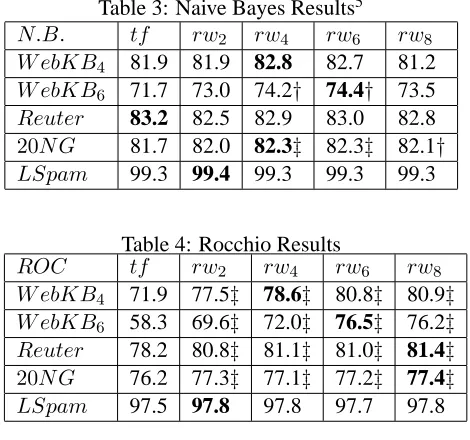
Table 3: Naive Bayes Results5
N.B. tf rw2 rw4 rw6 rw8
W ebKB4 81.9 81.9 82.8 82.7 81.2
W ebKB6 71.7 73.0 74.2† 74.4† 73.5
Reuter 83.2 82.5 82.9 83.0 82.8
20N G 81.7 82.0 82.3‡ 82.3‡ 82.1†
LSpam 99.3 99.4 99.3 99.3 99.3
Table 4: Rocchio Results
ROC tf rw2 rw4 rw6 rw8
W ebKB4 71.9 77.5‡ 78.6‡ 80.8‡ 80.9‡
W ebKB6 58.3 69.6‡ 72.0‡ 76.5‡ 76.2‡
Reuter 78.2 80.8‡ 81.1‡ 81.0‡ 81.4‡
20N G 76.2 77.3‡ 77.1‡ 77.2‡ 77.4‡
LSpam 97.5 97.8 97.8 97.7 97.8
5 Evaluation and Discussion
Tables 3, 4, 5, 6 show the classification results for
W ebKB4, W ebKB6, LingSpam, Reuter, and
20N ewsgroups respectively. Therw2, rw4, rw6,
and rw8 represent the accuracies achieved using
random-walk weighting under window sizes of 2, 4, 6, and 8 respectively. Thetf column represents the results obtained with a term frequency weighting scheme.
By examining the results we can see that the
rw.idf model outperforms the tf.idf model on all
the classifiers and datasets with only one excep-tion in the case of a Na¨ıve Bayes classifier under
Reuter. The error reductions range from3.5% as in
{20N ewsgroups,N aiveBayes,rw4}to44% as in
the case of{W ebKB6,Rocchio,rw6}. The system
gives, in its worst performance, a comparable result to thetf.idf baseline. The system shows a consis-tent performance with different window sizes, with no clear cut window size that would give the best result. By further analyzing the results using statis-tical paired t-tests we can see that windows of size 4 and 6 supply the most significant results across all the classifiers as well as the datasets.
ComparingW ebKB4andW ebKB6fine-grained results, we found that both systems failed to pre-dict the class Staff; however the significant
Table 5: KNN Results
KN N tf rw2 rw4 rw6 rw8
W ebKB4 59.2 68.6‡ 67.0‡ 64.6‡ 66.6‡
W ebKB6 55.8 63.7‡ 55.8 59.9† 61.0‡
Reuter 73.6 76.9‡ 78.1‡ 78.5‡ 78.5‡
20N G 70.3 76.1‡ 76.5‡ 77.2‡ 77.8‡
LSpam 97.5 97.8 97.8 98.1† 97.9
Table 6: SVM Results
SV M tf rw2 rw4 rw6 rw8
W ebKB4 87.7 87.9 87.9 89† 88.5
W ebKB6 82.5 84.5‡ 85.2‡ 85.2‡ 84.6‡
Reuter 83.2 84.5‡ 84.4‡ 84.6‡ 84.1†
20N G 95.2 95.5‡ 95.6‡ 95.6‡ 95.4†
LSpam 95.6 96.4‡ 96.4‡ 96.2‡ 96.3‡
ment was over the class Department, in which our
rw model scores an accuracy of 47% compared to 4% in using tf.idf. This indicates how successful
rw.idf model is in cases where there are few
train-ing examples. This could be due to the ability of the model to extract more realistic and smoother distri-bution of terms as seen in the rw curve plotted in Figure 3, hence reducing the feature bias imposed by the limited number of training examples.
Table 7: Naive Bayes Correlationρ
N.B. rw2 rw4 rw6 rw8
W ebKB4 0.68 0.70 0.70 0.66
W ebKB6 0.71 0.71 0.71 0.65
Reuter 0.86 0.87 0.87 0.85
20N G 0.82 0.84 0.83 0.82
LSpam 0.89 0.89 0.92 0.92
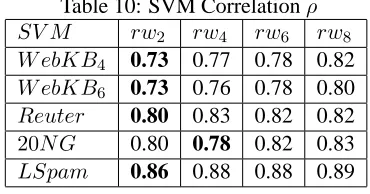
By also examining the diversity of the classifi-cation systems based on rw and tf weighting, as shown in Table 7, 8, 9, 10, we can see an inter-esting property of the system. The two models are generally more diverse and less correlated when us-ing windows of size 6 and 8 than usus-ing windows of size 2 and 4. This could be due to the increasing drift from the feature independence assumption that is implied bytf.idf. However increasing the depen-dency is not always desirable as seen in the reported accuracies. We expect that at a certain window size the system performance will degrade totf.idf. This
Table 8: Rocchio Correlationρ
ROC rw2 rw4 rw6 rw8
W ebKB4 0.49 0.51 0.53 0.54
W ebKB6 0.40 0.40 0.41 0.42
Reuter 0.75 0.77 0.75 0.71
20N G 0.77 0.77 0.77 0.77
LSpam 0.82 0.85 0.81 0.78
Table 9: KNN Correlationρ
KN N rw2 rw4 rw6 rw8
W ebKB4 0.35 0.32 0.36 0.37
W ebKB6 0.35 0.35 0.37 0.37
Reuter 0.74 0.70 0.68 0.67
20N G 0.62 0.64 0.63 0.59
LSpam 0.66 0.69 0.63 0.57
threshold window size will be equal to the document size. In such a case each term will depend on all the remaining terms resulting in an almost completely connected graph. Consequently, each feature contri-bution to the surrounding will be equal resulting in similarrwscores to all the features.
6 Conclusions and Future Work
Based on results obtained in text classification ex-periments, the TextRank random-walk model to term weighting was found to achieve error rate re-ductions of 3.5–44% as compared to the traditional frequency-based approach. The evaluation results have shown that the system performance varies de-pending on window size, dataset, as well as classi-fier, with the greatest boost in performance recorded for KNN ,Rocchio, and SVM. We believe that these results support our claim that random-walk models can accurately estimate term weights, and can be used as a technique to model the probabilistic dis-tribution of features in a document.
The evaluations reported in this paper has shown that the TextRank model can accurately provide
uni-gram probabilities for a sequence of words. In future
Table 10: SVM Correlationρ
SV M rw2 rw4 rw6 rw8
W ebKB4 0.73 0.77 0.78 0.82
W ebKB6 0.73 0.76 0.78 0.80
Reuter 0.80 0.83 0.82 0.82
20N G 0.80 0.78 0.82 0.83
LSpam 0.86 0.88 0.88 0.89
References
I. Androutsopoulos, J. Koutsias, K. V. Chandrinos, G. Paliouras, and C. D. Spyropoulos. 2000. An eval-uation of naive bayesian anti-spam filtering. In
Pro-ceedings of the workshop on Machine Learning in the New Information Age.
C. Apte, F. Damerau, and S. M. Weiss. 1994. Towards language independent automated learning of text cat-egorisation models. In Proceedings of the 17th ACM
SIGIR Conference on Research and Development in Information Retrieval.
L. Bahl, F. Jelinek, and R. Mercer. 1983. A maximum likelihood approach to continuous speech recognition.
IEEE Transactions on Pattern Analysis and Machine Intelligence, 5(2).
S. Brin and L. Page. 1998. The anatomy of a large-scale hypertextual Web search engine. Computer Networks
and ISDN Systems, 30(1–7).
M. Craven, D. DiPasquo, D. Freitag, A. McCallum, T. Mitchell, K. Nigam, and S. Slattery. 1998. Learn-ing to extract symbolic knowledge from the World Wide Web. In Proceedings of the 15th Conference of
the American Association for Artificial Intelligence.
B. Dom, I. Eiron, A. Cozzi, and Y. Shang. 2003. Graph-based ranking algorithms for e-mail expertise analysis. In Proceedings of the 8th ACM SIGMOD workshop on
Research issues in data mining and knowledge discov-ery, San Diego, California.
G. Erkan and D. Radev. 2004. Lexpagerank: Prestige in multi-document text summarization. In Proceedings
of the Conference on Empirical Methods in Natural Language Processing, Barcelona, Spain, July.
G. Grimmett and D. Stirzaker. 1989. Probability and
Random Processes. Oxford University Press.
P.J. Herings, G. van der Laan, and D. Talman. 2001. Measuring the power of nodes in digraphs. Technical report, Tinbergen Institute.
T. Joachims. 1996. A probabilistic analysis of the roc-chio algorithm with tf.idf for text categorization. In
Proceedings of the 14th International Conference on Machine Learning.
T. Joachims. 1997. A probabilistic analysis of the Roc-chio algorithm with TFIDF for text categorization. In
Proceedings of ICML-97, 14th International Confer-ence on Machine Learning, Nashville, US.
L. Kuncheva and C. Whitaker. 2003. Measures of diver-sity in classifier ensembles and their relationship with the ensemble accuracy. Machine Learning, 51. I. Makoto and T. Takenobu. 1995. Cluster-based text
cat-egorization: A comparison of category search starte-gies. In Proceedings of the 18th ACM International
Conference on Research and Development in Informa-tion Retrieval.
B. Masand, G. Linoff, and D. Waltz. 1992. Classify-ing news stories usClassify-ing memory based reasonClassify-ing. In
Proceedings of the 15th International Conference on Research and Development in information Retrieval.
A. McCallum and K. Nigam. 1998. A comparison of event models for Naive Bayes text classification. In
Proceedings of AAAI-98 Workshop on Learning for Text Categorization.
R. Mihalcea and S. Hassan. 2005. Using the essence of texts to improve document classification. In
Proceed-ings of the Conference on Recent Advances in Natural Language Processing (RANLP), Borovetz, Bulgaria.
R. Mihalcea and P. Tarau. 2004. TextRank – bringing order into texts. In Proceedings of the Conference on
Empirical Methods in Natural Language Processing (EMNLP 2004), Barcelona, Spain.
A. Moschitti. 2003. A study on optimal paramter tun-ing for Rocchio text classifier. In Proceedtun-ings of the
European Conference on Information Retrieval, Pisa,
Italy.
R. Robertson and K. Sparck Jones. 1997. Simple, proven approaches to text retrieval. Technical report.
J. Rocchio, 1971. Relevance feedback in information
re-trieval. Prentice Hall, Ing. Englewood Cliffs, New
Jer-sey.
K. Schneider. 2004. A new feature selection score for multinomial naive bayes text classification based on kl-divergence. In The Companion Volume to the
Pro-ceedings of 42st Annual Meeting of the Association for Computational Linguistics, Barcelona, Spain, July.
H. Schutze, D. A. Hull, and J. O. Pedersen. 1995. A comparison of classifiers and document representa-tions for the routing problem. In Proceedings of the
18th annual international ACM SIGIR conference on Research and development in information retrieval,
Seattle, Washington.
V. Vapnik. 1995. The Nature of Statistical Learning
The-ory. Springer, New York.
Y. Yang and X. Liu. 1999. A reexamination of text cate-gorization methods. In Proceedings of the 22nd ACM
SIGIR Conference on Research and Development in Information Retrieval.
Y. Yang and J. O. Pedersen. 1997. A comparative study on feature selection in text categorization. In