ISSN 2286-4822
www.euacademic.org DRJI Value: 5.9 (B+)
Integrating structure conduct and performance
framework for maize seed value chain analysis in
western Nepal
RAJENDRA PRASAD MISHRA Ministry of Agricultural Development, Singh Durbar Kathmandu Nepal
G. R. JOSHI Commission for the Investigation of Abuse of Authority, Nepal
J. P. DUTTA Dean Faculty of Agriculture, Agriculture and Forestry University
Rampur, Chitwan, Nepal
Abstract:
level of product diversification, low investment in promotion, primary focus of actors is individual gain, and no embedded services and risk sharing mechanism in place. There is poor horizontal linkage among seed production stream, however there is better vertical linkage. The level of trust is important glue for smooth functioning of value chain which is found low among chain actors. In spite of deficiencies in structure and conduct, the maize seed value chain found performing well against set objectives of food security, poverty reduction, social inclusion, local value addition, and distribution of income among actors (GI 0.75). The income from seed production largely concentrated toward small producers, similarly large proportion of value addition concentrated towards farmers and net margin more or less equitably distributed among value streams (GI 0.74).
The major implication of this study is towards implementation of programs focusing improvement in structure and conduct deficiencies to achieve better performance of the maize seed value chain. The increasing competition with external more competent, coordinated and highly efficient integrated value chains demand upgrading programs for current maize seed value chain to make it competent and resilient in the territory to reduce external dependency in maize seed and improve domestic seed production. Similarly high concentration of source seed market needs higher participation of other agencies in source seed production and distribution.
Key words: maize seed value chain, structure conduct, performance
1. INTRODUCTION
understood as the share of different actors in ultimate outcome of market function and achievement of its goals. This framework was first published by economists Edward Chamberlin and Joan Robinson in 1933, and developed by Joe S. Bain in 1959. SCP framework was initially used to analyze the markets as an analytical framework, to make relations among market structure, conduct and performance. In this framework holistic approach is used and prevailing market is considered as unit of analysis.
In the market a product moves from the producer to the consumer with many transformations making a chain of interrelated value adding successive activities in a given environment. Such chains characterize the set of interconnected and coordinated activities that takes place as a product moves from primary production point to the final consumer. The enabling environment surrounding a chain is the set of global, national and local government regulations and practices creating incentives for private sector growth (Kula et al., 2006). A value chain is the full range of activities which are required to bring a product or service from conception through the different phases of production, delivery to final customers, and final disposal after use (Kaplinsky and Morris, 2000:4). Value chain analysis is a systematic approach to examine the development of competitive advantage that enables the producer to create superior value for its customers and superior profits for itself.
working together, making strategic decisions, enhancing competitive capacity and reducing short term mutual exploitation. Klint and Sjoberg (2003) characterized SCP categories for firm networks and Figueiredo Junior and Sostowski (2010) expressed the need of extended SCP to devise the strategy for networks of firms and supporting actors (cited in H.S.J. de Figueirêdo, 2014). Application of SCP framework in value chain analysis identifies the relations among value streams, and participants are evaluated based on their influence on structure conduct and performance. Thus integration of SCP framework in value chain analysis provide deeper insight to provide better ways for value chain upgrading, improved competitiveness and enhanced performance.
performance of the maize value chain as a whole and its streams.
2. METHODOLOGY
This study was based on primary and secondary data collected from seed producer farmers, seed collectors, seed processors, seed retailers and seed users operating in western Nepal. Farmer’s level data were collected from four purposively selected sites and randomly selected households for seed producers and end users for structured questionnaire survey. Seed collectors, processors and retailers were interviewed purposively in the region. In addition to these, different government offices having direct and indirect linkage with maize seed production and marketing were interviewed. Semi-structured questionnaires and personal interviews were used to collect the data. Four focused group discussions (FGDs) that involved key informants were held Dadeldhura, Dhangadi, Doti, Surkhet and Dailekh. These were complimented with direct observation.
Similarly, information from seed producer farmers and end user farmers was obtained on household information, land holding, maize grain and seed production, seed sale record, infrastructure available, training and technical services, seed storage and postharvest operations, seed quality and certification process, problems in seed production and marketing and suggestions to improve, seed licensing, technical services being obtained from input/seed suppliers, market transaction costs, cost of production of maize seed etc.
Table 1: Sample size in different streams of value chain
Districts Surkhet, Dadeldhura, Kalilali, Doti
Focus group discussion 6
Maize grower farmers survey 100
Collectors survey 6
Quality control agency survey 2
Seed processers 6
Agro vet survey 6
Seed producers survey 200
Source seed producers survey 2
3. STRUCTURE CONDUCT AND PERFORMANCE FRAMEWORK FOR VALUE CHAIN ANALYSIS
3.1. Structure
barriers, substitute products, local natural and institutional environment and local infrastructure related indicators as structural aspects for evaluating strategies for honey value chains in Brazil. Characterizing the determinants of successful value chains Canadian Agri Food Policy Institute, 2012 mentioned four structure of value chain fragmented, cooperative, coordinated and collaborative with different characteristics. These characteristics are defined under five categories: strategic factors, governance arrangements, financial, communication and operations. Value chain structures reflect a continuum that spans from traditional open market approaches to businesses that are closely aligned to the point that they may jointly invest in infrastructure and resources (Dunne, 2003; Spekman et al., 1998). This continuum inhabits fragmented, cooperative, coordinated and collaborative structure of value chains. Regarding governance structure of value chain Gereffi, 2005 identified five structures market, modular, relational, captive and hierarchy.
Failure to create competitive framework may distort market operations and eventually lead to collapse of the value stream.
3.2. Conduct
In SCP framework of market analysis conduct is the operational behavior of market actors like collusion, price discrimination, warranty, transparency, governance, measurement and standards of the products. The conduct is measured in terms of price set by individual actors for their role or value addition in the product. In case of SCP framework of value chain analysis conduct aspects: choices of products, market segments, technologies, and horizontal/vertical linkages, business process, agglomeration, decisions, and distribution activities, use of resources, supporting services, diversification, promotion, and organizational decisions are commonly cited (Humphrey and Schmitz 2000, Gereffi et al 2005, Lastres and Cassiolato 2005, Morrison et al 2008, Coe et al 2008, Bolwig et al 2010, Trienkekens 2011, Ruben and Zuniga 2011, Fias 2007 and Weber and Labaste 2010). In the value stream conduct variable includes behaviors patterns adopted by value stream actors as a way of adjusting market conditions, deter competitors and to achieve strategic goals and thus it is considered endogenous.
3.3. Performance
productive capacity and productivity are among the possible measures of chain performance (UNIDO, 2009). In the value chain analysis it is most important to establish meaningful linkage between conduct and performance for which measures are selected before conduct measures such links can be established well.
4. SCP FRAMEWORK FOR MAIZE SEED VALUE CHAIN ANALYSIS
This study used integrated assessment of value chain SCP framework derived from Figueiredo Junior, Meuwissen, and Oude Lansink 2014 and other studies. Maize seed value chain is considered as unit of analysis and overall seed value chain is decomposed in different five value streams and each stream is analyzed separately and together to get the conclusion. In each value stream SCP framework employed with selected indicators for structure, conduct and performance measurement. The source seed supply stream is mostly under government agency control and not analyzed fully.
a. Source seed supply stream b. Seed production stream c. Seed collection stream d. Seed processing stream e. Seed distribution stream
The maize seed value chain in western Nepal has not long history and is still government supported to some extent. The basic objective behind promotion of maize seed value chain is enhance maize seed self sufficiency to promote food security and reduce poverty among farming population.
different indicators used to analyze the structure of value chains. Only the selected indicators suitable to this were used in this study. The selected ones are: demand, supply, infrastructure, entry barriers, and substitute products. Similarly strategic, governance, financial, communication and operational structures in the value chain are also taken in consideration. Based on the strategic, governance, financial, communication and operation indicators, value chain structure are categorized in fragmented, cooperative, coordinated and collaborative. Lerner index and Herfindahl index are calculated to examine the structure of the value stream and overall value chain.
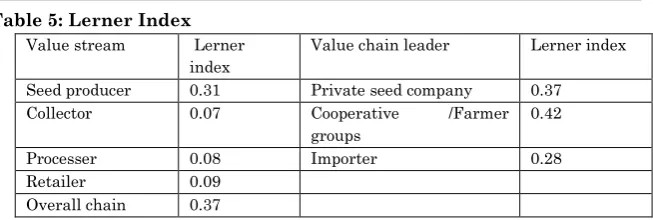
Lerner Index: Lerner index is calculated for each value stream and for overall value chain and interpreted as higher the value of Lerner index higher the market power of the value chain or value stream in the chain. In the market structure higher Lerner index indicates toward monopolistic structure lesser indicates toward competition market and between is oligopoly. The Lerner index requires information on marginal cost of production which is not readily observable by outsiders. Investigators then use the weighted average of profit rates (Profit of firm i /Revenue of firm i) as a proxy for Lerner index (Hanekm et al 2010). The calculation of the marginal cost of production for each value stream is not possible from survey so weighted profit rates (profit margin of value stream/ revenue of value stream ) of value stream is used as proxy of Lerner Index in this study.
Where,
L = Learner index used as proxy value chain power in the market P = Market Price per kg of seed
Herfindahl Index: Generally market concentration is measured 1/n when share of the operating firm or value chains is identical where n is the number of value chains or firms but it is difficult when the market share among firm or value chains is different. The Herfindahl index is used to determine and compare concentration within maize seed value chain in western Nepal. If there are n firms with total output of q in the particular value stream and the market share of value chain i is denoted by Si = qi / q.
Herfindahl index: H = S1² + S2² + .... + Sn²
Interpretation: Higher value of Herfindahl index indicates that the value stream is concentrated irrespective of number of firms involved in the chain stream. This indicate that concentration cannot be calculated or predicted solely based on number of firms operating in the value stream, but the distribution of market shares between them also have to be taken into account.
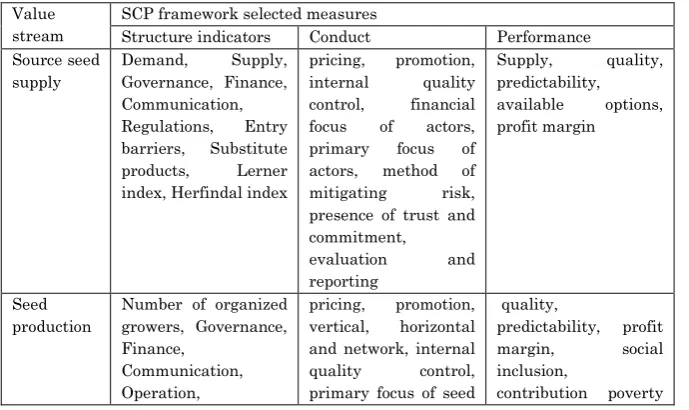
Table 2: Selected measures for SCP framework
Value stream
SCP framework selected measures
Structure indicators Conduct Performance Source seed
supply
Demand, Supply, Governance, Finance, Communication, Regulations, Entry barriers, Substitute products, Lerner index, Herfindal index
pricing, promotion, internal quality control, financial focus of actors, primary focus of actors, method of mitigating risk, presence of trust and commitment,
evaluation and reporting
Supply, quality, predictability, available options, profit margin
Seed production
Number of organized growers, Governance, Finance,
Communication, Operation,
pricing, promotion, vertical, horizontal and network, internal quality control, primary focus of seed
quality,
predictability, profit margin, social inclusion,
Regulations, Entry and exit barriers, Alternative enterprise
producers, method of mitigating risk, presence of trust and commitment
reduction and food security
Seed collection
Number of seed collectors,
Governance, Finance, Communication, Operation
Regulations, Entry barriers
pricing, promotion, vertical, horizontal and network primary focus, method of mitigating risk, presence of trust and commitment
quality,
predictability, profit margin, local value addition
Seed processing
Number of seed processing industries in the area, processing capacity, demand and supply, Governance, Finance, Communication, Regulations, Entry barriers
pricing, promotion, vertical, horizontal and network internal quality control, financial focus, primary focus, method of mitigating risk, presence of trust and commitment
quality,
predictability, profit margin, employment, local value addition
Seed distribution
Number of seed distributer in the area, demand and supply, Governance, Finance,
Communication, Operation,
Regulations, Entry barriers, Substitute products
pricing, promotion, vertical, horizontal and network, primary focus, method of mitigating risk, presence of trust and commitment
quality, predictability, profit margin, social inclusion, end user satisfaction, market share, contribution poverty reduction and food security
Market performance is ultimate outcome of value chain activities and measured generally by proportion of profit margins and nonprofit benefits gained by different value chain streams and players within the stream. In case of maize seed value chain, performance in the territory refers to the extent to which value chain result in outcomes like regular and predictable availability of quality maize seed in affordable price, equitable proportion of profits, and reasonable cost of marketing, processing, transaction and reasonable proportion of the prices received by farmers and paid by end users. The most important measure of value chain performance is achievements against strategic goals. In case of maize seed value chain, the performance includes reduced food insecurity and poverty, enhanced social inclusion and promoted local value addition and employment. Following measures are used for value chain performance.
to the end-user, value is added through e.g. logistical or administrative operations that increase the convenience and availability offered to the final consumer. Thus a given product, while perhaps physically unchanged, may have different values at different points in the value chain (Sphere 2014). Local value addition is measured as the difference between the value of the output and the value of primary and other inputs which have been used in value stream production process. The value added at different value streams is calculated by using following equation adapted from Sathre et al 2009.
( ) ( ) Where,
VAT = Total added value
VPP = Value of primary product
VBP = Value of by product
VPI = Value of primary Inputs
VOI = Value of other Inputs
Price spread: Price spread is percentage share of seed producers over end buyer price and used as performance measure of value chain is calculated by using following equation. It is interpreted as higher the value of price spread higher efficiency of the value chain.
100 * Pr (%)
Ppb p
PS
where,
PS = Price spread (%)
Prp = Price received by the seed producer (Rs) Ppb = Price paid by seed buyer (Rs)
1
I V ME
Where,
ME = Marketing efficiency (Index)
V = Value of the seed sold or buyer's price (NRs) I = Total marketing cost (including margins) (NRs)
Gross Margin: Gross margin derived by deducting total variable costs from total revenue for each value stream and interpreted during net margin distribution per kg of maize seed among the value streams in the maize seed value chain. The following equation was used to derive gross margin.
GM = TR – TVC
Return on investment: Return on investment on per kg of seed is calculated to understand the strength of the value chain to attract investment in different value streams.
100
*
cos
Re
(%)
Cost
Total
t
Total
venue
Total
ROI
Where,
ROI = Return on investment in percentage
Total revenue and cost is calculated per kg of seed during the given period of time, for farmers it is about ten month, for collectors it is about two month, for processers two month and for retailer it is about two month.
5. RESULT AND DISCUSSION
5.1. Maize sub sector in Nepal
increased with annual average of 16% during 2010 to 2015 which indicates domestic demand of maize is increasing sharply. The western Nepal (in this study mid and far western region) occupies 21 % of maize area and contributes 17% in national maize basket. The average yield in western Nepal is 2.02 metric ton per ha which 19% less than national average of 2.503 during 2015. This shows larger yield gap in attainable and existing one which is already large at national level (MoAD, 2015). Unavailability of improved variety quality seed among farming population is main constraint associated with others attributable to such yield gap.
There is huge gap between existing and attainable yield (estimated 5.7 mt/ha for improved varieties) which is largely contributed by unavailability of improved quality seed to the farming population. The annual domestic seed production of maize by private and public sector is 2330 mt which is 13% of total national maize seed requirement (MoAD, 2015).
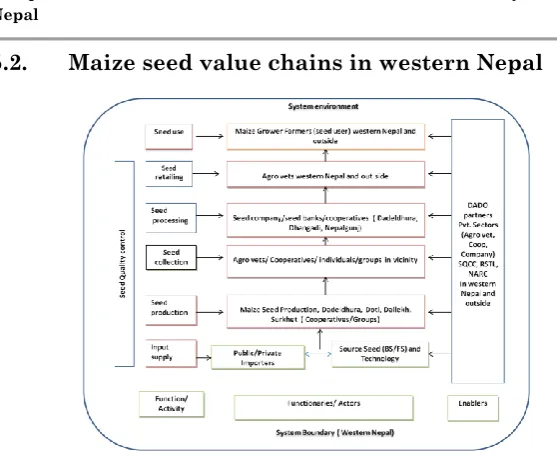
5.2. Maize seed value chains in western Nepal
Figure 1: Maize seed value chain in western Nepal
Historically the maize seed value chain was led by government owned Agriculture Input Corporation (AIC) and later the responsibility was shifted to National Seed Company (NSC). During the early period, improved variety maize seed was distributed by district agriculture development offices as minikits to disseminate improved varieties and farmers use farm saved seed of such varieties. With the development of transportation and market facilities private and community sector led maize seed value chain evolved and integration of agro vets in seed retail market expanded the business in the country. The maize seed value chain in the study area is still weak and not developed well and is a kind of partnership among public community and private sector to increase food security and reduce poverty among farming population being promoted by different governmental and non governmental agencies. There are five types of maize seed value chain functioning in western Nepal.
producer farmers - seed producer cooperatives/groups - seed processing industries - retailers - maize grower farmers
2. Source seed suppliers - seed
processers/cooperatives/groups - seed producer farmers - seed producer cooperatives/groups (process their own) - retailers - maize grower farmers
3. Source seed suppliers - district agriculture development offices - seed producers cooperative/groups- seed producer farmers - seed collectors - seed processing industries – retailers - maize grower farmers
4. Source seed suppliers (seed processors) - seed producer farmers - seed processing industries – retailers - maize grower farmers
5. Maize seed importers - retailers - maize growers farmers
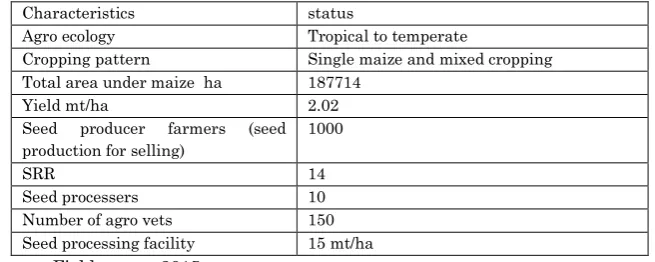
5.3. Characteristics of study area
Table 3: Characteristics of study area
Characteristics status
Agro ecology Tropical to temperate
Cropping pattern Single maize and mixed cropping Total area under maize ha 187714
Yield mt/ha 2.02
Seed producer farmers (seed production for selling)
1000
SRR 14
Seed processers 10
Number of agro vets 150
Seed processing facility 15 mt/ha
Source: Field survey 2015
6. STRUCTURE OF MAIZE SEED VALUE CHAIN
and functions are inbuilt in the given physical and policy environment. The structural indicators of maize seed value chain are grouped under three categories.
a. Demand, supply and concentration: There are 1050 farmers involved in maize seed production, 20 seed collectors, 8 seed processors and 150 seed retailers are operating in western Nepal during 2015. The total maize seed demand estimated in 2015 in western Nepal is about 1020 mt and found increasing by 8% during last five years. The market share of domestic improved varieties is about 80% and hybrid is about 20%. The demand of hybrid is increasing at 12% per year between 2010 - 2014 which is about 6% for domestic improved varieties. This shows demand of hybrid maize varieties is increasing at higher rate in comparison to domestic improved varieties. The market demand of maize seed is largely distorted by irregular government and nongovernmental organization programs to support maize production through improved variety seed distribution among target population. Similarly the demand of source seed for improved maize seed production is increasing 20% which is also largely determined by agency supported seed production programs. Among 200 surveyed seed growers 30% of farmers sell their produce directly to processer, 40% sell to cooperative, and 30% sell to local seed collectors.
Nepal Agriculture Research Council (NARC) in source seed production while seed processer market is not concentrated.
Table 4: Market concentration
Value chain category based on chain leader
Market share %
Si2
Private seed processing company led 60 0.36
Cooperative or farmer group led 20 0.04
Maize seed importer led 20 0.04
Herfindahl index 0.44
b. Competition and substitute products: There is increasing number of seed processers and seed retailers but seed producer farmers are not increasing at the same rate. There is competition among processers for seed collection and find prominent retailers to promote their business. There are only six varieties available for improved seed production and processors can only compete in terms of price and quality. There are five imported hybrid varieties competing with domestic maize varieties, and the price of hybrid varieties is 300 % higher than locally produced improved varieties. New domestic as well as joint venture companies are incoming which can increase competition among seed value chains.
Table 5: Lerner Index
Value stream Lerner index
Value chain leader Lerner index Seed producer 0.31 Private seed company 0.37
Collector 0.07 Cooperative /Farmer
groups
0.42
Processer 0.08 Importer 0.28
Retailer 0.09
Overall chain 0.37
c. Local infrastructure: The eight seed processing firms and cooperatives have modern seed processing facility of their own. The total processing capacity per hour is 10 mt and storage capacity of 3000 mt. There is good network of roads, technology service centers and three seed testing laboratories are hosted by western Nepal. The processing firms lack their own farm to carry source seed production activities and varietal testing however some firms have limited field trail facilities.
constructed through five point Likert scale among value chain actors is 0.37 which shows weak communication structure of maize seed value chain. Similarly the coordination index constructed is 0.42 which is also also indicates weak linkages. With these coordination, relationship and linkage characteristics, the structure of maize seed value chain is captive and directed in nature to some extent.
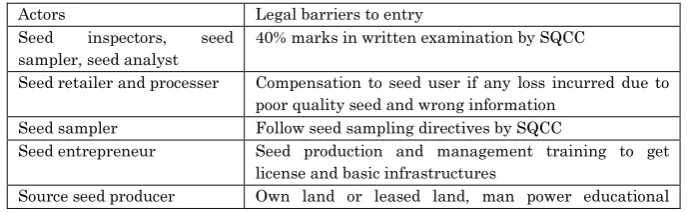
e. Barriers to entry: There are legal and operational barriers for different actors to enter in the seed value chain. Seed producers need training on seed production and required amount of source seed supply to be involved in seed production business. Seed processers, foundation/source seed producers, seed retailers, seed inspectors, seed testing laboratories need license from the government authority to be involved in mentioned functions. The license fee is nominal but need to fulfill certain technical requirements specified for particular function (Table 6). These all can be considered minimal barriers to entry in seed value chain and no other informal, associational barriers are in place to limit entry. The government is facilitating to processers and other actors to be involved in seed business to overcome technology and investment barrier. Credit facility is available to seed producers, collectors, processers and retailers based on existing rules of financial institutions.
Table 6: Entry barriers in maize seed value chain
Actors Legal barriers to entry
Seed inspectors, seed sampler, seed analyst
40% marks in written examination by SQCC
Seed retailer and processer Compensation to seed user if any loss incurred due to poor quality seed and wrong information
Seed sampler Follow seed sampling directives by SQCC
Seed entrepreneur Seed production and management training to get license and basic infrastructures
qualification of B.ScAg trained in seed production, seed storage facility
Hybrid seed producer Own land or leased land, man power M.ScAg (Breeder) trained in seed production, seed storage facility Seed testing lab License after fulfilled basic requirement Seed production and
distribution
Only registered varieties with truthful label
f. Financial ownership and focus: All the actors linked in maize seed value chain have independent ownership and no cross investment or joint ownership in any stream of value addition was found during study. None of seed collectors or processing enterprises invested in seed production activities with farmers and vise versa. This shows the cooperative structure of value chain and some time it is fragmented when there is only spot market relationship between value streams. Thus no value addition stream found with joint ownership making all actors concerned and strategically oriented about protection, competition and growth of seed value chain. All individual actors and streams are found concerned about their own operations, profitability and gain.
7. VALUE CHAIN CONDUCT
The conduct of maize seed value chain stream is measured by using selected three categories of indicators and most of them are measured in five point Likert scale and index is formed for relative comparison.
remaining is sold outside. However, this ratio fluctuates based on demand.
b. Coordination linkage and trust: Linkages are the business relationship among the value chain actors and trust is social capital embedded in such relationship. The coordination, relationship and linkage among actors is evolved in maize seed value chain to implement the decisions made, and proper implementation of rules, regulations, and directives to make consistent flow of improved variety quality maize seed in the market. The seed producer farmers are vertically coordinated, 80% of them sell their produce to the cooperative, collectors or processing firm with whom they have established relation and formed linkage. Only 20% farmers go outside the relational linkage to sell their produce. Similarly 60% of the seed retailers are loyal to the processor with whom they have relational linkage. Embedded trust refers level of confidence that value chain actors have that all actors will act as they say or are expected to act and their reliability. This also includes trust on fairness of rules, guidelines, official procedures, and dispute resolution. The level of embedded trust measured by Likert scale shows less than 0.45 which is low as business relations in value chain demand high level of trust among actors.
processing and retailing. There no similar association for seed producer farmers making
linkage outside their territory.
Vertical Linkage: In all four study sites there is vertical linkage established from seed producers to seed collector, processers, retailers and government agencies.
c. Embedded services
and facilities: These are the forward and backward services and facilities provided by value chain actors to each other being a member in value chain system. About 20% of collectors and 50% of seed processors provide source seed to the seed producer farmers, government agencies provide training on different aspect of seed production and support to processing enterprises. Generally in market conduct consumers or end users are entitled with certain facilities and services like warranty, repair and maintenance etc but in case of maize seed value chain no services are traced. There is no risk mitigation measures in practice associated with seed germination, poorer production and disease outbreak due to use of sold seed in the value chain system though is provision compensation in government directives.
8. VALUE CHAIN PERFORMANCE
The performance of maize seed value stream is measured in economic, local employment, poverty reduction, social inclusion and contribution to food security. Social inclusion, food security and poverty reduction are the important strategic goals for
government while promoting maize seed value chain. Food security is measured in terms of increased edible maize grain production through use of improved variety seed supplied by the value stream and income increased per head through involvement in maize seed production. Both dimensions contribute in poverty reduction through reduced expenditure and increased income.
a. Value added: The value addition from farm gate to end user farmers level for selected value chain in survey region was 100.5%. The largest value addition of 45% is at farmer level which is due to maize seed grain production and associated activities. The second largest value addition of 24% is at retailer level followed by 19% at processer level. The lowest value addition is at collector level which is about 12%. The 100.05% of value addition at local level and its rational distribution among actors shows the better performance of maize seed value chain against normal maize grain production. In addition to value addition there is employment generation and use of local materials at local level. The ROI is 45% for farmer, 8% collectors, 9% processers and 10% for retailers for six months and it will be nearly double on annual basis. The total ROI for overall maize seed value chain is 58%. The per hectare value addition for maize seed production is calculated NRs 70571 which implies increased area under maize seed production increase value addition at regional level.
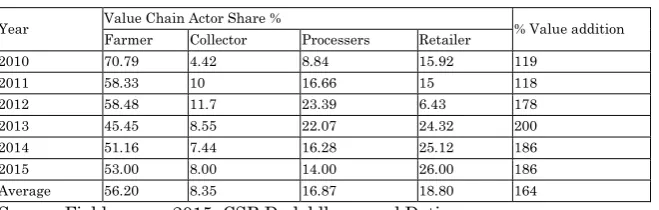
cooperatives and these are linked with unique and Panchsakti seed processing firm in Dhangadi. In this average farmers share is 56.20%, collector’s share 8.35, processers share is 16.87% and retailers share is 18.80%. There is decreasing trend of farmers share due to increasing number of seed producer farmers in the region, similarly increasing share of collectors is due to increased linkage outside the territory and retailers share is somewhat constant. When Gini coefficient is calculated for income distribution among seed producer farmer, collector, seed processer and retailer it is 0.75 which shows the higher level of income equality among farmers, collectors, processers and retailers.
Table 7: Value addition and net margin for actors
Actors
Costs Revenues Profits Margins ROI% Total cost NRs/kg Added cost NRs/kg % added cost Price NRs/kg Profit NRs/kg % total profit Gross margin NRs/kg % Retail price Farmers 22 58.0 32 10 45.2 32 53.3 45 Collector 32 2.4 6.3 37 2.6 11.8 5 8.3 8 Processors 45.9 8.9 23.5 50 4.1 18.6 13 21.7 9 Retailers 54.6 4.6 12.1 60 5.4 24.4 10 16.7 10 Total cost 37.9 100.0 100.0 100 58 Gini coefficient 0.75
Per ha value addition per year NRs ( net value addition * seed yield) 70571
Table 8: Value chain actors share in added value
Year Value Chain Actor Share % % Value addition Farmer Collector Processers Retailer
2010 70.79 4.42 8.84 15.92 119 2011 58.33 10 16.66 15 118 2012 58.48 11.7 23.39 6.43 178 2013 45.45 8.55 22.07 24.32 200 2014 51.16 7.44 16.28 25.12 186 2015 53.00 8.00 14.00 26.00 186 Average 56.20 8.35 16.87 18.80 164 Source: Field survey 2015, CSB Dadeldhura and Doti
the intermediaries were calculated as the percentage of buyer's price of the seed. The average price spread for 2015 was calculated 53.3% for overall maize seed value chain. How do the price spread was changing overtime is analyzed for community seed bank Amargadi Dadeldhura for which six years time series data were available and showed that price spread is declined over time 2011 to 2015 which indicates increasing number of seed growers in the same territory and market demand did not grow as per the seed production.
c. Marketing cost and efficiency: The marketing efficiency index for overall maize seed value chain was 0.58 which is low indicating poor marketing efficiency which was used proxy of value chain efficiency. While deriving marketing efficiency for each value stream it was 2.2, 6.4, 2.8, 5 for farmers, collectors, processors and retailers respectively. This shows collectors and retailers value stream is more efficient in comparison to farmers and processers.
Five years data were analyzed for community seed bank (CSB) Amargadi Dadeldhura to understand the trend over time which showed increased marketing cost and decreased efficiency of maize seed value chain over time this was due to unpredictable market demand due to different seed distributing programs by governmental and non governmental agencies.
Table 9: marketing cost and margin
Year Producers Rate/kg Buyers Rate/kg MC ME PS %
2010 24 35 11 2.2 69
2011 24 35 11 2.2 69
2012 28 45 17 1.6 62
2013 30 50 20 1.5 60
2014 32 55 23 1.4 58
2015 32 60 28 1.1 53
d. Poverty reduction: The recent Nepal Living Standard Survey (NLSS) 2010/11 shows that 25 percent of Nepali people are below the absolute poverty line. The official monetary poverty line in local prices is NRs 19,261 (CBS, 2011) per person per year. The most of the seed producers are small holders and residing in poverty prone areas. The increased income per head due to involvement in maize seed production has contributed in poverty reduction to some extent. The total 200 household with a population of 1183 received NRs 4600/ household per year. This is the production part there is employment generation along the value chain largely contributed in poverty reduction. Farmers involved in seed production produced 85 mt of improved seed which is about NRs 51 million at end user price. This value addition is spread among the chain actors and has largely contributed in poverty reduction. The Gini coefficient for income distribution from maize seed production shows there is inequality that is more concentrated toward small and marginal farmers which carries larger implication in poverty reduction. Based on annual household income category Gini coefficient also shows inequality favoring toward low income groups that also supports pro poor performance of maize seed value chain.
Table 10: Gini index for seed producer farmers
Category Ropni Number Proportion X Income NRs Proportion Y Cumulative proportion X*Y >20 5 0.03 61200 0.02 0.02 0.0005 >14 to <= 20 10 0.05 120000 0.04 0.06 0.0021 >10 to <=14 59 0.30 875800 0.31 0.37 0.0908 >5 to <=10 80 0.40 1174700 0.41 0.78 0.1651 <=5 46 0.23 613500 0.22 1.00 0.26 Total 200 2845200 GI 0.74 GI 0.74
e. Food security: Maize seed value chain has contributed in local and regional food security through two ways; first one is food security through income security among seed producers, collectors, processers, retailers and others able to get employment along the value chain, secondly increased maize productivity among maize growers through use of improved variety quality seed. The survey result has shown that there is average 17% yield increase among maize producers. This has increased 17 % yield increase over 2.2 mt/ha in 3835 ha of maize area. The maize seed supply chain increased 1434 mt additional maize in regional granary. Furthermore maize is staple crop among mid hill small farmers operating in rainfed condition where food security is of prime focus maize seed value chain has increased income and production for improved food security.
f. Seed quality and end user satisfaction : The survey results has shown that only 60 percent of the seed users are fully satisfied with quality and performance of seed and the remaining are waiting for suitable varietal options for their locality. Their dissatisfaction is basically associated with heavy nutrient uptake, difficulty in stalk removal, taste and long duration of the crop in comparison to their local varieties.
9. CONCLUSION AND RECOMMENDATIONS
grain production intervention need to be designed carefully so that there is least distortion in seed market.
ACKNOWLEDGMENT
CIMMYT International South Asia Regional Office Kathmandu Nepal for provided financial support for this study and we are thankful to them. Similarly we are thankful to seed producer farmers, seed collectors, traders, seed processers, retailers and District Agriculture Development Offices and staffs of the study area who supported one or other way during field study.
REFERENCES
1. Bolwig, S., Ponte, S., Toit, A., Riisgaard, L., and Halberg, N. (2010). Integrating poverty and environmental concerns into value-chain analysis: a conceptual framework. Development Policy Review, 28(2): 173-194. 2. Value Chain Management Center of George Morris
Center (2012). Characterizing the determinants of successful value chains. A paper prepared for the Canadian Agri-Food Policy Institute. [available www.capi-icpa.ca]
3. Central Bureau of Statistics (2011). Nepal Living Standards Survey 2010/11. Kathmandu: Central Bureau of Statistics.
4. Coe, N., Dicken, P., and Hess, M. (2008). Global production networks: realizing the potential. Journal of Economic Geography 8(3): 271-295.
6. Foreign Investment Advisory Service (FIAS), 2007. Moving towards competitiveness: a value chain approach. The World Bank Group, Washington, DC, USA.
7. Government of Nepal, Import Directory 2010-2014 [retrieved 25 July 2016. www.tepc.gov.np]
8. Gereffi, G., Humphrey, J. and Sturgeon, T. (2005). The governance of global value chains. Review of International Political Economy 12 (1): 78–104.
9. Gulati, R., Nohria, N., and Zaheer, A. (2000). Strategic networks. Strategic Management Journal, 21: 203-215. 10.Humphrey, J., and Schmitz, H. (2000). Governance and
upgrading: linking industrial cluster and global value chain research. IDS Working Paper No. 120. Institute of Development Studies/University of Sussex, Brighton, UK. 11.Krishnan, M., and Narayanakumar, R. (2010). Structure, Conduct and Performance of Value Chain in Seaweed Farming in India. The Journal of Agricultural Economics Research Review, 23: 505-514.
12.Kaplinsky, R., and Morris, M. (2001). A handbook for value chain research. Prepared for the International Development Research Centre (IDRC). [Available at: http://www.globalvaluechains.org/ docs/VchNov01.pdf. on 10 October, 2007].
13.Kula, O., Downing, J., and Field, M. (2006). Value chain program to integrate competitiveness, economic growth and poverty reduction. Small Enterprise Development, 17(2): 23-35.
14.Lastres, H.M., and Cassiolato, J.E. (2005). Innovation systems and local productive arrangements: new strategies to promote the generation, acquisition and diffusion of knowledge. Journal of Innovation: Management, Policy & Practice, 7(2/3): 172-187.
of net chains. Journal on Chain and Network Science, 1(1): 7-22.
16.Morrison, A., Pietrobelli, C., and Rabellotti, R. (2008). Global value chains and technological capabilities: a framework to study learning and innovation in developing countries. Oxford Development Studies, 36(1): 39-58.
17.Nadvi, K., (2004). Globalization and poverty: how can global value chain research inform the policy debate? IDS Bulletin, 35(1): 1-13.
18.Patrick, N. M., Henrietta, U.U., Fani, D.R., and Donald, D., (2016). Structure, Conduct and Performance of Sesame Farmers in Benue State, Nigeria. International Journal of Humanities Social Sciences and Education 3 (6): 31-35.
19.Ruben, R., & Zuniga, G. (2011). How standards compete: comparative impact of coffee certification schemes in Northern Nicaragua. Supply Chain Management International Journal, 16(2), 98–109.
20.Sathre, R., and Gustavsson L. (2009). Process-based analysis of added value in forest product industries. Journal of Forest Policy and Economics 11(1): 65-75. 21.Trienekens J. H. (2011). Agricultural Value Chains in
Developing Countries A Framework for Analysis International Food and Agribusiness Management Review, 14(2): 51-83.
22.UNIDO, 2009. Agro-value chain analysis and development the UNIDO approach. A staff working paper united nations industrial development organization Vienna
to international markets. Amsterdam University Press, Amsterdam, the Netherlands, 9-30.
24.Webber, C.M., and Labaste, P. (2010). Building competitiveness in Africa’s agriculture: a guide to value chain concepts and applications. The World Bank,
Washington, DC, USA. [Available at:
http://siteresources.worldbank.org/INTARD/Resources/]
AUTHORS’ PROFILE
RAJENDRA PRASAD MISHRA is PhD fellow at Agriculture and Forestry University, Department of Agriculture Economics Rampur Chitwan Nepal. He has more than 22 years of work experience in the field of agriculture extension, project planning, implementation and evaluation. He is Joint Secretary at Ministry of Agriculture Development Singh Durbar Kathmandu Nepal and currently working as Project Director Irrigation and Water Resource Management
Project DOA component (IWRMP). Email:
GANESH RAJ JOSHI holds a PhD in Agricultural Economics with
specialization in Resource Economics and Policy. He served as a Secretary in Environment, Forestry, Tourism and Agriculture Ministries of the Government of Nepal. He has published research and review papers on environment and climate change, agriculture, forestry and natural resources management and governance. Currently, he is working as a Commissioner in the Commission for the Investigation of Abuse of Authority, Nepal. He is also an Adjunct Professor in the Agriculture and Forestry University of Nepal. Email: [email protected]