net return for light grazing, $11 for moderate grazing, and $9 for heavy graz- ing. Including labor, the returns on invest- ment are 13, 10, and 12%, respectively.
Discussion
If the expense of labor is included, returns on the investment were 13, 10, and 12% for light, moderate, and heavy grazing. Still greater returns are possible. Certain per-head costs decrease in larger operations. For example, a storage shed serving 25 cows costs about $300, while a shed for twice this number would cost only $400. Labor costs can be lowered by increasing herd size and perhaps by use of liquid and range-block supplements.
If labor charges are excluded, net returns per acre of range were $1.88, $1.82, and $2.67 for the three grazing intensities. These values may be of in- terest to the landowner who is consider- ing the lease of grazing rights. While leases are always a matter of negotiation in the light of local conditions, a fee equal to 10% of net returns per acre may not be unreasonable when herd and range are carefully managed.
The ranges in this study were almost
fully productive throughout the decade. Now the tree crowns are beginning to close on some portions, and forage growth will diminish. Some increase will occur when the trees are thinned, perhaps at ages 15 to 18 years; but until the stands are harvested, forage will average perhaps half the present rate of 2,000 lb./acre. Consequently, cattle numbers must be de- creased or additional acreage provided. Per-acre returns from cattle will decline accordingly.
Still under the proviso of careful management, heavy grazing yields highest returns per acre of range and does not damage timber unduly. For reasons not entirely clear, the heavy-grazing herd in the present study had the poorest calf crops and lighter calves at market time. Perhaps increased supplementation or rearrangement of the feeding schedule would have increased beef production.
Literature Cited
Campbell, R. S., E. A. Epps, Jr., C. C. Moreland, J. L. Farr, and F. Bonner, 1954.
Nutritive values of native plants on forest
range in central Louisiana. La. Agr. Exp.
Sta. Bull. 488, 18 p.
Duvall, V. L. 1969. Comparison of supplemen-
tation methods for cow herds grazing
pine-bluestem range. J. Range Manage.
22:182-187.
Duvall, V. L., and L. K. Halls. 1963. Outlook
for beef cattle on southern forest ranges. In
Sot. Amer. Forest. Proc. 1962:76-79.
Halls, L. K., and V. L. Duvall. 1961. Profits and
cost of forest grazing. Forest Farmer
20(7):151-152.
Halls, L. K., R. H. Hughes, R. S. Rummell, and B. L. Southwell. 1964. Forage and cattle
management in longleaf-slash pine forests.
U. S. Dep. Agr. Farmers’ Bull. 2199, 25 p.
Kothmann, M. M., G. W. Mathis, P. T. Marion,
and W. J. Waldrip. 1970. Livestock produc-
tion and economic returns from grazing
treatments on the Texas Experimental
Range. Tex. Agr. Exp. Sta. Bull. B-1100,39
P.
Pearson, H. A., L. B. Whitaker, and V. L. Duvall. 1971. Slash pine regeneration under
regulated grazing. J. Forest. 69:744-746.
Pearson, H. A., and L. B. Whitaker. 1972. Thrice-weekly supplementation adequate for cows on pine-bluestem range. J. Range Manage. 25:315-316.
Whitaker, L. B., H. A. Pearson, and W. M. Monroe. 1970. Crossbred cattle-custom- built for piney woods range. La. Cattleman 70(9):8-g.
Yoho, J. G., G. F. Dutrow, and J. E. Moak. 1969. What it costs to practice forestry.
Forest Farmer 28(11):20-24, 26, 28,
30-31.
Evaluating
Zones
of Utilization
E. WILLIAM ANDERSON AND WILBUR F. CURRIER Highlight: A method of checking utilization has been devised and tested on public and private rangelands. It involves mapping and evaluating zones of utilization within a pasture or grazing unit. It presents guidelines for determining how grazing resources are being used and what needs to be done to improve efficiency: identifying areas that need special attention, ana- lyzing economic aspects, adjusting livestock numbers, and recording progress over a period of years. The procedure is relatively simple, inexpensive, meaningful, and easily used by resource managers on horseback, in a jeep or helicopter, or afoot. It requires only the usual equipment found on a ranch.
Grazing distribution problems within range pastures or grazing units are common. They are caused by such factors as
The authors are state range conservationist, Soil Conservation
Service, U. S. Department of Agriculture at Portland, Oregon, and
branch chief, Range Management and Improvements, Forest Service,
U. S. Department of Agriculture at Albuquerque, New Mexico.
The authors are grateful for the collaboration of many co-workers
and ranchers and the encouragement to present this procedure for
widespread consideration. Special acknowledgement is given Waldo R.
Frandsen, regional range conservationist (retired), Soil Conservation
Service, U. S. Dep. of Agr., Portland, Ore., for hu significant role in
developing, testing, and applying this procedure in various parts of the
West.
Manuscript received January 27, 1972.
JOURNAL OF RANGE MANAGEMENT 26(2), March 1973
topography, location of fences and salt, distances between watering places, grazing system used, kinds of grazing animals, weather, and shade location (Williams, 1954). In addition, range pastures often include variable combinations of range sites and plant communities on which utilization is seldom uniform. Zones of utilization, herein called use zones, usually result where such factors either concentrate or restrict grazing. As a result, forage on some areas within the pasture may remain unused, while at the same time, other areas are abused. Resolving these situations by corrective management is what practical range management is all about.
The purpose of this paper is to present a procedure for making and using a management check of a range pasture under practical operating conditions. The procedure involves judging classes of utilization on key species, mapping use zones within a pasture, and evaluating these zones and other data to determine the effects that the current grazing system and existing facilities and improvements collectively are having on the resources within the pasture.
Review of Literature
Utilization checks have long been a standard procedure in range management. Many of the methods for doing this are better adapted to collection of research data by scientists than to use by practicing resource managers. Studies of utilization have dealt primarily with detailed techniques of sampling, measuring, and estimating. Emphasis has been placed on accuracy of data and reliability of sampling. In most studies, the degree of utilization has been expressed in terms of percentage of total herbage that has been removed. Only in a few recent instances have reports mentioned mapping and analysis of use zones within a pasture.
Thorough reviews of range utilization studies have been made by Heady (1949) and Hedrick (1958). They include excellent lists of references not duplicated in this paper except for specific citation.
Campbell (1937) noted the need for something besides an acceptable measurement of forage utilization. He emphasized that the real problem was one of interpreting these measure- ments. Deming (1939) proposed nine classes of utilization and a system for recording on a map certain spot locations that had been observed. His method is probably the earliest recorded basis for further development of the use-zone concept. Pechanec and Stewart (1949) proposed observation of key areas within a grazing unit where examination of the whole range was not feasible. This is currently accepted as being appropriate if range management is not intensive enough to warrant an overall appraisal.
Humphrey (1949) preliminarily reported on the use-zone concept during its early developmental stages. He digressed into the use of flexible proper-use factors for each key species according to range condition class. This was not widely accepted because of problems inherent in proper-use factors. Hickey and Garcia (1964) mapped use zones to illustrate changes that take place in the grazing pattern when pastures are grazed by different classes of livestock. They interpreted the varying zones as presenting a problem of variable grazing patterns. They did not interpret these zones, however, as guidelines to corrective management. Kingery (1963) reported on mapping classes of utilization according to existing range site and condition class delineations and indicated that such reports were helpful in making management adjustments. Smith (1967) mapped use zones representing grazing patterns in relation to vegetational types. He thoroughly discussed the problems associated with use zones although he did not interpret these zones as presenting solutions to the corrective management needed. Anderson (1967) presented a 5-year case history (1949 through 1953) of how mapped use zones and their interpretation were used to improve grazing efficiency through additional improvements and corrective management in a planned grazing system. Reynolds and Martin (1968) mapped use zones within a pasture and interpreted them as presenting solutions to problems of grazing distribution that include additional water and salt locations, fencing, and
supplemental feeding.
Chronologically, these reports represent a growing aware- ness of the importance for periodically mapping zones of utilization within a range pasture and interpreting them to solve problems of grazing distribution. As range management becomes more intensified, there will probably be a greater need for this technique in respect to alternative solutions for obtaining planned use of the total resource.
Use Classes Number of Classes
Deming used nine classes; others used seven. Experience has proven this to be too many for practical range management because observers spend too much time trying to decide which class applies. A minimum of three classes should be used as they present the fewest, but not necessarily the easiest, choices.
Five classes are preferred by the authors for most situa- tions. After the central class representing safe use and the two extremes representing no use and severe use are defined, the remaining two classes are “in-betweens.” They provide an opportunity to rate situations that do not qualify for one of the three basic classes. Because of this feature, five classes seem to present the easiest choices to make except for those people who are “splitters.”
Names of Classes
Some thought should be given to naming of classes. For example, the name “proper” has been used widely for the central use class. This name has weaknesses that are worth considering because, if range is not used to a “proper” degree, it must therefore be used improperly. Heavy grazing may be entirely proper, biologically, under certain circumstances such as when a deliberate attempt is being made to clean up old weathered growth accumulated during a previous period of nonuse or deferment. Heavy grazing for a short period of time also might be economically proper under certain circum- stances. Of course, repeated or prolonged abuse of the resource would not be proper, safe, or judicious. On the other hand, too little use might be just as improper as is severe use. A better name for the centrB1 class is SAFE. Any other class, therefore, could be relatively unsafe economically, biologically, or both.
Five classes of utilization are recommended. Preferred names of these classes are NONE, LIGHT, SAFE, HEAVY, and SEVERE. Names of classes, however, are not as important as what they represent.
Description of Classes
If use zones are to be mapped within a range pasture, the differentiating characteristic for classes should be the degree of use on key forage species.
during the remainder of the growing season. If this key species is allowed to mature before grazing takes place, maintaining root and shoot growth is not involved. Then only about 3 to 4 inches of foliage needs to be left because this amount provides sufficient litter and stubble to reduce evaporation, protect growth buds, catch snow moisture, protect the plant crowns from freezing, and retard erosion and frost heaving (Anderson, 1969). The size of the plant canopy, however, influences the depth to which moisture penetrates (Ndawula-Senyimba et al., 1971). In dry climate areas this factor should be given special consideration in determining the amount of stubble to be left. On some kinds of range, the total herbage produced consists of a wide variety of species having approximately equal forage value for the kinds of grazing animals and season of use involved. Under these conditions, the significance of key forage species is reduced and it is practical to judge degree of utilization on the basis of a mass of vegetation rather than of a key species. For example, safe degree of use of some kinds of mountain meadow sites can be represented by an average 3- to 4-inch stubble on the portion of the plant community that produces the bulk of the forage.
Use-class descriptions also should contain brief accessory characteristics that help in the decision-making process of selecting the appropriate use class. The following illustration represents the kind of descriptions that have been used successfully for rangeland and grazed forest sites by the authors:
Use class Degree of use Description
None O-15%
Light 16-35%
Safe 36-65%
Very Little or no use of key forage plants.
Key forage plants lightly to mod- erately used. Practically no use of low-value forage plants. Key forage plants used about right for the season of grazing and sites involved. Some use of low-value forage plants.
Key forage plants closely crop- ped. Low-value forage plants generally being grazed. Tramp- ling damage may be evident. Key forage plants grubbed. Low- value forage plants carrying the grazing load and closely cropped. Trampling damage may be evident.
Heavy 66-80%
Severe Over 80%
Judging Degree of Utilization
The first step in judging degree of utilization is to decide which is the key species for the range site and ecological condition involved, kind of grazing animals, season of use, and management objectives. The second step is to decide what is the safe percentage of herbage that can be removed and thereby the desirable amount of stubble to be left on the key species in order to most nearly achieve the management objectives. Clipping several ungrazed plants of key species to simulate SAFE use establishes what safe degree of use looks like. The third step is to clip plants of key species to represent and demonstrate what SEVERE use looks like. The amount of grazing allowable in the NONE class is then established in a similar manner to complete the standards for the three major use classes. As previously stated, the other two classes are “in-betweens” for which standards need not be developed.
If naturally ungrazed areas on which to establish a visual yardstick for judging use in terms of stubble-left are not likely to be available, ungrazed check areas can be created by erecting wire cages prior to the grazing season.
A grazed range usually looks ragged because of varying degrees of utilization on portions of a single plant and from plant to plant. As a procedure, estimating average stubble-left for an area does not stress accuracy because it is not needed for this type of field procedure; consistency of judgment is more important.
Mapping Use Zones
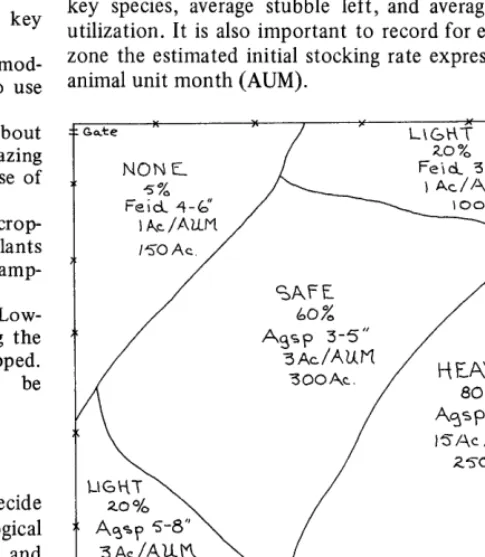
The best kind of base on which to map use zones is a clear aerial photo map showing range sites or vegetational types and physical features such as fences, water, and roads. Other kinds of maps, including roughly sketched maps, can be used (Fig. 1). The mapping procedure involves traversing the range pasture with sufficient coverage to obtain a general concept of how the key species have been utilized and the pattern of this utilization. Since features such as topography, rockiness, range sites, vegetational types, and distance from water affect grazing patterns, these features also are helpful in denoting the extent of use zones and mapping their boundaries.
The mapping of use zones usually begins at the entrance to the range pasture. The first step is to record on the map the name of the use class applicable to that location. Other information that should be recorded for each mapped use zone while it is being traversed includes name(s) or symbol(s) of the key species, average stubble left, and average percentage of utilization. It is also important to record for each mapped use zone the estimated initial stocking rate expressed in acres per animal unit month (AUM).
LEGEND: SAFE - Use class
60% - % use of key species Agsp 3-5" - Key species - stubble left
3 Ac/AUM - Estimated initial stocking rate for use zone 300 AC - Size of use zone
Fig. 1. Sketch map of a l,OOO-acre pasture illustrating a typical pattern of utilization as represented by use zones and data recorded during the management check.
Mapping proceeds as the pasture is traversed. When another use zone is observed, the name of the new use class and approximate boundary of the zone is recorded on the map together with the other information. Further traversing ex- tends boundaries of use zones until the entire pasture has been completed at which time the approximate number of acres within each use zone is recorded on the map as illustrated in Figure 1.
In some situations of intensive management or public land administration, it may be desirable to be more explicit about the degree of utilization than is represented by a broad use class. Such information may be needed for making important management decisions such as stocking adjustments because, for example, there is significant difference between 35% and 55% utilization, both of which may be grouped in the same use class. In such situations, mapped zones representing relatively narrow increments of percent utilization, within practical limits, will portray an intensive pattern of grazing on the map. Such narrowly defined zones then can be grouped according to the five use classes for evaluation purposes.
Timeliness
Periodic management checks, without mapped zones, made while “riding” during the grazing period are beneficial for observing use zones as they develop. These observations provide for adjusting livestock distribution at an early stage so as to reduce development of excessively used and unused areas.
Management checks in which use zones are mapped should be made at or near the end of the grazing period. An exception is made if the grazing period coincides with early stages of forage growth such as occurs in a turn-in pasture. In this situation, the management check should be made at the end of the primary growing season for key forage species. This is because only a portion of the total forage crop exists during the early-growth period. The amount of herbage remaining after early grazing can be compared with ungrazed production only after the primary growing season has ended. At this time, regrowth on grazed plants can be compared with ungrazed plants.
Data Analysis
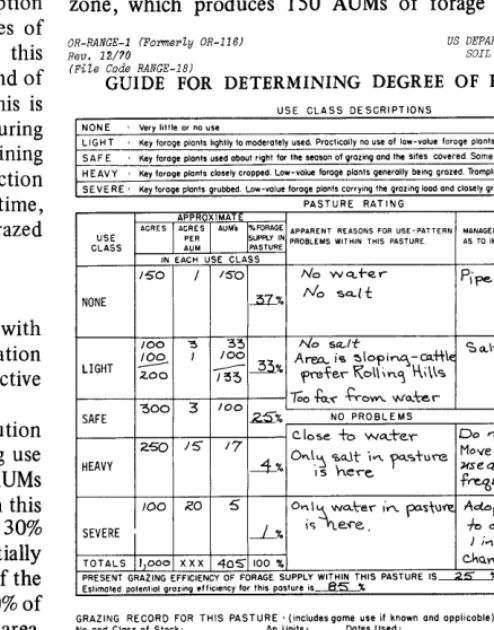
Figure 2 illustrates a data sheet used in conjunction with the use-zone map to provide a basis for evaluating the situation and formulating plans to install needed facilities and corrective management.
As illustrated, a serious problem of grazing distribution exists within this pasture even though the actual grazing use was only 68% of the estimated amount available (276 AUMs used, 405 available). About 25% of the available forage in this pasture received SAFE use, and this use zone represents 30% of the pasture area. Of the available forage, 37% essentially was unused (NONE zone), and this represents only 15% of the acres in the pasture. Grazing was lighter than SAFE on 70% of the forage crop, and this represents 35% of the pasture area. Although 35% of the pasture area was grazed more closely than SAFE, these acres produced only 5% of the forage crop. Efficiency of grazing use of the forage in this pasture at the time of the management check is 25%, which is the proportion of the total available forage that was grazed to a SAFE degree. To improve grazing efficiency, highest priority should be given to increasing grazing
zone) and reducing
use of the forage being wasted (NONE grazing use on forage being destroyed
(SEVERE zone). Significant problems also exist in the LIGHT and HEAVY zone, and these should not be neglected. A near- perfect grazing efficiency usually is impractical for most range pastures. It can be achieved, however, under conditions of level topography, uniform plant community, adequate and welldistributed water, and relatively small-sized pastures. Based on judgment and taking into account a feasible water development in the NONE zone, the potential grazing effi- ciency for this pasture was estimated to be 85%, or 345 AUMs of grazing, which establishes a goal.
It is important to note that analysis of the management check emphasizes the proportion of total available forage in AUMs, rather than acres, in each use class. Available forage is the logical basis on which to make decisions involving investments and corrective management if cost-return aspects are important to the decision-making process. This is because forage can be transformed into marketable products useful to humans, and in this way used to offset investments and expenses. Acres are important, however, for expressing the extent of a problem and judging potential improvement area by area.
Economic Aspects
Evaluation of a management check involves making deci- sions on needed improvements and on corrective management. The management check is useful for predicting benefits accruing from investments as illustrated by the following simple hypothesis.
Assume that it is practical to pipe water into the NONE use zone, which produces 150 AUMs of forage not now being OR-RANGE-l (Fomerly OR-1 16J US DEPARTMENT OF AGRICULTURE Rev. 12/70 SOIL CONSERVATION SERVICE
(File Code RANGE-18) OREGON
GUIDE FOR DETERMINING DEGREE OF RANGE USE
NONE Very little or no “se
LIGHT Key faroge plants lkghtly to moderotety used Prclctlcolty no use of low-value forage PlO”fS
SAFE Key forage plants used about right for the sepso” of grozmg and the sates covered Some use of low-value forage plants HEAVY Key forage pb”ts CIDICI~ cropped Low-value forage plants generally being grazed TrampIng domage may be evident SEVERE Key faroge plants grubbed Low-value forage plants carryng the grozlng lood and closely grazed
PhQTIIRF RdTlNG
.I
NONE .ai?% rJ0 salt
too 3 33 do sa_tt
LIGHT 9' 233y Area, is sbptnq-ca+)\e
Sa\t ir\ i&se areas
LOO 133 * $f&% Ko\\mj ws
100 20 5 OnI
A
water iv-L p&ore Adof.4 yrrrz;y syd=m_
SEVERE _!_% IS 0-e. $0 CL& r f-fun Ii* 3ym-5 and
TOTALS I,000 XXX 405 100 % cknqc 5usov\ mf age,
PRESENT GRAZING EFFlClENCY OF FORAGE SUPPLY WITHIN THIS PASTURE IS= Eshmpfed po,e”,,o, grozlng c‘tlclc”Cy for thll postWe IS-
GRAZlNG RECORD FOR THIS PASTURE / (mcludesgame use If known and opphcable) NO and Class of Stock An UrlllS 2 Dates Used’
Zfb cows w cc~v/es 216 Mu I+ - June 21
AUMs 270
Awroy 25-30 dppr b J&b IS - Mos 6 duzwva /
\cit. ar-Po~= frP.&
z?z GROWING SEASON CONDITIONS THIS YEAR Above average Averoge~’ Below average_
REMARKS
P STURE RATING MADE BY DATE 6/23 /71 ON ete,+ Rou &nel - B.Awdcm*\-R CUUIW PASTURE Sa,,a-e. Record plants&d I” tudgmg degree of range use on reverse side Of thus sheet
Fig. 2. Data sheet used in conjunction with use-zone map.
used. This water development probably would also help increase the grazing in the LIGHT zone. With proper stocking, salting, and some riding, the grazing pressure probably could be decreased in HEAVY and SEVERE zones, which could eventually improve ecological condition, plant vigor, and watershed quality, as well as production. If 85% potential grazing efficiency were attainable through a combination of water development and other measures, based on the esti- mated existing available forage, there would be about 345 AUMs of grazing available, or about 25% more than is currently being used. Additional forage resulting from im- proved condition and vigor over a period of years would further enhance the long-time feasibility of investment.
Additional AUMs attained by increasing grazing efficiency within this pasture have an annual value to this cattle ranch that can be compared with annual costs of increasing the efficiency. A common way of arriving at this value is to assign a market value per AUM. A better way of assessing this value is by using a “multiple-effect” approach, analyzing the various impacts that a 25% increase in AUMs could have on the entire ranching operation (Anderson and Jernstedt, 197 1). For example, additional AUMs and better grazing efficiency in this one grazing unit could contribute to an increased calf crop, increased weight of market animals, and reduced cow-cost for the entire ranch. This would be accomplished because addi- tional AUMs provide the opportunity and flexibility needed for adjusting management and improving other areas of the ranching operation. As similar measures for improved grazing efficiency are applied progressively over the entire ranching operation, this could also result in a significant increase in cow numbers. The incentive to develop a total-resource program coordinating both public and private lands in the ranching operation appears to be great. The probability of achieving improved ecological condition, watershed quality, and wildlife habitat concurrent with benefits to the livestock enterprise is good.
Adjusting Livestock Numbers
The foregoing discussion of economic aspects assumes that something constructive will be done to improve grazing efficiency. There are occasions, however, when decisionmakers decide to do nothing in spite of seemingly obvious economic or resource benefits. In this setting, the management check provides a guideline to the public resource manager for adjusting livestock numbers or length of grazing period to be compatible with resource management objectives.
For example, assume that the sample pasture is on public land. The management check shows 150 AUMs of available forage not now being used. If current management continues, this forage should be considered as unavailable. The available forage for this grazing unit becomes 255 AUMs, not 405. The proportion of available forage now in each use class is: LIGHT, 52%; SAFE, 39%; HEAVY) 7%; SEVERE, 2%. If 85% grazing efficiency on the grazable portion of the pasture is an acceptable goal, there are about 217 AUMs of grazing available, or about 21% less than currently being taken. A reduction of livestock numbers or shorter grazing period is involved. Since the estimated initial stocking (217 AUMs) is merely a starting point from which to judge the effects of management on the resource, future additional reductions likely will be required in order to attain acceptable grazing on HEAVY and SEVERE zones. These two zones often represent areas of natural concentration that will continue to be grazed
heavily under a continuation of the present kind of manage- ment even though livestock numbers are reduced. Obviously, a do-nothing approach is not prudent and only prolongs the eventual mandate to manage the public resource efficiently, which will be imposed with public insistence.
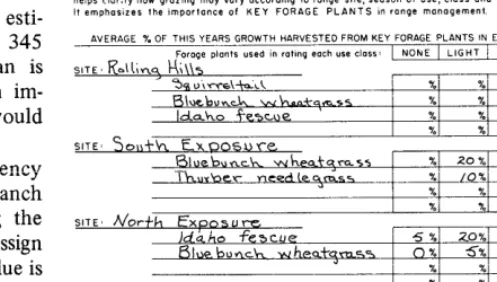
I_,*, the plants on which degree of use was judged for each different mo,or range site wlthm this pasture For each plant, show the average degree of use (I” percent) that occured wthln each apphcable use-CIOSS Th!s InfOrmotlOn helps clar.fy how graz,ng may wry accordmg lo range s,,e, season of use, class and kind of stock, weather. etc It emphosires the !mporfance of KEY FORAGE PLANTS m range management
AVERAGE % OF THIS YEARS GROWTH HARVESTED FROM KEY FORAGE PLANTS IN EACH USE CLASS
forage plants used I” rahng each use class NONE 1 LIGHT j SAFE 1 HEAVY SEVERE -
% % % % %
% % % % %
SITE
%I % % % %
% % % % %
* (v WI 'y 01
Fig. 3. Reverse side of data sheet used for collecting information on
utilization of forage species.
Recording Species Utilization
Figure 3 illustrates the reverse side of the data sheet used in conjunction with the map. Observations on degree of utiliza- tion for major forage species in the plant community of each range site can be collected in this manner, usually by specialists. Such information is valuable for improving guide- lines for judging grazing use on range sites.
Literature Cited
Anderson, E. William. 1967. Grazing systems as methods of managing
the range resource. J. Range Manage. 20:383-388.
Anderson, E. William. 1969. Why proper grazing use? J. Range Manage.
22:361-363.
Anderson, E. William, and Maurice L. Jernstedt. 1971. Evaluating
multiple economic effects of forage development and management.
J. Range Manage. 24:174-180.
Campbell, R. S. 1937. Problems of measuring forage utilization on
western ranges. Ecology 18:528-532.
Deming, M. H. 1939. A field method of judging range utilization. U. S.
Dep. of the Interior, Div. of Grazing (mimeo) 13 p.
Heady, Harold F. 1949. Methods of determining utilization of range
forage. J. Range Manage. 2:53-63.
Hedrick, D. W. 1958. Proper utilization-a problem in evaluating the
physiological response of plants to grazing use; a review. J. Range
Manage. 11:34-43.
Hickey, Wayne C., Jr., and George Garcia. 1964. Range utilization
patterns as affected by fencing and class of livestock. Rocky Mt.
Forest and Range Exp. Sta. Res. Note RM-21. 7p.
Humphrey, K. R. 1949. An analysis of forage utilization methods and a
proposal for utilization surveys by range condition classes, J. Forest.
47:549-554.
Kingery, Clarence E. 1963. Grazing use checks on the Wichitas. J.
Range Manage. 16:142-145.
Ndawula-Senyimba, M. S., V. C. Brink, and A. McLean. 1971. Moisture
interception as a factor in the competitive ability of bluebunch
wheatgrass. J. Range Manage. 24:198-200.
Pechanec, Joseph F., and George Stewart. 1949. Grazing spring-fall
sheep ranges of southern Idaho. U. S. Dep. Agr. Circ. 808. 34 p.
Reynolds, Hudson G., and S. Clark Martin. 1968. Managing grass-shrub
cattle ranges in the Southwest. U. S. Dep. Agr. Handbook 162.44 p.
Smith, Dwight R. 1967. Effects of cattle grazing on a ponderosa
pine-bunchgrass range in Colorado. U. S. Dep. Agr. Tech. Bull.
1371.60 p.
Williams, Robert E. 1954. Modern methods of getting uniform use of
range. J. Range Manage. 7:77- 81.