www.ijiset.com
Landsat ETM Plus Data Processing for Micro Level Soil Resource
Mapping: A Case Study
D.K.Tripathi
Department of Geography, Kamla Nehru Institute of Physical & Social Sciences Sultanpur, 228114, Uttar Pradesh, India
Abstract
Present study is an attempt to delineate, map out and generate micro level database on soil resources for meeting challenges of agricultural sustainability in Gauriganj block, Amethi district, Uttar Pradesh, India. The multispectral Landsat 7 ETM+ data of year, 2014 was processed using of remote sensing (RS) and geographic information system (GIS) for mapping and database generation. The study was performed applying standard visual image interpretation approach incorporating field check and attribute data. Digital image processing techniques were also applied for generating ad-on-data for visual image interpretation. The tools of ERDAS imagine 9.1 and ARC view 3.2a software were used for data processing. The entire study area was classified into 83 soil interpretation units and analyzed in GIS environment considering USDA soils classification system. Further, the soils of the study area were grouped into seven series. The study reveals that Landsat 7 ETM+ data can be effectively used for soil resource inventory and mapping. This study may prove a better input in planning for scientific management of soil resources and sustainable agriculture in the study area.
Keywords: Agricultural Sustainability, Remote Sensing, Geographic Information System, Standard Visual Image Interpretation Approach, Digital Image Processing, ERDAS Imagine 9.1, ARC View 3.2a.
1. Introduction
Agricultural sustainability in deteriorating agro-rural environment is a great challenge before scientists, researchers and decision makers of India. Over exploitation of soil resources without understanding its sustainable limit has caused extensive soil degradation and causing serious threat to present and future agricultural growth and sustainability. India ranks very high among the developing countries in respect of both, extent and severity of soil degradation. According to the latest reports of Department of Agriculture and Co-operation [1] 107 million hectares of area was found under various types of soil degradation.It is estimated that six billion tons of soils are eroded from crop land each year [2] .In some studies it is estimated that about sixty per cent of the cropped soil in the country is suffering from degradation problems [3], [4], [5] and has become incapable to produce the adequate food for sustainable livelihood of people distributed on it. About 40 percent of the total degraded soils of the country are still under cultivation which is an indication of environmental ignorance as well as farming compulsion of the peoples who are engaged in a perpetual war of friction with land
resources. On the other hand today the population has exceeded one billion and by 2025 at the current growth rate of 1.6 percent, it would be 1.37 billion .Four hundred million tons of food grain would be needed to feed this population [6] .It would therefore be necessary to plan soil resource management on sustainable basis at micro level. The reliable and up-to-date information on spatial extent, property and limitations of soil resources is a prerequisite for soil resource conservation and management in any region. Proper inventory and mapping of soils serve to gain spatial information on the soil resources and primarily help in meeting challenges of agricultural sustainability.
In the recent years, RS techniques coupled with GIS has emerged as a popular viable substitute due to its cost effectiveness and technological soundness [7] and offer permanent and authentic record of spatial patterns [8] . This technique has proved to be the most efficient, economical and reliable technique to prepare a comprehensive inventory of soil recourses and land use pattern of an area. RS data helps detection of soil boundaries admirably because of variations in spectral response of the different soils, attributable to their varied physical make-up and chemical composition [9]. The soil properties such as color, texture, mineralogy, organic matter, free carbonates, moisture and the oxides/ hydroxides of iron and manganese govern their spectral reflectance. The collection of information on these characteristics differences by remote sensing techniques reduces field work, overcome errors associated with subjectivity and able to generate soil map of inaccessible areas.
In India, a number of studies on soil survey were carried out by various scholars in deferent regions using aerial photographs [10]. Use of satellite remote sensing for soil survey and mapping received appreciation during early 1980s. Initially, works on soil resource mapping using satellite data were carried out by Mirajkar & Srinivasan,
2. Materials and Methods
2.1 Study Area
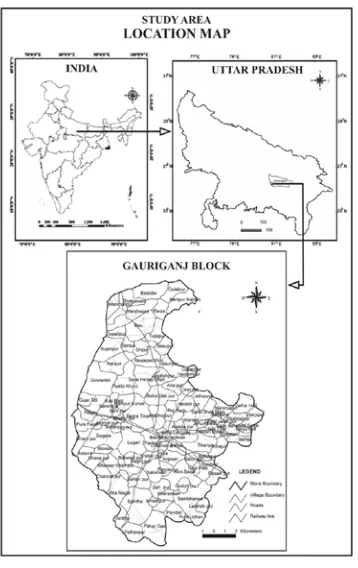
The study area has been undertaken in Gauriganj block (falls between latitude 2607’ 5’’ to 260 10’ 5’’ N and longitude 810 36’45’’ to 810 45’ 18’’ E) of Amethi district (Fig.1) which lies in the middle Ganga plain in the eastern part of the Uttar Pradesh, India. It covers an area of 207.56 km2, characterized by an even and featureless plain, composed of deep and fertile alluvium deposited by the Ganga River and its tributaries. The area enjoys the typical tropical, semiarid, monsoonic type of climate characterized by a dry and hot spring/early summer, a hot rainy season, a warm autumn and a cool winter [25]. The average annual rainfall is 977 mm, mainly received between July and September [26]. The winter rains are irregular and scanty. The mean maximum and minimum annual temperatures are 47.50 C and 4.10 C, respectively. The soils of the study area have been classified as Aquic Petrocalcic Natrustalf [27]
and represent a large area of man induced salt affected lands occurring in the Ganga alluvial plains. The block is economically backward and majority of the population (about 80 per cent) earns livelihood from agriculture and other allied activities. The soil degradation is one of the main environmental problems.
Fig. 1 Location of the study area
2.2 Materials Used
Research materials used in this study are: (i) Landsat Enhance Thematic Mapper (ETM+), Multi-spectral image (acquired in the year 2014) with bands - red, green and blue, 30m resolution (source: http://glcf.umiacs.umd.edu). Table 1 depict the Characteristics of the Lansat-7 ETM+ data used in this analysis (ii) Google Earth high resolution images (source: http://www.google earth.com) (ii) Village boundary map prepared by National Natural Resource Database Management System (NRRDMS) , Sultanpur (U.P.) (iii) Survey of India (SOI) Topographical sheets numbered 63 F ( scale 1:250000), 63 F/11, 63 F/12, 63 F/ 16 at scale 1:50000 (iv) Field training data collected through selective field survey with Garmin GPS map 76 Cx handset in the month of May,2014 (v) Soil Survey Report (source Sharda Sahayak C.A.D. Project 1988, Lucknow ) (vi) Information pertaining land use/ land cover through informal interview of the local people (vii) Arc GIS 9.3(ESRI) and ERDAS Imagine 9.1 (Leica Geosystems ,Atlanta, U.S.A.) packages.
Table 1: Characteristics of the Lansat7 ETM+ data
Sl.
No Parameters Characteristics
1 Spectral range (mm) 0.4-2.4
2 Spatial resolution (m) 30
3 Swath width (km) 185
4 Spectral resolution Variable
5 Spectral coverage Discrete
6 Number of bands 7
7 Spectral bands WL(nm) B1-450-520 B 2-530-610 B3 -630-690 B4 -780-900 B5-1550-1750 B7-2090-2350
2.3 Methodology
www.ijiset.com gain setting. Initially, the DN values were converted into
radiance values in ERDAS Imagine modeler using following formula[28], [29]-
L* = (Lmax-Lmin)/ Qcalmax *Qcal + Lmin--- (1) Where, L* is the spectral radiance at the sensors aperture W/(m2.sr.um), Qcal is the Calibrated Digital Number, Qcalmax is the maximum possible DN value (255 ), Lmax & Lmin is the maximum/minimum scaled spectral radiance value for a given band (provided in the header file).
The radiance values were converted into reflectance using the following formula:
ρP=(π*Lλ*d2 )/ ( ESUNλ*cosθs)--- (2)
Where, ρP is the unit less effect planetary reflectance, Lλ = (w/m2/ster/µm) is the band radiance, d is the earth-Sun distance in astronomical units (d=0.997052 for this case),
ESUNλ is the mean solar exo-atmospheric irradiances for
given wavelength in watts/m2/ µm/ster, θs is solar zenith angle in degrees.
To know the condition of vegetation cover on the soil of the study area the most frequently used Normalized Difference Vegetation Index (NDVI) was applied on reflectance image. The NDVI, is the ratio, respects the absorption of photosynthetic active radiation and hence it is directly related to the photosynthetic capacity and energy absorption of plant canopies [30], [31].The Landsat 7 ETM+ data provide spectral bands 1-8 ranging from visible to infrared wave lengths. The Landsat channels 3 (red) and 4 (near infrared) were used to compute the NDVI using following formula:
NDVI = DN Infra − DN Red / DN Infra + DN Red--- (3)
Where DN Infra is the gray of infrared band (the fourth band of ETM+ image), DN Red is the ray of red band (the third band of ETM+ image).By design, the NDVI varies between -1.0 and +1.0, but vegetation values typically range between 0.1 and 0.7. Higher index values are associated with higher levels of healthy vegetation cover, whereas index values near zero indicates the vegetation less green. The prepared NDVI image was used during image processing for soil mapping.
The most important output from analysis of remote sensing data is mapping and evaluation of soil resources of the study area. Various methods to delineate soil boundaries in remote sensing image data are in vogue. The method in most of the cases involves visual interpretation [32], [33].
However, computer aided digital image processing technique has also been used for mapping soil [34],[35] and advocated to be a potential tool [36],[37]. In the present study, on screen standard visual image interpretation method was employed. Before the image interpretation, a preliminary general traversing of study area was undertaken and some observations were recorded at few places. A legend was
formed to identify the tonal behavior of major land use/land cover and soils of the image. During this field visit training data were also collected for digital image analysis. Garmin GPS map 76 Cx handset was used to locate training data collection sites. The visual interpretation of image was performed in Arc GIS 9.3 considering image elements (such as tone, texture, shape, size, pattern, site, association etc.), author’s experience, ancillary data and terrain conditions. Eighty three soil interpretation units were broadly delineated on false colour composite (FCC) of the satellite data. To improve the image contrast for better delineation of soil boundaries, spectral enhancement and band combination techniques were used. NDVI and classified (maximum likelihood method) images were used as add-on data set to supplement the existing onscreen interpretation on False Color Composite of Landsat 7 ETM+ imagery. The information pertaining soil profile and their physical, chemical and biological properties collected earlier in Sharda Sahayak C.A.D. Project, 1988, Lucknow (U.P.) were incorporated during entire soil mapping process.
In order to establish relationship between the image elements and existence of soil units, a field visit was made again and ground truth were collected. Having located sample areas, the pocket of land which were interpreted as specific soil units were precisely located on the ground with the help of topographical sheets and observation were made regarding geotechnical elements.
The boundaries of soil units drawn earlier during preliminary interpretation phase were modified according to field observation and soil maps were finalized. The units having similar soil characteristics were merged and seven soil series were proposed. The soils series were further classified up to family level following USDA Soil Taxonomy system [38]. The entire soil mapping and area estimation was performed in Arc GIS 9.3 software.
For an objective assessment of mapping accuracy, 250 sample points on reference image were selected randomly and analyzed in ERADAS IMAGINE software using Accuracy Assessment option in the Classification dialog. The mapped layers were compared with ground truth data and Google earth high resolution images and error matrix was generated. The quantitative assessment of maps accuracy was performed by computing overall accuracy and Kappa Coefficient [39].
3. Results and Discussion
3.1 Soil mapping
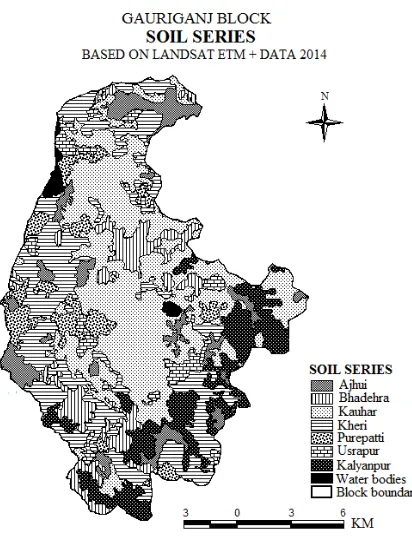
incorporating field check/training collection and digital processing techniques like image enhancement, band combination, NDVI, maximum likelihood gave good results for soil resource mapping. Delineation of soil boundaries on satellite image essentially involves their characterization through visual and /or computer - assisted interpretation in term of image elements like tone, colour, texture, shape, size, association, spectral responses, etc. In the present study, visual interpretation of Landsat 7 ETM+ data (2014) was performed in Arc GIS 9.1 for soil mapping. On the image of the study area 83 distinct mapping units were delineated on the basis of their spectral responses. Detailed information pertaining soil profiles and their physical, chemical and biological properties of each mapping unit were collected from soil survey report of Gauriganj block, Sharda Sahayak Command Area Development Project, 1988, Lucknow (U.P.). The information on soil composition in the interpreted sample strips was extrapolated to unsampled area. The mapping units having similar soil composition were merged together and made as single unit. The soils units were further processed and mapped up to family level following USDA Soil Taxonomy system [40], [41], [42]. In the study area seven soil series were recognized and mapped viz. Ajhuri, Bhaderha, Kauhar, Kheri, Purepatti, Usrapur, Kalyanpur (Fig.2 and Table 2).
Fig. 2 Soil series in Gauriganj block, Amethi District
Table 2: Soil series distribution in Gauriganj block, Amethi district, U.P.
Sl No
Soil Series Area (ha.)
Area (%)
No. of villages
1 Ajhuri 1137.26 5.47 38 2 Bhaderha 1505.26 7.24 36 3 Kauhar 8274.18 39.80 48 4 Kheri 3846.33 18.50 47 5 Purepatti 785.89 3.78 22 6 Usrapur 405.42 1.95 15 7 Kalyanpur 4617.68 22.21 23
The soil series is the narrowest category in Soil Taxonomy [43]. It consists of pedons (soil individual) that are grouped together because of their similar pedogenesis, soil chemistry, and physical properties. More specifically, each series consists of pedons having horizons that are similar in soil color, soil texture, soil structure, soil pH, consistence, mineral and chemical composition, and arrangement in the soil. The entire soil mapping and area estimation was performed in Arc GIS 9.3 software. The soils of the study area were grouped under two soil orders viz., Alfisols and Inceptisol .The soils of Alfisole order were further classified into Aqualfs and Ustalfs, at suborder level based on soil moisture and temperature and Inceptisol order were classified into Ochrepts and Ustepts suborders. Five great groups (namely Epiaqualfs, Haplustalfs, Haplustepts, Natraqualfs and Ustochrepts) and four subgroups (namely Aeric , Fluventic, Typic and Udic) were recognized in the study area. The soils further classified into five soil texture families namely Loamy, Coarse loamy, Fine, Fine loamy and Fine silty (Table 3)
Table 3: Soil classification under USDA system in Gauriganj block, Amethi district ,U.P.
Sl No
Soil Series Soil classification
1 Ajhuri Alfisols, Aqualfs, Epiaqalfs, Aeric Epiaqualf,Fine
2 Bhaderha Inceptisols , Ustepts , Haplustepts, Fluventic Haplustepts, Coarse loamy 3 Kauhar Alfisols, Aqualfs, Natraqualfs, Typic
Natraqualfs, Fine
4 Kheri Alfisols, Ustepts, Haplustalfs, Typic Haplustalf, Fine silty
5 Purepatti Inceptisols, Ochrepts, Ustochrepts, Udic Ustochrepts, Fine loamy
6 Usrapur Alfisols, Aqualfs, Natraqualfs, Typic Natraqualfs, Fine silty
www.ijiset.com
3.2 Soil Related Constraints
The soils of the study area exhibited many constraints for agricultural productivity. Soil degradation is a major agro-environmental problem in this study area. Several types of degraded soils together constitute 20.04 per cent (4171.51 ha) of the geographical area. About 3.81 per cent (793.20 ha.) area is strongly salt affected while nearly 4.63 per cent (964.10 ha.) area of the block is moderately salt affected. Water logging is also a major soil constraint in the study area. Permanent water logging accounts for 0.15 per cent (32.33 ha.) and seasonal water logging was observed on 7.09 per cent (1475.60 ha.) area.
4. Conclusions
In this study, Landsat 7 ETM+ image of the year 2014 was processed for soil mapping and database generation. Visual image processing technique incorporating selected field check/ training and collateral data was applied for this task. However, some digital image processing techniques such as spectral enhancement, band combination, NDVI and image classification (maximum likelihood method) were also used as add-on data set to supplement the existing onscreen visual image processing. As per USDA soil classification system, soils of the study area were grouped into two soil orders, four sub orders, five great groups, six sub groups, five families and seven series. The study clearly demonstrates the usefulness Landsat 7 ETM+ data and RS/GIS techniques for soil resource inventory, mapping and database generation at micro level. During the post-field interpretation post-field check, it was observed that the salt affected soil, water logging, soil erosion, deficiency of soil nutrients etc. are the major human-induced soil related constraints in the study area that lowers the current and /or future capacity of soil to support human life. The village level reliable soil database on spatial extent and types may prove a better input in decision making as well as in proper management of degraded lands in the study area.
Acknowledgments
The financial assistance provided by the Indian Council of Social Science Research (ICSSR), New Delhi to conduct this study is thankfully acknowledged. The author is also grateful to Scientist in-charge, NRDMS centre Sultanpur and teaching staff of the Agriculture Science Faculty, Kamla Nehru Institute of Physical & Social Sciences, Sultanpur (UP) for constant suggestions during the course of the study.
References
[1] DAC, “Draft Report on Status of Land Degradation in India,” Department of Agriculture and Co-operation, 1994. [2] V. Narayan, V. Dhurua and Ram Babu, “Estimation of soil
erosion in India”,J. of Irrigation and Drainage Engineering , vol.109, no.4,pp.419-33, 1983.
[3] J.L.Sehgal, and I.P. Abrol, “Soil Degradation in India: Status and Impact”, Oxford and IBH Publishing Co. Pvt. Ltd., New Delhi, India, 1994.
[4] C. Mandal, and D.K. Mandal, “Qualitative assessment of soil erosion from soil survey data: a case study of Nagpur district,” Geographical Review of India, vol.58, no.1, pp. 29-40, 1996.
[5] S. Biswas, S. Sudhakar and V. R. Desai, “Prioritization of sub watershed based on morphometric analysis of drainage basin,” Photonirvachak, vol.27, no.3, pp.155-166, 1999. [6] J. Patil, “Sustainable agricultural development: Issues and
programs,” Financing Agriculture, vol.35, no. 1, pp. 35-38, 2003.
[7] S. A. Rawashdeh, and B. Saleh, “Satellite monitoring of urban spatial growth in the Amman Area, ” Jordan. J. Urban Plann. Dev., vol.132,no.4(211),pp. 0733–9488, 2006. [8] A. Prakash, , R.P. Gupta, “Land-use mapping and change
detection in a coal mining area- a case study in the Jharia Coalfield, India, ” International Journal of Remote Sensing, vol.19,pp.391-410, 1998.
[9] R.L.Karale, “Remote sensing with IRS-1A in soil studies: development, status and prospects”, In: R.L. Karale (ed.) Natural Resources Management- A New Perspective. NNRMS, Bangalore, pp. 28- 143,1992.
[10] R. L.Karale, , K. R. Venugopal, and F. W.Hilwig, “Reconnaissance soil survey in the Ganges alluvial plain in Meerut District, UP”, Report submitted to IPI, Dehradun,1970.
[11] M.A. Mirajkar, and T.R.Srinivasan, “Landsat Photo interpretation for preparation of small scale maps through a multistage approach,” Photonirvachak , vol.3, pp. 87-98, 1975.
[12] NRSA , “An Application of Satellite Remote Sensing Techniques for Integrated Pilot Survey of Natural Resources in Parts of Punjab and Haryana – An Abstract Report, National Remote Sensing Agency, Secunderabad, India”,1976.
[13] NRSA, “Satellite Remote Sensing Survey of Natural Resources of Andhra Pradesh”, Project report, National Remote Sensing Agency, Secunderabad, India,1978.
[14] NRSA, “Satellite Remote Sensing Survey of Natural Resources of Haryana, Project Report, ” National Remote Sensing Agency, Secunderabad, India”,1979.
[15] NRSA, “Satellite Remote Sensing Survey for Soil and Land Use in Part of Uttar Pradesh, ” Project Report, National Remote Sensing Agency. Hyderabad, India,1981.
[17] L.Venkataratnam, “Use of remotely sensed data for soil mapping”, Photonirvachak, vol.8,pp.19-26,1980.
[18] M.Kudrat, S.K.Saha, and A.K. Tiwari, “Potential use of IRS LISS II digital data in soil land use mapping and productivity assessment”, Asian Pacific Remote Sensing Journal, vol.2, pp. 73-78, 1990.
[19]T.Ravisankar, and S. S.Thamappa, “Satellite data interpr etation and analysis for soil mapping”, In Soils and crops , L. Venkatratnam, T. Ravisankar, & R. Sudarshana (Eds.), Hyderabad, NRSA Publication,2004.
[20] B.R. Rao, M. Fyzee, and M.R. Wadodkar, “Utilityof remote sensing data for mapping soils at various scales and levels”, In Soils and crops , L. Venkatratnam, T. Ravisankar,& R. Sudarshana (Eds.), Hyderabad: NRSA Publication,2004.
[21] R. Milind ,Wadodkar , T. Ravisankar, “Soil resource database at village level for development planning” , J. Indian Soc Remote Sensing , vol.39, no.4,pp.529-536,2011. [22] S.K.Saha, M.Kudrat, and S.K. Bhan, “Erosional soil loss
prediction using digital satellite data and universal soil loss prediction-soil loss mapping in Siwalik Hills in India”, In: S. Murai (ed.) Applications of Remote Sensing in Asia and Oceania. Asian Association on Remote Sensing, Tokyo, pp. 369-372,1991.
[23] M.Kudrat, B. Prabhakaran, T.R.S.V.S.Sastry, A.K. Tiwari, , K.P. Sharma, and M.L. Manchanda, “Quantitative estimation of soil loss through remote sensing: A case study of part of Chotanagpur Plateau, India”, In: C.V.J. Varma & A.R.G. Rao (eds.), Management of Sediments: Philosophy, Aims and Techneques, Central Board of Irrigation and Power, New Delhi, pp. 37-44,1995.
[24] M.Kudrat, A.K. Tiwari, and S.K. Saha, “Modelling sediment yield for prioritization of sub-watersheds using remote sensing and GIS techniques”, Geocarto International, vol.12, pp.31-38, 1997.
[25] A. Mishra, and S. D. Sharma , “Leguminous trees for the restoration of degraded sodic wasteland in eastern Uttar Pradesh, India”, Land Degradation & Development, vol.14, pp. 245–261, 2003.
[26] S.D.Sharma, G.H.Khan, K.G. Prasad, “Selection of suitable provenances of Dalbergia sissoo for sodic lands”, Indian Journal of Forestry, vol.24, pp.58–64, 2001.
[27] Soil Survey Staff, “Key to soil Taxonomy”, USDA Soil conservation service, Washington DC, USA, 1994.
[28] B. L. Markham, and J. L. Barker, “Thematic Mapper band- pass solar exoatmospheric irradiances”, Int. J. Remote Sensing ,vol.8,no.3,pp. 517–523,1987.
[29] NASA, “Landsat 7 Science Data Users Handbook”, http://landsat.gsfc.nasa.gov/wp- content/uploads/2016/08/ Landsat7_Handbook.pdf, 2004. [30] P. J.Sellers, “Canopy reflectance, photosynthesis, and
transpiration”, International Journal of Remote Sensing, vol. 6, pp. 1335-1372, 1985.
[31] Myneni, R. B., F. G., Hall, P.J. Sellers, and A.L. Marshak, “The interpretation of spectral vegetation indexes”, IEEE Transactions on Geosciences and Remote Sensing, vol.33, pp. 481-486, 1995.
[32] R.L.Karale, Y.P. Bali, and K.V. Rao , “Soil mapping using remote sensing techniques”, Proceedings Indian Academy of Science and Engineering Sciences, vol. 3,pp.197-208, 1981.
[33] R.R. Biswas, “A soil map through landsat satellite imagery in part of the Auranga catchment in Ranchi and Palamon district of Bihar, India”, International Journal of Remote Sensing, vol.4, pp. 541-543,1987.
[34] G.F. Epema, “Processing thematic mapper data for mapping in Tunisia”, ITC Journal, pp.30-34, 1986.
[35] T.V. Korolyuk, and H.V.Shcherbenko, “Compiling soil maps on the basis of remotely sensed data digital processing: Soil interpretation”, International Journal of Remote Sensing, vol.15, pp. 1379-1400, 1994.
[36] K.S.Lee, G.B. Lee, and J.Tyler, “Determination of soil characteristics from thematic mapper data of a cropped organic- inorganic soil landscape”, Soil Science Society of America Journal, vol.52, pp.1100-1104, 1988.
[37] M.Kudrat, A.K.Tiwari, S.K. Saha, and S.K. Bhan, “Soil resource mapping sing IRS-1A LISS II digital data- A case study of Kandi area adjacent to Chandigarh (India) ”,International Journal of Remote Sensing, vol.13 , pp.3287-3302,1992.
[38] Soil Survey Staff, “Keys to soil taxonomy”, 11th ed. USDA/NRCS,U.S. Government Printing Office, Washington, DC.,2010.
[39] Y.M.M.Bishop, S.E. Fienberg, and P.W. Holland, “Discrete Multivariate Analysis Theory and Practice”, MIT Press, Carnbridge, Massachusetts, p. 557,1975.
[40] Soil Survey Staff, “Soil Taxonomy, A basic system of soil classification for making and interpreting soil surveys”, 2nd edition, Agricultural Handbook , Natural Resources Conservation Service, USDA, Washington DC, USA, pp. 869,1999.
[41] Soil Survey Staff, “Soil survey laboratory methods manual”, USDA/NRCS, Soil Survey Investigations Report No. 42. Printing Office, Washington, DC , 2004.
[42] Soil Survey Staff, “Soil survey field and laboratory methods manual”, Ver. 1.0. USDA/NRCS, Soil Survey Investigations Report No. 51, 2009.
[43] Soil Survey Staff, “Soil taxonomy: A basic system of soil classification for making and interpreting soil surveys”, USDA/SCS. Agric. Handbook, U.S. Government Printing Office, Washington, DC, 1975.
Author Dr.D.K.Tripathi, M.A (1992, BHU Varanasi, Goldmedallist),