Optimization of ECR-breakdown and plasma discharge
formation on T-10 tokamak, using X-mode second harmonic
of ECR.
A. Borshchegovskiy, M. Dremin, V. Il’in, N. Kirneva, A. Kislov, V. Krupin, S. Maltsev, Y. Pavlov, D. Petrov, I. Roy, D. Shelukhin and M. Sokolov
National Research Centre “Kurchatov Institute”, Russia
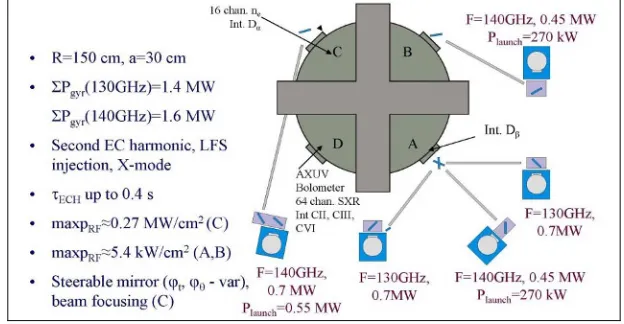
Abstract. In order to obtain breakdown and suitable plasma parameters for low-voltage OH start-up, high level of EC-power was injected into T-10 tokamak. Input HF-power was varied in the range of 0.15-1.0 MW. Two HF-launcher systems with different output beams allowed to inject EC-waves with maximum power density 0.25 MW/cm2
and 0.01 MW/cm2. Dependence of breakdown time delay on HF-power was obtained. It
was shown, that optimal plasma parameters were achieved in presence of plasma equilibrium currents I=3 kA (input HF-power=1.0 MW). Electron temperature Te=100÷150 eV and electron density ne=5•1012 cm-3 was measured in these discharges.
These parameters remained constant during full HF-pulse-length.
Introduction
Experimental studies of second harmonic EC pre-ionization and noninductive startup, that may be useful for inductive volts reduction in ITER or in low aspect ratio tokamaks, attract attention in recent years. EC usage in the initial stage in combination with other current drive techniques (low hybrid, neutral beam, helicity injection and electron Bernstein wave) can provide solenoidless inductive current ramp. [1-3]
Fig. 1. Status of T-10 ECH system and plasma diagnostics actual for presented experiments (2008).
C
Owned by the authors, published by EDP Sciences, 2012
The experiments presented in this work concern the optimization of breakdown on the second harmonic of ECR in the ITER tokamak. T-10 ECH system allows to launch 1 MW of RF power into tokamak vessel at the frequency of 140 GHz in X-mode with pulse length 0.4 s. One of the tokamak ports is supplied by the steerable focusing mirror, which give a possibility to increase significantly RF-power density in resonance zone. 16 channel interferometer, AXUV, spectrometry and light intensity measurements were used to analyze breakdown parameters. For all discharges deuterium was used as the pre-fill gas. No additional gas puffing was applied. Primary winding of tokamak was shorted.
Numerical simulation
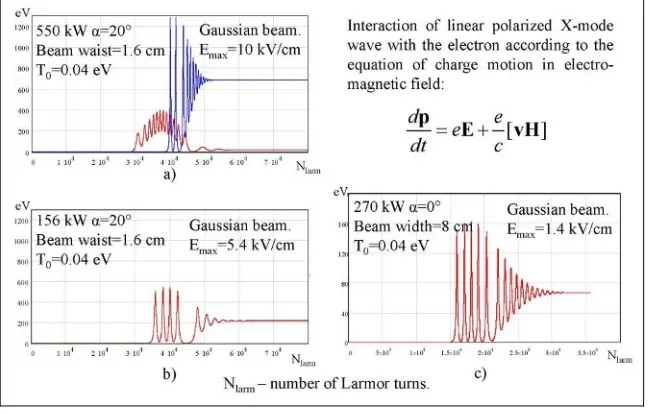
Analysis of interaction of linear polarized X-mode wave with the electron according to the equation of charge motion in electro-magnetic field was made.
]
[
vH
E
p
c
e
e
dt
d
(1)
E=E0cos(ωt-kx+φ) (2)
H=H0cos(ωt-kx+φ)+Htor, (3)
E – intensity of wave’s electric field, H – superposition of intensity of wave’s magnetic field and toroidal magnetic field.
RF beam shape describes as a Gaussian one.
2 ) ( 0 0 2
)
,
,
(
ro
e
P
P
ro
P
ro
(4)P0 – full RF-power, ro – beam half width
In the calculation initial electron energy corresponds to a room temperature (0.04 eV). All simulations were made for real parameters of RF beams in experiment.
So, electron can get an energy in the range 0÷700 eV, after the single passing through the focusing beam, in case of 550 kW of input power (Figure 2a) and 0÷230 eV for 156 kW (Figure 2b).
Fig. 2. Electron energy in RF beam.
Thus, the most shots in experiment were made with a focusing beam (“C” port) (Figure 1)
Experimental results
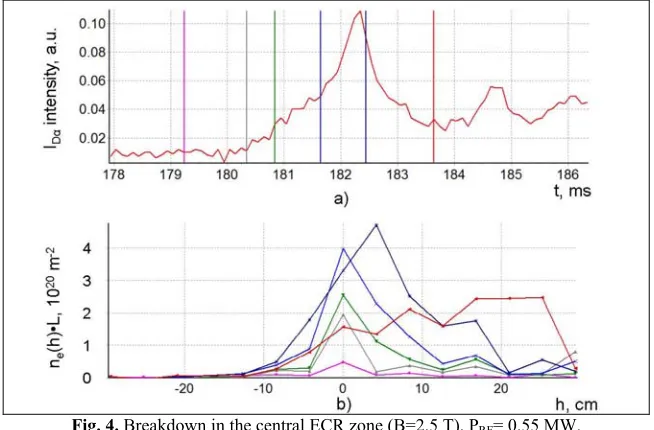
Typical waveform of EC breakdown shown on Figure 3a. Signals of IDα and line density appear in a several milliseconds after RF applying.
Interferometry measurements show the localization of discharge in accordance with the EC resonance position. Initial profiles have the clearly defined spike in corresponding ECR zone [4] (Figure 3b).
Fig. 3. EC discharge: a) time evolution of line density ne•L, IDα intensity, injection RF timing; b)
a
llocationdischarge in ECR zone (Prf=0.55 MW, toroidal injection angel α=10°, initial gas pressure P=(4.5÷6)×10-3 Pa). Initial stage of developing of EC discharge in the central ECR zone (B=2.5T) takes about 3÷3.2 ms (from 179.2 ms to 182.4 ms) (Figure 4a). Figure 4b shows time evolution of line density profile. Each profile of line density corresponds to the time, marked on IDα waveform.
Fig. 4. Breakdown in the central ECR zone (B=2.5 T). PRF= 0.55 MW.
Time delay of breakdown depending on applying RF-power has a non linear behavior similar to dependence on loop voltage in ohmic discharge [5] (Figure 5).
Fig.5. Time delay of line IDα appearance vs RF-power level.
Discharge optimization was realized by variation of pre fill pressure from 3•10-3 Pa to 1•10-2 Pa and vertical magnetic field from 0 Gs to 22 Gs. Parameters of discharge doesn’t significantly depend on toroidal launch angle.
In quasistationary stage of discharge with 1 MW of input RF power (Figure 6) plasma current [6] appears with value about 3 kA, loop voltage is about zero level, averaged electron density (central chord) riches 6•1018 m-3. Waveforms of I
Dα intensity from “C” port and IDβ from the opposite side “A” port look alike.
Fig.6. Quasistationary stage of discharge.
Fig.7. Time evolution of plasma current, electron density <ne>, injection RF timing.
(P=5•10-3 Pa, В ┴=15•10
-4 T, B
T=2.5 T, PRF=1 MW)
Energy losses measured by AXUV dramatically drop when the current disappears (Figure 8).
Fig.8. Chord distribution of IAXUV.
The value of electron temperature was estimated from the spectroscopic measurements (Figure 9).
Conclusions
• Optimization of discharge plasma parameters with pre-ionization using X-mode second harmonic ECR was performed on T-10.
• It was shown, that breakdown starts developing in ECR–zone, which allows to localize RF-discharge in suitable area of tokamak vessel.
• Ionization rate 2÷3•1021 electrons/sec was evaluated at the initial stage. According to this estimation the pre-filled gas is ionised completely during 3÷3.2 ms.
• Plasma equilibrium current value up to Ipl=3 kA (PRF=1 MW) was measured. The following parameters were achieved quasistationary: ne=5×1012 cm-3, Te≥(120÷150) eV.
• Plasma-wall interaction leads to outgassing and impurities intake (appearance of CIII, CVI lines). • Te≈ 5÷10 eV was estimated without current.
• Plasma current ramp-up experiments are in plans.
Acknowledgments
This work was supported by Ministry of Education and Science (contract No. 16.518.11.7004) and the State Atomic Energy Corporation ROSATOM (contract No. Н.4х.45.90.12.1023).
References
1. T. Yoshinaga, M. Uchida, H. Tanaka and T. Maekawa Phys. Rev. Lett. 96 125005 (2006) 2. G.L. Jackson, et al. Noninductive plasma initiation and startup in the DIII-D tokamak, Nucl.
Fusion 51 083015 (9pp) (2011)
3. J.A. Leuer, et al., Solenoid-free startup experiments in DIII-D, Nucl. Fusion 51 063038 (11pp) (2011)
4. N. Kirneva, et al, 34th EPS Conference on Plasma Phys. Warsaw, 2 - 6 July 2007, ECA Vol.31F, P-1.164 (2007)
5. V. Mukhovatov, et al, Plasma Phys. Control. Fusion 45 A235 (2003)