A Survey of Display Device Properties and
Visual Acuity for Visualization
Technical Report TR-2005-32
Amit P. Sawant, Christopher G. Healey
Knowledge Discovery Lab
Department of Computer Science, North Carolina State University Raleigh, NC 27695-8207
Email: [email protected]
Abstract
1
Introduction
Visualization is an area of computer graphics that manages and presents information in a vi-sual form to facilitate rapid, effective, and meaningful analysis and interpretation. Vivi-sualization is used in areas like geographic information systems, land and satellite weather information, scientific simulations, aerospace research, molecular biology, defense, and medicine. Visual-ization also supports more abstract domains, for example, program visualVisual-ization, data mining, and network security. In situations where user collaboration is required or time is a critical factor, visualization enables people to analyze and interpret vast amounts of information and make important decisions. The desire to extract knowledge rapidly and efficiently from large, complex datasets motivates the need for effective visualization systems [36].
More formally, a dataset D = {e1, .., en} containsn sample points, or data elements, ei. A multidimensional dataset represents two or more data attributes,A={A1, ..., Am},m > 1.
The data elements encode values for each attribute: ei = {ai,1, ..., ai,m}, ai,j ∈ Aj. A data-feature mapping converts the raw data into images that can be presented to a viewer. Such a mapping is denoted byM(V,Φ), whereV = {V1, ..., Vm} is a set of m visual features with
Vj selected to represent each attributeAj, andΦj : Aj → Vj maps the domain of Aj to the
range of displayable values in Vj. Visualization is thus the selection of M together with a viewer’s ability to comprehend the images generated byM. An effectiveM produces images that support rapid, accurate, and effortless exploration and analysis [20].
Knowledge of perception can be used to generate visualizations that harness the strengths of the low-level human visual system. Applying perceptual guidelines to “take full advantage of the available bandwidth of the human visual system” has been cited as an important area of current and future research in visualization [25, 38]. “Visual bandwidth” depends on the following criteria:
1. Physical characteristics of the display device (e.g., resolution in terms of the total number of pixels, and the physical size of the display).
2. Acuity of the human visual system (e.g., the limits of distinguishability of the human eye for different image features like color, orientation and size, and the visual angle subtended by elements on the viewer’s eye).
3. Visualization technique (e.g., the methods used to map a data element’s values to a visual representation).
4. Properties of the data (e.g., its dimensionality and number of elements) and the analysis tasks to be performed by the viewer.
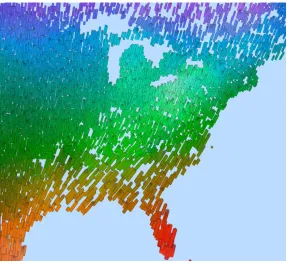
Figure 1: Visualization of a weather dataset using perceptual texture elements with temperature→hue, wind
speed→density, pressure→size, precipitation→orientation, and cloud coverage→luminance
One important goal of our work is to identify and extend these basic findings of display reso-lution and visual acuity to our visualization domain.
As an example of a typical multidimensional visualization, consider Figure 1 which visu-alizes a weather dataset made up of monthly environmental and weather conditions provided by the Intergovernmental Panel on Climate Change. This multidimensional dataset contains mean monthly surface climate readings in 12◦ latitude and longitude steps for the years 1961 to 1990 (e.g., readings for January averaged over the years 1961-1990 and so on). Individual weather readings (or data elements) are visualized using stroke glyphs (2D rectangular objects) that vary their color and texture properties. Hue represents temperature: blue strokes for cold temperatures to red strokes for hot temperatures. Density represents wind speed: more strokes displayed in a fixed area of screen space for stronger wind speed. Size represents pressure: larger strokes for higher pressure. Orientation represents precipitation: tilted strokes for heav-ier rainfall. Finally, luminance represents cloud coverage: brighter strokes for heavheav-ier cloud coverage.
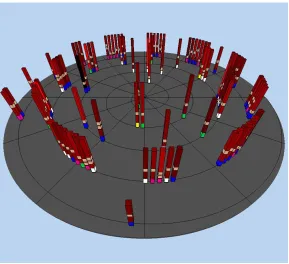
Figure 2 visualizes a more abstract dataset of query results representing movie recommen-dations from the MovieLens1 recommender system. MovieLens returns a movie’s title, its genre and a predicted user rating. This data was augmented with information taken from the
1MovieLens (movielens.umn.edu) is a collaborative filtering research site run by the GroupLens Research
Figure 2: Visualization of a movie dataset using perceptual texture elements with user rating mapped to spatial position and height, year mapped to colored flag at the bottom of the glyph, genre mapped to light brown flags at different heights, and length mapped to luminance
Internet Movie Database (IMDB)2to include the year the movie was released, the length of the
movie in minutes, and the IMDB rating of the movie. Tower-like glyphs are positioned along a spiral embedded in a plane based on how much MovieLens thinks the user will enjoy the movie (predicted user rating). The value of the user rating decreases as glyphs move away from the center of the spiral, that is, movies closest to the center of the spiral are the ones MovieLens ranked highest. Predicted user rating is also mapped to the height of each tower to reinforce this important value. Year is mapped to a colored flag at the bottom of the glyph: yellow for 1921 to 1940, green for 1941 to 1960, purple for 1961 to 1980, blue for 1981 to 2000, and white for after 2000. Genre is mapped to light brown flags wrapped around the glyph at differ-ent heights; the order of the flags from bottom to top represdiffer-ent Action, Comedy, Drama, and Romance, respectively. Since a movie can be classified into multiple genres, multiple genre flags may appear on a glyph. Finally, length is mapped to luminance (dark red for short to bright red for long) [36].
Most visualization algorithms to date (including the two examples shown above) assume that a sufficient display resolution will be available to generate visualizations that can be pro-cessed effectively by the viewer. The increased use of non-traditional display devices such as multi-projector powerwalls, responsive workbenches, high-resolution monitors (e.g., with 200 or more pixels-per-inch), PDAs, and mobile phones, each with different display characteristics,
can have a significant effect on a particular visualization technique. The physical size, pixel resolution, and standard viewing distance varies across different display devices. This directly impacts which part of a dataset we can display effectively. Another issue that needs to be con-sidered is the human visual system itself. For example, an on-screen element must subtend a minimum visual angle on the viewer’s retina to be distinguishable. Increasing a display de-vice’s pixel resolution (i.e., increasing pixels-per-inch and therefore decreasing the size of the on-screen elements) beyond a certain limit will produce diminishing results.
Consider a simple example of visualizing a large, multidimensional dataset on a typical CRT monitor, and assume that the viewer has zoomed in on a small subset of the dataset. At this point, a full-detail visualization containing as many attributes as can be shown effectively will be most useful. Now, if the viewer zooms out to see an overview of the entire dataset, only a few pixels of screen space will be allocated to each data element, and thus many of the visual features used to represent different data attributes may not be easy to distinguish. This “background clutter” could be counterproductive, since it may interfere with our ability to identify important data values at this low resolution. One possible solution is to have a visualization system that smoothly reduces the number of attributes it represents as the viewer zooms out, and redisplays the attributes as the viewer zooms in. The idea is to maximize the utilization of the display’s capabilities in an effective and efficient manner, maintaining a balance in the display environment: more elements with fewer attributes encoded, or fewer elements with more attributes encoded.
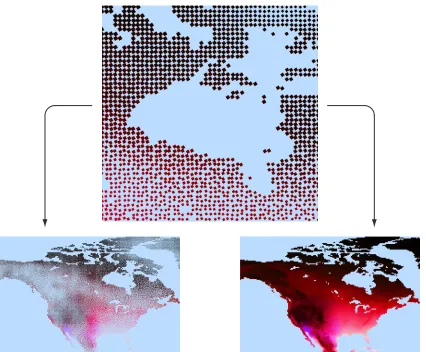
Figure 3 shows an example of this situation. The dataset being visualized is the same as used in Figure 1. In the top image temperature, pressure, wind speed, cloud coverage, and precipitation are mapped to hue, luminance, size, orientation, and regularity, respectively. In the bottom-left image the same data is visualized, but for the entire continent of North America. Because only a few pixels are available for each data element, many of the visual feature values are difficult to identify. Moreover, the presence of certain features (e.g., small sizes) interferes with our ability to see other features (e.g., color). In the bottom-right image the same elements are visualized, but the number of attributes are reduced to two: temperature and pressure. Since both hue and luminance are distinguishable even at small physical resolutions, the underlying data patterns are easy to identify.
An obvious question is: how can we define this kind of visualization hierarchy? The answer will depend on how many pixels (i.e., what display resolutions) are needed for a visual feature to represent information effectively, and how much physical size (i.e., what visual acuity) is needed for our visual system to accurately identify and interpret the visual feature. This survey summarizes what is currently known about these topics, and offers suggestions on how future research could fill in missing details, and then combine the results into a working visualization system. Understanding limits on display resolution and visual acuity will allow us to better validate a given visualization technique, and characterize to what extent the technique saturates “visual bandwidth”.
1. Dimensionality: as the number of attributes m in the dataset grows, additional visual features must be identified to represent each attribute; for largem, this may be difficult or impossible, necessitating the display of only a subset of the dataset’s attributes.
2. Number of elements: as the number of elementsnincreases all of the elements may not fit on-screen.
3. Visual-feature salience: each visual feature has strengths and limitations that make it suitable for certain types of data attributes and analysis tasks; an effective visualization needs to respect these properties.
4. Visual interference: different visual features can interact with one another, producing vi-sual interference; this must be controlled or eliminated to guarantee effective exploration and analysis.
Display resolution and visual acuity will further impact how a dataset can be visualized, for example, how many data elements and data attributes we can represent at once, and which visual features are best suited for displaying different attribute values.
The remainder of the survey proceeds as follows. In Section 2, we review the important physical characteristics of display devices. Section 3 discusses physical vision and visual acu-ity. Section 4 focuses on the properties of different visual features such as color, texture, and motion. Finally, Section 5 discusses conclusions and future work.
2
Display Device Properties
Properties of a display device that can have a significant effect on its visualization capabilities include: display resolution, physical size, and viewing distance. This leads us to ask: (1) What fraction of a dataset can a display represent effectively? and (2) What fraction of a display can a viewer attend to at any given time? The physical size and the viewing distance affect the visual angle formed by the object.
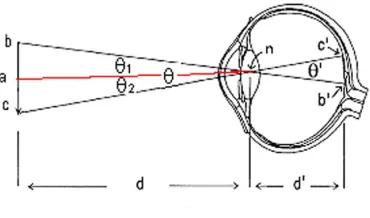
Visual angle is the angle subtended by an object on the eye of an observer. Visual angles are generally defined in degrees, minutes, and seconds of arc (a minute is 601 degree and a second is 601 minute). For example, a 0.4-inch object viewed at 22-inches has a visual angle of approximately 1 degree. In Figure 4, visual angle can be calculated as [47]:
θ
2 = arctan(
ab
d ) (1)
Figure 4: Visual angle subtended by an object on a human eye
2.1
Display Resolution
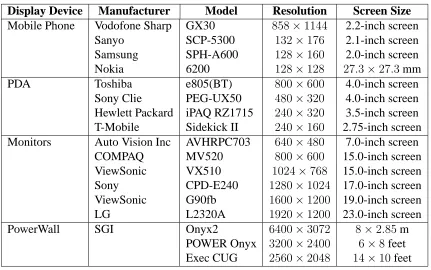
A display device’s resolution defines the number of pixels it contains, expressed in the hori-zontal and vertical directions. The sharpness of the display depends on its resolution and on its physical size. The same resolution will be sharper on a smaller monitor compared to a larger monitor because the same number of pixels are being spread out over a larger physical region [34]. We use the term display resolution to refer to the resolution and the physical size of a particular display device. Real-world data are visualized on a range of display devices such as computer monitors (traditional CRTs and LCDs), PDAs, mobile phones, and powerwalls3.
Ta-ble 1 shows common display resolutions for these types of display devices [26, 29, 30, 27, 28]. The low display resolution of devices like mobile phones and PDAs limits the amount of information they can display at any given time. A common display resolution for a PDA is
240×320 pixels at 3.5-inches diagonal. Consider the example of visualizing a large dataset on a PDA screen. This would allocate very few pixels to each data element. Even if the resolution is increased dramatically (i.e., a significant increase in pixels-per-inch), it would not fully resolve the issue. An element must subtend a minimum visual angle on the viewer’s retina to be distinguishable. Increasing pixels-per-inch beyond a certain point will produce diminishing results in terms of the amount of additional information a viewer can see. At the opposite extreme, a large display device such as a powerwall typically results in a large field of view (FOV)4. But, there is a limitation on the amount of information human eyes can perceive
based on the horizontal and vertical FOV. Also, as the FOV increases users have to utilize their peripheral vision [3], and it is a known fact that static visual features do not perform well under peripheral conditions [2].
2.2
Physical Size
Physical size is an important cue to sensory and judgment processes in humans. In a series of studies, Simmons [37] showed that users performed better on productivity tasks using large 21-inch monitors as compared to smaller ones. Chapanis and Scarpa [10] conducted experiments
Display Device Manufacturer Model Resolution Screen Size
Mobile Phone Vodofone Sharp GX30 858×1144 2.2-inch screen Sanyo SCP-5300 132×176 2.1-inch screen Samsung SPH-A600 128×160 2.0-inch screen Nokia 6200 128×128 27.3×27.3mm PDA Toshiba e805(BT) 800×600 4.0-inch screen
Sony Clie PEG-UX50 480×320 4.0-inch screen Hewlett Packard iPAQ RZ1715 240×320 3.5-inch screen T-Mobile Sidekick II 240×160 2.75-inch screen Monitors Auto Vision Inc AVHRPC703 640×480 7.0-inch screen
COMPAQ MV520 800×600 15.0-inch screen ViewSonic VX510 1024×768 15.0-inch screen Sony CPD-E240 1280×1024 17.0-inch screen ViewSonic G90fb 1600×1200 19.0-inch screen LG L2320A 1920×1200 23.0-inch screen PowerWall SGI Onyx2 6400×3072 8×2.85m
POWER Onyx 3200×2400 6×8feet Exec CUG 2560×2048 14×10feet
Table 1: Display Resolution of current display devices
comparing the readability of physical dials at different distances to examine the psychophysical effects of distance and size. They used dials of different sizes and markings that were propor-tional to the viewing distance so as to keep visual angles constant. They found that beyond 28-inches, dials were read more easily. The effects they found, however, were relatively small. Studies conducted by Desney et al. [13] suggest that users performed better on spatial orientation tasks that require mental rotation on large displays compared to desktop monitors. The visual angle was held constant by adjusting the viewing distance to each of the displays. Large displays provide users with a greater sense of presence, allowing them to imagine rotat-ing their bodies within the environment. Smaller display force users to imagine rotatrotat-ing the environment around themselves [9, 50]. Large displays normally cast a larger retinal image, offering a wider FOV. Czerwinski et al. [12] reports that a wider FOV increases the sense of presence and improves performance in 3D navigation tasks, many of which are important in visualization.
2.3
Viewing Distance
The standard distance to the viewer from the computer screen is approximately 22-inches [47]. For large displays such as powerwalls, the optimal viewing distance is about twice the width of the display [41]. As the viewing distance increases, the FOV decreases. For example, a 16-inch display placed 22-inches from the user produces a FOV of approximately40◦. Increasing the viewing distance to 30-inches reduces the FOV to30◦.
Display resolution for current display devices range from as low as128×128to as high as
6400×3072. A good visualization technique should take into account the display resolution, physical size, and standard viewing distance in order to maximize both the quantity and the quality of the information it displays. The number of pixels allocated to each data element is directly proportional to the display resolution. For a particular display resolution, it is im-portant to determine which visual features can be rapidly identified and which cannot, based on the number of the pixels that need to be allocated to each visual feature to make its values distinguishable. This knowledge is necessary to build data elements that generate effective and efficient visualization.
3
Physical Vision and Visual Acuity
3.1
Physical Vision
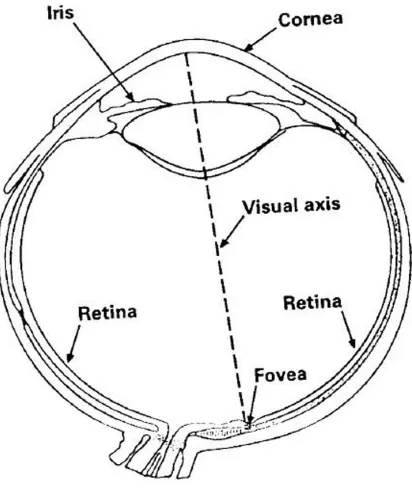
Figure 5 shows the internal structure of the human eye. The important features are: the retina, the lens, the fovea, the iris, the cornea, and the eye muscle. Light focused by the lens falls on the retina. The retina consists of two types of photosensitive cells: rods and cones. Cones are primarily responsible for color perception and rods are responsible for intensity, though they are typically ten times more sensitive to light than cones. There is a small region at the center of the visual axis known as the fovea that subtends 1 or 2 degrees of visual angle. The structure of the retina is roughly radially symmetric around the fovea. The fovea contains only cones, and linearly, there are about 147,000 cones per millimeter [14]. The fovea is the region of sharpest vision. As we move outward from the fovea, rods begin to appear among the cones, and at the edge of the fovea there are more rods than cones. The human eye contains separate systems to encode spatial properties such as size, location and orientation, and object properties such as color, shape and texture. These spatial and object properties are important features that have been successfully used by researchers in psychology for simple exploration and data analysis tasks such as target detection, boundary detection and counting, and by researchers in visualization to represent high-dimensional data collections [47].
Figure 5: Internal structure of a human eye
and motion in order for it to be perceptually identifiable?” More discussion about this can be found in the next section.
3.2
Visual Acuity
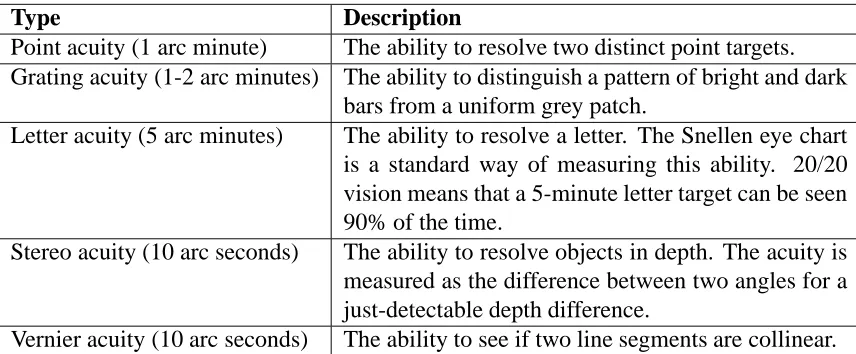
Visual acuities are measurements of our ability to see detail. Acuities are important because they define absolute limits on the information densities that can be perceived. Some of the basic acuities are summarized in Table 2 [47]. Visual acuity for a person with 20/20 vision5 is measured as the minimum angle of the viewing field that must be filled with an image to recognize one feature from the rest of the image (measured in “minutes”), 2020 = 1 minute [45].
Most of the acuity measurements in Table 2 suggest that we can resolve visual phenomena, such as the presence of two distinct lines, down to about 1 minute (601◦) of visual angle. This is in rough agreement with the spacing of receptors in the center of the fovea. For us to see that two lines are distinct, the blank space between them should lie on a receptor; therefore, we should only be able to perceive lines separated by roughly twice the receptor spacing. However, there are a number of superacuities, like stereo acuity and vernier acuity. A superacuity is the ability to perceive visual properties of the world to a greater precision than could be achieved based on a simple receptor model.
5A person with vision that is able to recognize at 20 feet what the average person with good eyesight can
Type Description
Point acuity (1 arc minute) The ability to resolve two distinct point targets. Grating acuity (1-2 arc minutes) The ability to distinguish a pattern of bright and dark
bars from a uniform grey patch.
Letter acuity (5 arc minutes) The ability to resolve a letter. The Snellen eye chart is a standard way of measuring this ability. 20/20 vision means that a 5-minute letter target can be seen 90% of the time.
Stereo acuity (10 arc seconds) The ability to resolve objects in depth. The acuity is measured as the difference between two angles for a just-detectable depth difference.
Vernier acuity (10 arc seconds) The ability to see if two line segments are collinear.
Table 2: Some basic acuities
Postreceptor mechanisms are capable of integrating the input from many receptors to obtain better single-receptor resolution. A good example of this is vernier acuity, the ability to judge the collinearity of two fine line segments. This can be done with amazing accuracy to better than 10 arc second. The resolution of the eye is often measured in cycles per degree and ranges from 12 arc minute (120 cycles/degree) to 1 arc minute (60 cycles/degree). Resolution of 1 arc minute allows one to distinguish detail of 0.01 seconds at 3 feet. Consider a display screen that is 20-inches wide and positioned 22-inches from the viewer. How many pixels across one scanline subtending 45◦ would it take to match human visual acuity? If we assume human visual acuity to be 12 arc minute, then we would need120·45= 5400 pixels to match our visual ability [46].
Neural postprocessing can efficiently combine input from two eyes. The area of the overlap is approximately120◦with 30-35◦ monocular vision on each side. Combined horizontal FOV is 180-190◦ and vertical FOV is 120-135◦ for both eyes [46]. This suggests that if the data elements in a visualization environment lie within this region of overlap they are identified more accurately than the data elements that lie in the monocular region. Campbell and Green [8] found that binocular viewing improves acuity by 7% as compared with monocular viewing. Interestingly, Campbell and Green’s findings suggest that we should be able to use the ability of the eye to integrate information over space and time to allow perception of higher-resolution information than is actually available on our display device. One technique for achieving higher-than-device resolution is anti-aliasing. There is also an intriguing possibility that the temporal-integration capability of the human eye may allow us to distribute information in a high-resolution image over a sequence of frames on a lower-resolution display in a way that the brain integrates back into a single, coherent result.
4
Visual Features
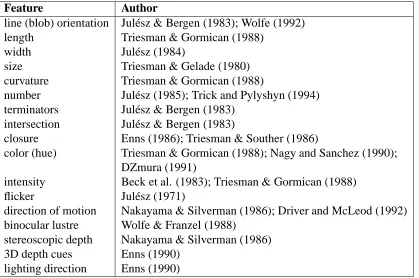
A variety of visual features have been used in visualization. Some of them are listed in Table 3 [19]. In this section we describe what we know about the visual features (hue, luminance, texture, and motion), and provide suggestions on how future research could fill in the missing details, and then combine this knowledge into a working visualization system that defines a visualization hierarchy. The next few sections discuss hue, luminance, texture, and motion properties based on domain, visual interference, and spatial frequency, then present examples of each feature within a visualization display.
Feature Author
line (blob) orientation Jul´esz & Bergen (1983); Wolfe (1992) length Triesman & Gormican (1988)
width Jul´esz (1984)
size Triesman & Gelade (1980) curvature Triesman & Gormican (1988)
number Jul´esz (1985); Trick and Pylyshyn (1994) terminators Jul´esz & Bergen (1983)
intersection Jul´esz & Bergen (1983)
closure Enns (1986); Triesman & Souther (1986)
color (hue) Triesman & Gormican (1988); Nagy and Sanchez (1990); DZmura (1991)
intensity Beck et al. (1983); Triesman & Gormican (1988) flicker Jul´esz (1971)
direction of motion Nakayama & Silverman (1986); Driver and McLeod (1992) binocular lustre Wolfe & Franzel (1988)
stereoscopic depth Nakayama & Silverman (1986) 3D depth cues Enns (1990)
lighting direction Enns (1990)
Table 3: Different Visual Features used in Visualization
4.1
Hue
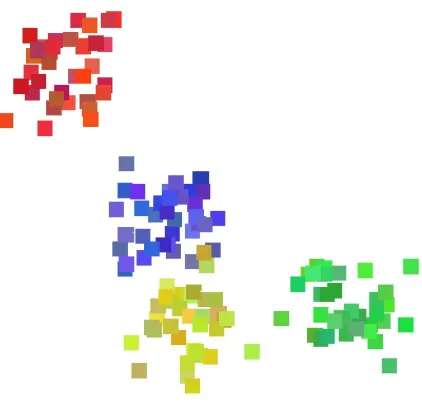
Figure 6: An example of Ware and Beatty’s coherency visualization technique, the four clouds of similarly-colored squares represent four coherent groups of data elements
balanced color models with nonlinear mappings to emphasize changes across specific parts of an attribute’s domain, and have also proposed automatic colormap selection algorithms based on an attribute’s spatial frequency, continuous or discrete nature, and the analysis tasks to be performed. Experiments have shown that color distance, linear separation, and color category must all be controlled to select discrete collections of distinguishable colors [16, 18].
Results show that the preattentive nature of a color depends on the saturation and size of the color patch as well as the degree of difference from its surrounding colors. As a rule of thumb, 12◦ of visual angle is probably a minimum size for color-coded objects in order to avoid small-field color blindness [47]. One of the limitations of using color as a visual feature is that in peripheral conditions humans are almost colorblind [51] and hence the ability to differentiate between colors drops off drastically at the periphery. Healey showed that at most seven isoluminant colors can be rapidly distinguished from one another in a display [16]. Hue is best suited to represent low spatial frequency nominal data.
One example use of color was proposed by Ware and Beatty to display correlation in a five-dimensional dataset [11]. Each of the five data attributes is mapped to one of the following visual features: position along the x-axis, position along the y-axis, red color, green color, and blue color. The result is a two-dimensional display of colored squares, each square representing an element in the dataset. Figure 6 shows that groups of elements with all five attributes in common will appear as a spatial cloud of similarly-colored squares.
4.2
Luminance
Figure 7: Isomorphic colormap for high spatial frequency data. The high frequency colormap reveals more information in the radar data.
variations in its values) is best represented using luminance. Luminance is also best suited to represent ordinal data. Levkowitz and Herman studied the problem of creating colormaps for data visualization [23]. They knew that a grey-scale (i.e., luminance-based) colormap can provide somewhere between 60 and 90 just-noticeable difference (JND) steps. They attempted to build a linearized optimal color scale (LOCS) that offers a larger perceptual dynamic range during visualization. Levkowitz and Herman showed that an LOCS with 32 values has a per-ceived color-pair difference six times larger than a linear grey-scale colormap with 32 values [17]. Some other possible color scales are non-linearized grey scale, heated object scale, rain-bow scale, and linear optimized color scale.
Previous work reported in [5, 6, 7] showed that a random variation of luminance can inter-fere with the identification of a boundary between two groups of difinter-ferently colored elements. Callaghan suggests that intensity is more important than hue to the low-level visual system during boundary identification [5]. In practical terms, this suggests that our low-level visual system “sees” luminance patterns first, and then hue patterns.
Figure 7 shows a radial sweep from a weather radar sensor, measuring the high spatial fre-quency variation of reflected intensity (e.g., from thick clouds). The luminance-based colormap being used offers a good representation of the minute details in the data [35].
4.3
Texture
Texture refers to the characteristic appearance of a surface having a tactile quality [40]. Texture can be decomposed into a collection of fundamental perceptual properties. Researchers in computer graphics have applied density, height, regularity, directionality, contrast, size, shape, coarseness, and orientation to display information [15, 32, 33, 39]. Individual values of a data attribute can be used to control one of the texture dimensions. The result is a texture pattern that changes its visual appearance based on the underlying data within a dataset.
differences in height are detected preattentively by the low-level visual system [1, 42]. Results from [22] suggest that height is best suited to represent quantitative data, and can support up to five discrete values. Experimental results have shown that hue and luminance cause visual interference with height [22]. In Figure 2, predicted user rating is mapped to the height of each tower such that the taller the glyph, the higher the user rating and vice-versa.
Density is an important visual feature for performing texture segmentation and classifica-tion [39]. Results from [22] suggest that density is best suited to represent low spatial frequency ordinal data. Hue, luminance, and height cause visual interference with density [22].
The visual system differentiates orientation using a collection of perceptual direction cat-egories. Some researchers believe only three categories of orientation exist: flat, tilted, and upright. Wolfe suggests orientation might be divisible into four categories: steep, flat, left, and right [49]. More recent work found that 2D orientation can be used to encode information [48]; a difference of15◦ is sufficient to rapidly distinguish elements from one another. Based on perceptual experiments, it was found that hue and luminance cause visual interference with orientation [22]. In Figure 1, precipitation is mapped to orientation such that vertical strokes represent little or no rainfall and horizontal strokes represent high rainfall.
Regularity refers to the uniformity of a texture element’s spatial position, and is a visual feature that is commonly used to perform texture segmentation and classification in computer vision algorithms [39]. In the human visual system, however, differences in regularity are difficult to detect. Regularity can normally encode only binary information, and is best suited to represent low spatial frequency data. Hue, luminance, height, and density all cause visual interference with regularity [22].
4.4
Motion
Motion is a visual feature that possesses strong perceptual cues. Motion elicits “pop-out” ef-fects in which moving objects can be searched in parallel by the visual system [43]. Motion aids in the process of grouping elements and is effective at providing a general overview of trends in data [4]. The human visual system can also perceive, track and predict movement. Results have shown that motion detection does not deteriorate at the periphery. Motion com-pares very favorably to color and shape if we are concerned with designing icons to attract a user’s attention at the edge of a computer screen [2]. Motion comprises of different features such as motion shape, frequency, amplitude, direction, phase, flicker, and velocity.
Flicker refers to a repeating on-off pattern applied to an image or an object, and is normally measured as the frequency of repetitionF in cycles per second (cps). The rate at which suc-cessive images need to be presented in order to perceive continuous motion is known as the critical flicker frequency (CFF).F = 60 cps is an often-cited rule of thumb for the CFF, but this number varies depending on the color, brightness, or size of the object being displayed, and on its eccentricity (i.e., the distance in visual angle from the viewer’s current focal point to the object). Huber et al. found that for rapid and accurate target detection, flicker must be coherent and must have a cycle length greater than 120 milliseconds [21].
elements with similar values. Differences in the direction of motion of glyphs provide cues to help identify individual elements that differ from the neighboring background glyphs. Humans can preattentively and simultaneously track up to five unrelated motion trajectories in the same visual field [31]. Huber et al. found a target patch of moving glyphs can be rapidly and accurately detected within a field of moving glyphs when the angular difference is greater than
20◦[21].
The velocity that objects move with is a third property of motion that is rapidly detectable by our visual system. van Doorn and Koenderink showed that higher initial velocities produce a faster response to a change in the velocity [44]. This is due to the need for the target to traverse a “critical distance” before it can be detected. Follow-on work by Mateeff et al. [24] showed that for a baseline velocityV1and a target velocityV2= 2V1, approximately 100 milliseconds is needed to see the velocity change fromV1toV2 for slowV1(1◦per second) and approximately 50 milliseconds for faster V1 (2◦ per second or higher). Huber et al. found that velocity of motion must differ by at least0.43◦ of subtended visual angle in order to distinguish between different velocities [21].
4.5
Display Resolution and Visual Acuity for Visual Features
Most visualization techniques assume that sufficient display resolution is available and our visual acuity is adequate to complete the required analysis tasks. But, as established in the previous sections, this may not be true. Thus, it is important to determine how many pixels are needed for a visual feature to represent the values of a data attribute effectively, and how much physical size is needed for our visual system to accurately identify and interpret the visual feature. There has been little research to date in this area, particularly in the visualization community. Thus, an important research opportunity is to find out how display resolution and visual acuity affect the mapping of a data attribute to a particular visual feature on a given display device.
5
Conclusions and Future Work
The desire to extract knowledge rapidly and efficiently from large, complex datasets motivates the need for effective visualization techniques. This report suggests that a visualization tech-nique must consider display resolution, physical size, and standard viewing distance in order to maximize the utilization of a display’s capabilities in an effective and efficient manner. This report also shows how display resolution and visual acuity can affect the expressiveness of a visualization technique, and begins to characterize to what extent a given technique saturates “visual bandwidth”.
that will allow us to determine how many pixels are needed to distinguish different values for a particular visual feature, and what visual resolution is required to “see” the feature. We can then accumulate this knowledge and build a system that allows us to dynamically add or remove information based on a display’s resolution properties, our visual abilities, and the type and amount of data we are trying to visualize.
References
[1] AKS, D. J.,ANDENNS, J. T. Visual search for size is influenced by a background texture gradient. Journal of Experimental Psychology: Human Perception & Performance 22, 6 (1996), 1467–1481.
[2] BARTRAM, L. R. Enhancing Information Visualization with Motion. Ph.D. thesis, Simon Fraser University, Canada, 2001.
[3] BOWMAN, D., KRUIJFF, E., LAVIOLA, J., AND POUPYREV, I. 3D User Interfaces: Theory and Practice. Addison-Wesley, Boston, MA, 2004.
[4] BRAVO, M. J. A global process in motion segregation. Vision Research 38 (1998), 853–864.
[5] CALLAGHAN, T. C. Dimensional interaction of hue and brightness in preattentive field segregation. Perception & Psychophysics 36, 1 (1984), 25–34.
[6] CALLAGHAN, T. C. Interference and domination in texture segregation: Hue, geometric form and line orientation. Perception & Psychophysics 46, 4 (1989), 299–311.
[7] CALLAGHAN, T. C. Interference and dominance in texture segregation. In Visual Search, D. Brogan, Ed. Taylor & Francis, New York, New York, 1990, pp. 81–87.
[8] CAMPBELL, F. W., AND GREEN, D. G. Monocular versus binocular visual acuity. In Nature (1965), pp. 191–192.
[9] CARPENTER, M., AND PROFFITT, D. Comparing viewer and array mental rotations in different planes. Memory & Cognition 29 (2001), 441–448.
[10] CHAPANIS, A., AND SCARPA, L. C. Readability of dials at different distances with constant visual angle. Human Factors 9, 5 (1967), 419–426.
[11] COLIN, W., AND BEATTY, J. C. Using color dimensions to display data dimensions. Hum. Factors 30, 2 (1988), 127–142.
[12] CZERWINSKI, M., DESNEY, S. T.,ANDROBERTSON, G. G. Women take a wider view. In CHI ’02: Proceedings of the SIGCHI conference on Human factors in computing systems (New York, NY, USA, 2002), ACM Press, pp. 195–202.
[13] DESNEY, S. T., GERGLE, D., SCUPELLI, P., AND PAUSCH, R. With similar visual angles, larger displays improve spatial performance. In CHI ’03: Proceedings of the SIGCHI conference on Human factors in computing systems (New York, NY, USA, 2003), ACM Press, pp. 217–224.
[15] HARALICK, R. M., SHANMUGAM, K., ANDDINSTEIN, I. Textural features for image classification. IEEE Transactions on System, Man and Cybernetics SMC-3, 6 (1973), 610–621.
[16] HEALEY, C. G. Choosing effective colours for data visualization. In Proceedings Visu-alization ’96 (San Francisco, California, 1996), pp. 263–270.
[17] HEALEY, C. G. Effective Visualization of Large, Multidimensional Datasets. Ph.D. thesis, The University of British Columbia, Canada, 1996.
[18] HEALEY, C. G. A perceptual colour segmentation algorithm. Tech. Rep. TR-96-09, Department of Computer Science, University of British Columbia, 1996.
[19] HEALEY, C. G. Perceptual colors and textures for scientific visualization, 1998.
[20] HEALEY, C. G. Formalizing artistic techniques and scientific visualization for painted renditions for complex information spaces. In Proceedings International Joint Confer-ence on Artificial IntelligConfer-ence 2001 (Seattle, Washington, 2001), pp. 371–376.
[21] HUBER, D. Simple Motion in Glyph-Based Visualization. M.S. thesis, North Carolina State University, USA, 2004.
[22] KOCHERLAKOTA, S. M. Perception Driven Search Strategies For Effective Multi-Dimensional Visualization. M.S. thesis, North Carolina State University, USA, 2002.
[23] LEVKOWITZ, H., ANDHERMAN, G. T. Color scales for image data. CGA 12, 1 (1992), 72–80.
[24] MATEEFF, S., DIMITROV, G., AND HOHNSBEIN, J. Temporal thresholds and reaction time to changes in velocity of visual motion. Vision Research 35, 3 (1995), 355–363.
[25] MCCORMICK, B. H., DEFANTI, T. A., ANDBROWN, M. D. Visualization in scientific computing. Computer Graphics 21, 6 (1987), 1–14.
[26] Mitsubishi cell phone. http://www.mitsubishi-telecom.com/products_
compare_phones.asp?lan=en, 2005.
[27] Search for mobile phones on epinions.com. http://www.epinions.com/
PDAs--reviews--special_features__list__cellular%_phone, 2005.
[28] Search for pdas on epinions.com. http://www.epinions.com/
PDAs--all-screen_resolution__search_, 2004.
[29] Powerwall 1. http://www.lcse.umn.edu/research/powerwall/ powerwall.html, 1998.
[30] Powerwall 2. http://access.ncsa.uiuc.edu/Briefs/98Briefs/
[31] PYLYSHYN, Z., BURKELL, J., FISHER, B., SEARS, C., SCHMIDT, W., ANDTRICK, L. Multiple parallel access in visual attention. Canadian Journal of Experimental Psychol-ogy (1993).
[32] RAO, A. R., AND LOHSE, G. L. Identifying high level features of texture perception. CVGIPGM 55, 3 (1993), 218–233.
[33] RAO, A. R., AND LOHSE, G. L. Towards a texture naming system: Identifying relevant dimensions of texture. In Proceedings Visualization ’93 (San Jose, California, 1993), pp. 220–227.
[34] Definition of resolution. http://whatis.techtaret.com/definition/0,
,sid9_gci212895,00.html, 2005.
[35] ROGOWITZ, B. E., ANDTREINISH, L. A. How not to lie with visualization, 1995.
[36] SAWANT, A. P. Dynamic Visualization of the Relationship Between Multiple Represen-tations of an Abstract Information Space. M.S. thesis, North Carolina State University, USA, 2003.
[37] SIMMONS, T. What’s the optimum computer display size? Ergonomics in Design 9, 4 (2001), 19–24.
[38] SMITH, P. H., AND VAN ROSENDALE, J. Data and visualization corridors report on the 1998 CVD workshop series (sponsored by DOE and NSF). Tech. Rep. CACR-164, Center for Advanced Computing Research, California Institute of Technology, 1998.
[39] TAMURA, H., MORI, S.,ANDYAMAWAKI, T. Textural features corresponding to visual perception. IEEE Transactions on Systems, Man and Cybernetics SMC-8, 6 (1978), 460– 473.
[40] Definition of texture. http://www.cogsci.princeton.edu/cgi-bin/ webwn?stage=1&word=texture, 2004.
[41] Home theater seating. http://www.cinemasource.com/articles/ seating_guide.pdf, 2005.
[42] TRIESMAN, A. Preattentive processing in vision. CVGIP 31 (1985), 156–177.
[43] TRIESMAN, A., ANDSOUTHER, J. Illusory words: The roles of attention and top-down constraints in conjoining letters to form words. Journal of Experimental Psychology: Human Perception & Performance 14 (1986), 107–141.
[45] Limit to human vision & its effect on optimum digital image resolution. http://www.
blaha.net/Main\%20Visual\%20Acuity.htm, 2005.
[46] Human factors and perception. http://graphics.cs.ucdavis.edu/
˜staadt/ECS289H-WQ02/notes/VR_Human_Fact%ors.pdf, 2005.
[47] WARE, C. Information Visualization: Perception for Design. Morgan Kaufmann Pub-lishers, Inc., San Francisco, California, 2000.
[48] WEIGLE, C., EMIGH, W., LIU, G., TAYLOR, R., ENNS, J. T., AND HEALEY, C. G. Oriented texture slivers: A technique for local value estimation of multiple scalar fields. In Proceedings Graphics Interface 2000 (Montr´eal, Canada, 2000), pp. 163–170.
[49] WOLFE, J. M., AND FRANZEL, S. L. Binocularity and visual search. Perception & Psychophysics 44 (1988), 81–93.
[50] WRAGA, M., CREEM, S. H., AND PROFFITT, D. R. Updating displays after imagined object and viewer rotations. Journal of Experimental Psychology: Learning, Memory and Cognition 26, 1 (2000), 151–168.