ABSTRACT
HAYNES, MATTHEW. Comparison of Methods to Remediate Compacted Soils for Vegetative Establishment. (Under the direction of Richard Mclaughlin).
Vegetation establishment on compacted construction sites is imperative to controlling
erosion and sedimentation. Removal of topsoil and compaction of the subsoil presents
multiple challenges in attempts to establish vegetation: low nutrient soils with little organic
matter, high bulk densities, and low infiltration rates. The goals of this project are to
quantify the impacts of soil compaction remediation methods on infiltration rate, stormwater
runoff volume, and vegetation. Objectives are to measure: (1) maximum steady state
infiltration rate (IR) over time; (2) quantity and quality of storm water runoff; and (3) percent
ground cover, biomass production, and rooting depth of vegetation during early
establishment. We evaluated four treatments on 3 sites: a compacted soil (C), a compacted
soil with core aeration (A), a compacted soil with deep (20-30 cm) tillage (DT), and a
compacted soil with deep tillage and compost (CT), which was implemented using a rear tine
rototiller. Sites 1 and 2 received C, A and DT treatments and Site 3 received only DT and
CT treatments. Plots were 2x1 meter for Site 1 and 0.6x1.2 meter for Site 2 with five
replications of each treatment. Site 3 was also 0.6x1.2 meter but only had 3 replications of
each treatment. At Site 1, runoff was collected in plastic tubs at the bottom of each plot, and
samples were measured for volume and sediment. Infiltration rates were determined using a
Cornell Sprinkle Infiltrometer. At Site 1, the A treatment had a higher erosion rate during
two of four rain events and higher runoff volume during three of four rain events, when
(0-9.3mm), 10 to 60% (1.9-26.2mm), and 0 to 3.5% (0-1.1 mm) of the total rainfall for C, A,
and DT, respectively. There was no difference between C and A plots for vegetative biomass
and infiltration rate, but these were both greater in the DT plots. Tilled plots had an average
IR of 15 cm hr-1, compared to 0.16 and 0.21 cm hr-1 for C and A, respectively. At Site 2, IR
and percent cover were the only 2 parameters measured. There were no significant
differences in IR, due to an abundance of values too low to be read accurately by the
infiltrometer, or percent cover between the three treatments due to poor vegetative
establishment, which was 22, 16, and 23% for the C, A, and DT, respectively. Infiltration
rates at Site 3 were 10X those at Site 2, but there no significant difference in average IR
between CT and DT, which was the only measurement taken between the two treatments.
Adding compost with deep tillage increased IR rates to 1.5X (10.1 cm hr-1) that of deep
tillage alone (6.4 cm hr-1), but with high variation (CV=71%). The results suggest that deep
tillage prior to seeding could minimize runoff, erosion, and surface-water sedimentation and
Comparison of Methods to Remediate Compacted Soils for Vegetative Establishment
by
Matthew A. Haynes
A thesis submitted to the Graduate Faculty of North Carolina State University
in partial fulfillment of the requirements for the Degree of
Master of Science
Soil Science
Raleigh, North Carolina
2010
APPROVED BY:
______________________________ ______________________________ Josh Heitman William Hunt
______________________________ Richard McLaughlin
BIOGRAPHY
Matthew A. Haynes was born and raised in Boiling Springs, North Carolina. He
graduated from Crest High School in 2004 and went on to attend college at NC State. Matt
developed a love for agriculture and the outdoors at a very young age and decided to pursue a
degree in Agronomy at NC State. He graduated with a Bachelor’s Degree in 2008 and then
went on to pursue a Master’s Degree in Soil Science under the direction of Dr. Rich
ACKNOWLEDGMENTS
I would like to thank my committee chair, Rich Mclaughlin, and my committee
members, Josh Heitman and Bill Hunt, for the never-ending guidance you all provided
throughout my time in graduate school. The endless support and help you all gave was
central to my success in research and academics.
A special thank you goes out to Jamie Stansell, Kim Whitley, and Melanie McCaleb
for sticking by me in the heat of the summer and the bitter cold winters when I know you had
other things to do. I truly appreciate all your help and would not have been successful
without everyone’s contributions. I also owe thanks to Joy Smith for the endless hours she
contributed when helping me with statistics and keeping me from going insane when dealing
with so much data. This has been a great experience and one I’ll never forget! Thanks
TABLE OF CONTENTS
LIST OF TABLES ...vi
LIST OF FIGURES ... vii
CHAPTER 1: LITERATURE REVIEW Compaction and Bulk Density ... 1
Infiltration and Surface Runoff ... 3
Vegetation Establishment on Compacted Soils ... 5
Deep Tillage ... 6
Core Aeration ... 7
CHAPTER 2: LAKE WHEELER EXPERIMENTS MATERIALS AND METHODS Site Description ... 9
Plot Setup ... 10
Treatments... 11
Vegetation ... 13
Bulk Density Measurements ... 13
Stormwater Runoff Measurements ... 14
Maximum Steady State Infiltration Measurements ... 15
Above Ground Biomass Determination ... 16
Vegetative Coverage (%) ... 16
Root Density and Depth ... 16
Data Analysis ... 17
RESULTS AND DISCUSSION Bulk Density Site 1 ... 17
Site 2 ... 17
Site 3 ... 18
Maximum Steady State Infiltration Site 1 ... 19
Site 2 ... 21
Site 3 ... 22
Vegetation Establishment Site 1 ... 24
Site 2 ... 26
Rooting Density Site 1 ... 27
Stormwater Runoff Site 1 ... 27
CONCLUSIONS... 31
REFERENCES ... 36
TABLES AND FIGURES ... 40
APPENDICES ... 67
APPENDIX 1: Other particle size, vegetation, and IR figures ... 68
LIST OF TABLES
Table 1. Root density rating system for modified profile wall method of analyzing
roots... 40
Table 2. Average pre-treatment and post-treatment bulk density measurements for Site 1. ... 40
Table 3. Average pre-treatment and post-treatment bulk density measurements for Site 2 ... 41
Table 4. Average pre-treatment and post-treatment bulk density measurements for Site 3 ... 41
Table 5. Average IR’s using the Simulated Rainfall method for Site 1 ... 42
Table 6. Average IR’s using the Cornell Sprinkle Infiltrometer for Site 1... .42
Table 7. Average IR’s using the Cornell Sprinkle Infiltrometer for Site 2 ... 43
Table 8. Average IR’s using the Cornell Sprinkle Infiltrometer for Site 3... 43
Table 9. Average cumulative infiltration prior to runoff at Sites 1 and 2. ... 43
Table 10. Average cumulative infiltration prior to runoff at Site 3.. ... 44
Table 11. Root density ratings for each treatment.. ... 44
LIST OF FIGURES
Figure 1. Diagonal view of the plot layout at Site 1 ... 46
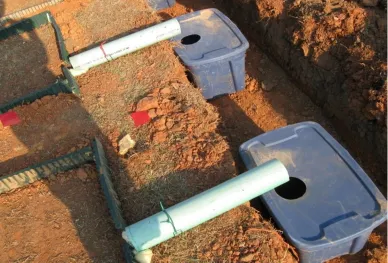
Figure 2. Tubs were placed in the ditch in order to receive stormwater runoff from the plots at Site 1 ... 47
Figure 3. Plastic was placed over each tub to insure that no direct precipitation entered and diluted the sample ... 47
Figure 4. The rain gauge used was located off Lake Wheeler Rd. in Raleigh, N.C. ... 48
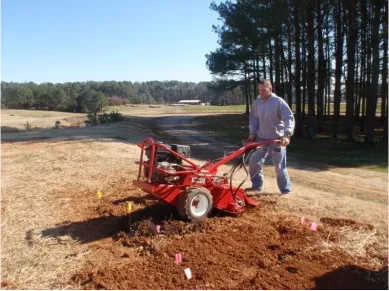
Figure 5. Tillage was done using a rear tine rototiller for all sites ... 49
Figure 6. Plots were aerated with a hollow tine core aerator at Sites 1 and 2 ... 49
Figure 7. A single replication of each treatment is shown immediately following treatment installation at Site 2. The control is on the left, followed by the tilled in the middle, and the aerated on the right ... 50
Figure 8. Mushroom compost blend applied to Site 3 at 2 yds3 ac-1 ... 50
Figure 9. Compost was tilled in to a depth of approximately 8 inches ... 51
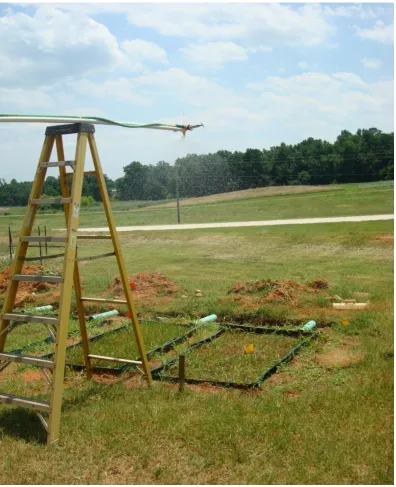
Figure 10. Infiltration using the Simulated Rainfall Method ... 52
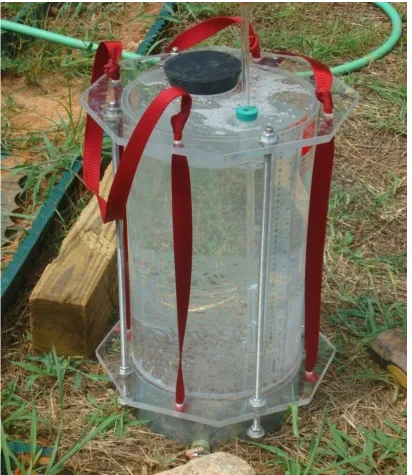
Figure 11. Cornell Sprinkle Infiltrometer ... 53
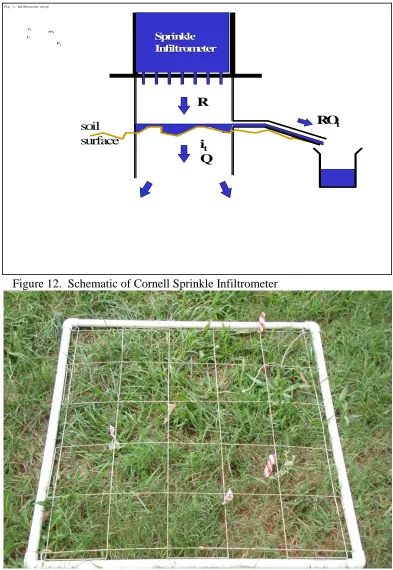
Figure 12. Schematic of Cornell Sprinkler Infiltrometer. As precipitation (R) falls at a steady state, the infiltration capacity of the soil is reached and runoff begins (ROt). Once steady state runoff is achieved, steady state infiltration rate (it) can be calculated ... 54
Figure 14. Pits were dug 3 ft. deep in each plot so that the profile wall was exposed
for root analysis... 55
Figure 15. A 50x50 cm. grid was fastened on to the soil profile wall and the roots were rated in each 5x5 cm square... ... 55
Figure 16. The relationship between bulk density and infiltration rate using the SR method at Site 1 ... 56
Figure 17. The relationship between bulk density and infiltration rate using the CSI method at Site 1 ... …..56
Figure 18. The relationship between bulk density and infiltration rate using the CSI method at Site 1 including a trendline ... 57
Figure 19. The relationship between bulk density and bulk infiltration rate using the CSI method at Site 3 ... 57
Figure 20. The relationship between clay content and infiltration rate using the CSI method at Site 3 ... 58
Figure 21. The relationship between bulk density and infiltration rate at Sites 1 and 3... . 58
Figure 22. The relationship between bulk density and infiltration rate at Sites 1 and 3 including a trendline. ... .59
Figure 23. The percent vegetative coverage at Site 1 ... 59
Figure 24. The vegetative biomass at Site 1 ... 60
Figure 25. The relationship between dry weight and vegetative cover at Site 1. ... 60
Figure 27. The relationship between bulk density and dry weight at Site 1 ... 61
Figure 28. The relationship between percent coverage and infiltration rate using the SR method at Site 1... 62
Figure 29. The relationship between dry weight and infiltration rate using the SR method at Site 1 ... 62
Figure 30. The relationship between percent coverage and infiltration rate using the CSI method at Site 1 ... 63
Figure 31. The relationship between percent coverage and infiltration rate using the CSI method at Site 1 including a trendline ... 63
Figure 32. The relationship between dry weight and infiltration rate using the CSI method at Site 1 ... 64
Figure 33. The percent vegetative coverage at Site 2 ... 64
Figure 34. Root Density data at each 5 cm. increment, down to a depth of 50 cm. ... 65
Figure 35. The hourly intensity of precipitation for Storm 1 (mm) ... 65
Figure 36. The average runoff amounts for each storm event ... 66
Figure 37. The average runoff (%) for each storm event ... 66
Figure 38. The hourly intensity of precipitation for Storm 2 (mm) ... 67
Figure 39. The hourly intensity of precipitation for Storm 3 (mm) ... 67
Figure 40. The hourly intensity of precipitation for Storm 4 (mm) ... 68
CHAPTER 1: LITERATURE REVIEW
Soil compaction increases storm water runoff, which carries sediment and other
harmful pollutants into water bodies. Urban areas may be compacted for structural strength
or inadvertently compacted by heavy machinery during the construction phase (Gregory et
al., 2006). Soil disturbance caused by heavy traffic can affect physical properties resulting in
compaction and increased bulk density (Gregory et al. 2006), causing a decrease in
vegetative stand (Balbuena et al. 2002).
Compaction and bulk density
Wang et al. (2008) showed that runoff increased 72% by wheel compaction on
non-vegetated sites when compared to no-till crop production areas. This compaction can be very
substantial due to the extreme weights of the machinery used during the construction phase.
Botta et al. (2008) showed that as axel load increased, soil compaction increased when using
standard radial tires and cross ply tires on a farm tractor. The two sites were a soil in direct
sewing condition, which consisted of 9 years of direct drilling of winter wheat followed by
soybeans, and a soil in conventional tillage. In treatments with axel weights greater than 40
kN, bulk density values were significantly higher for both soil conditions than in the control,
which received no traffic, down to a depth of 300 mm. Heavy axel loads are also found on
construction equipment, such as backhoes, dump trucks, and pickup trucks. Gregory et al.
(2006) did a study using this equipment and reported weights of 6.3 Mg (7 t) for a backhoe
and axle weights of 24.5 Mg (27 t), and 1.9 Mg (2 t) for a dumptruck and pickup truck,
respectively. They showed that the heavier equipment, such as the dumptruck, increased
truck and backhoe, which had mean bulk densities of 1.61 g cm-3. Although the differences
between the heavier and lighter equipment were not statistical, they were numerically
different. They reported that this could be due to sampling in the upper 10 cm of the soil
rather than below 10 cm, which is where compaction tends to occur.
Randrup et al. (1997) showed that bulk density was consistently higher inside Danish
construction areas than outside which led to root limiting densities as high as 1.9 Mg/m3,
with the controls averaging 1.74 Mg/m3. The controls were found outside the construction
areas in adjacent farmland and were unaffected by the construction traffic. The average
densities of the soils used in Randrup et al.’s (1997) study ranged from 1.55 Mg m-3
to 1.65
Mg/m3. An overestimation of 0.10-0.15 Mg m-3 was believed to be caused by the
measurement technique, which was using a gamma ray density probe. The compaction can
be variable depending on the moisture content at the time of impact. Vorhees et. al (1985)
showed that bulk density varied on three different sites which consisted of a dry Nicollet soil,
a wet Nicollet soil, and a Webster soil. All soil types were loaded by 9 and 18 Mg axel
loads. Water contents were not significantly different in the upper 10 cm but below 30 cm
the dry Nicollet had a water potential of about -1.5 MPa while the wet Nicollet had a
potential of about -0.5 MPa. The Webster soil showed potentials from 0.3–0.5 MPa. The
wet Nicollet and Webster soils showed significant increases in bulk density with the 18 Mg
axel weights to depths of 50-60 cm, while dry Nicollet soil only showed differences up to 30
cm. The dry Nicollet soil showed little difference between the two axel loads but did show
significant bulk density increase up to 15 cm with the 9 Mg axel and up to 30 cm with the 18
30-50 cm depth by about 0.8 Mg/m3 when compacted using 9 and 18 Mg axle loads. When the
same loads were applied to the soil on the dry Nicollet, no significant changes were seen in
bulk density deeper than about 30 cm.
Infiltration and Surface Runoff
Infiltration rates are significantly reduced by compaction due to the destruction of soil
structure, which increases surface runoff. The previously cited study by Gregory et al.
(2006) showed that infiltration rates were decreased 70-99% under even the lowest of
different compaction treatments. Infiltration rates were 861 mm hr-1 in the undisturbed state
but decreased to 175 mm hr-1 post development as a result of vehicular compaction, an 80%
reduction. At another location of the same lot, infiltration rates were decreased from 590 mm
hr-1 to 8 mm hr-1, a 99% reduction. Pitt et al. (1999) also performed a study on 10 different
sites using a series of 153 double ring infiltrometer tests, which showed that mean infiltration
rates decreased in sandy soils from 414.02 mm hr-1 to 63.5 mm hr-1 and in clayey soils from
223.5 to 17.8 mm hr-1 when sites were compacted, which was caused by construction
activity, throughout Alabama. Kays et al. (1979) performed a study using double ring
infiltrometers throughout the piedmont of North Carolina and found that infiltration rates in
the Sudbury Suburban Watershed on excessively disturbed soils were 1 to 5% of neighboring
forested areas and 3 to 15% of low disturbance areas. In the same watershed, studies also
showed that areas that were previously forested had infiltration rates of 35.5% and areas that
were previously cultivated had rates of 15.1% of the undisturbed forested areas. Generally,
while most undisturbed sites were substantially greater than 1cm/hr. Hamilton et al. (1999)
showed that the youngest lawns evaluated had the lowest infiltration rates during a study on
15 residential lawns in central Pennsylvania. These two lawns, which were excavated during
the construction phase, had average infiltration rates of 0.4 and 1.2 cm hr-1. They found that
10 of the 15 lawns had average infiltration rates below 3 cm hr-1. The remaining 5 lawns had
certain properties that could have explained their higher rates, which were measured as high
as 10 cm hr-1. Practices such as minimal excavation during construction, years of core
cultivation, and older lawns generally had the highest infiltration rates.
Runoff volume is affected by infiltration rate. Lower infiltration rates increase the
chance that a site will increase runoff rate and volume. When rainfall events occur, the water
has only 3 fates. It can infiltrate, evapotranspire, or runoff. Fullen (1985) showed that as
infiltration rates decreased, ponding and runoff increased in the ruts caused by tractor tires.
Samples were collected from the pools formed over the crusted ruts and were found to have
sediment concentrations of 4000-6000 mg/L. Once the soil dried out and the sediment
settled, it further impeded infiltration rates. Surface seals can be formed from this process.
Rain drop impact causes the detachment of soil particles and smaller silt size particles can fill
macropores and inhibit infiltration. Once these seals form, the hydraulic conductivity of the
area decreases and surface runoff intensifies (Zhang et al., 1998). Their study showed that
tilled treatments under higher rainfall amounts and intensities tended to form seals and
produce runoff; whereas, under lower precipitation amounts and intensities the runoff
Vegetation establishment on Compacted Soils
Vegetation establishment can also be affected on soils where the structure is
destroyed via compaction. As mentioned previously, heavy machinery may cause
impermeable layers to form in the soil which decreases infiltration and percolation, inhibiting
root growth due to the anaerobic condition in the soil which this may create (Kozlowski,
1999). Not only does compaction inhibit root growth due to lack of water and oxygen, it also
physically inhibits growth by destroying ground vegetation and causing dense layers that
roots cannot penetrate or regenerate in (Balbuena et al. 2002). Chen et al. (2005) showed
that no-tillage and conventional tillage treatments caused canola roots to concentrate above
the compacted pan layer in their soils, which was found to be around 175 mm deep. Tillage
to a depth of 257 mm allowed roots to penetrate much deeper in the profile due to loosened
soil aggregates. The deep tillage treatment allowed roots to penetrate approximately 7%
deeper than the no-till and conventional tillage treatments.
Plant height and yield are also affected by compaction. Abu-Hamdeh (2003) showed
that as compaction increased corn height and yield decreased. Their plots were compacted
using 8- and 19-Mg axel loads and compared to a control, which received no treatment. The
final plant heights of the two compaction treatments were 6% and 10% lower for the 8- and
19-Mg treatments, respectively, when compared to the control. Over a 2-year period, the
8-Mg treatment reduced average corn yield by 13% and the 19-8-Mg treatment reduced yields by
20%. They also found a higher concentration of roots around the base of the plants for both
compaction treatments; whereas, for the control they were found in both shallow and deeper
correlation between thatch density and infiltration rates on residential lawns but that proper
inputs to minimize compaction during the construction phase may result in better plant
growth, which could also help maintain infiltration rates.
Deep Tillage
Deep tillage, or subsoiling, is an accepted and effective method used to alleviate soil
compaction in agricultural settings. Traffic pans, which are extremely dense layers, form in
the subsoil and by breaking up these hardpans, deep tillage allows roots to penetrate deeper
for water and nutrients (Varsa et al. 1997). Busscher et al. (2000) showed that soybean yield
increased significantly under deep tilled treatments when compared to non deep tilled
treatments on a Goldsboro loamy sand with a plow layer. Compaction was measured with a
cone penetrometer. The readings were the lowest for the soils that were deep tilled that
season when compared to those that were not deep tilled and those that were deep tilled in
the previous season. Wheat and soybean yields were both reduced substantially for every
megapascal increase in cone index by up to 1.75 Mg ha-1 and 1.81 Mg ha-1, respectively.
Deep tillage can positively influence high root densities around the base of the plant by
loosening the soil media so that the roots are able to penetrate deeper in to the soil. Varsa et
al. (1997) showed that corn root density as well as depth was greater in deep tilled treatments
than in reduced and no-till treatments and corn grain yield was also greatest in the deep tilled
treatment. They found that 35% of the roots were below 60 cm in the deep tilled plots when
compared to the control where only 5% was found below 60 cm. The increase in rooting
depth of the deep tilled plots was due to a decrease in bulk density caused by the tillage.
2.6% for 8- and19-Mg compaction loads, respectively. They also found that subsoiling,
reduced densities to close to what they were in their original conditions. Deep tillage also
has a large impact on infiltration rates. Jones et al. (1994) compared the infiltration rates for
a no-till system and stubble mulch tillage system. The treatments had similar infiltration
rates in the beginning but the infiltration rates declined much more rapidly in no till. Over a
2-hour period the infiltration rate of the tilled treatment was 90% greater than the no-till
system during fallow after sorghum. It was measured again during fallow after wheat and the
tilled treatment had a 26% greater infiltration rate. Surface runoff was also highest in the
no-till treatment with values exceeding the no-tilled treatment by as much as 81%.
Core Aeration
Aeration is also a common tool used to help establish vegetation on bare sites by
homeowners as well as the commercial industry. Hollow tine and solid tine aeration are
common practices found on golf courses and home lawns (Baldwin et al., 2006). Hollow tine
aeration involves pulling a core out of the soil to make soil conditions more conducive for
increased infiltration. Solid tine corers do not remove soil but produce a void. Tine size also
plays an important role on the effectiveness of compaction relief. Baldwin et al. (2006)
showed that the smaller diameter (1/4 inch) hollow tine produced a 34% higher infiltration
rate than the larger (1/2 inch) diameter tine due to a decrease in pan formation when using
the smaller diameter. Penetrometer studies by Shah et al. (2004) showed that aeration likely
reduced impedence in their soil by alleviating some of the compaction. By decreasing
impedence you allow roots easier access to water and nutrients. Murphy et al. (1993) found
tine aeration, when compared to compacted controls. When using hollow tine aeration, the
values for porosity were 19% and 21% higher than when compared to solid tine aeration.
In contrast, many studies show adverse effects of aerification. Brauen et al. (1998)
showed that initially bulk density was not affected using aeration but as the number of annual
aerifications increased, bulk density increased in both hollow and solid tine aerification.
There was no difference in runoff from the aerated vs. non-aerated sites but TSS
concentrations were up to 30% higher on the aerated sites due to surface disturbance. This
causes more nutrients, such as P to runoff with the sediment. On construction sites it is likely
that aerification is only done once but subsequent applications by homeowners could cause a
decrease in vegetative stands. Franklin et al. (2007) also showed that in one of the fields
where aeration was applied, total P concentration was higher in the runoff. This was due to
rainfall impact after aeration that caused more soil particles carrying P to leave the site.
Nitrogen uptake can also be influenced by aeration, as shown in a study by Shah et al.
(2004). Though unexpected, they measured higher N uptake in a control site when compared
to aerated and aerated with liquid dairy manure. There was no significant difference in the
control vs. manure with no aeration which suggests that the aeration decreased N uptake,
which could adversely affect crop growth.
The effects of aeration and deep tillage on grass establishment and surface runoff
have clearly not been well established. Vegetation establishment on compacted construction
sites can be very difficult due to excessive bulk densities as well as decreased porosity and
substantial increases in storm water runoff that is available to leave the site. Best
management practices should be developed in order to counterbalance this phenomenon.
The purpose of this study was to determine best management practices for post
construction urban areas. Objectives were to determine if hollow tine aeration and deep
tillage were methods that could be used to (1) alleviate soil compaction, (2) improve and
maintain infiltration rates, (3) improve grass establishment, and (4) decrease stormwater
runoff and erosion.
CHAPTER 2: LAKE WHEELER EXPERIMENTS Materials and Methods
Site Description
The study was located at the North Carolina State University Lake Wheeler Field
Laboratory in Raleigh, N.C. Site 1 is located at the top of a fill slope made up of subsoil
materials from an unknown site in Wake County. Approximately 18 m uphill is a native
wooded area which was used to represent pristine site conditions for soil physical properties.
The site was selected because it was an area with regular vehicular traffic which was
expected to have some level of compaction. The area has a relatively uniform 3% slope.
Site 2 was approximately 6 m from an excavation just approximately 100 m uphill
from Site 1 and consisted of fill material from the excavation.
Site 3 was located directly adjacent to Site 2 and exhibited similar characteristics.
All three areas were chosen due to the presence of subsoil material at the surface similar to
was conducted, consisting of a mixture of Bermuda grass (Cynodondactylon), Large Crabgrass (Digitaria sanguinalis), and other weeds.
Plot Setup (All Sites)
Preliminary bulk density samples described below were taken over each site area in
order to determine the most uniform and compacted areas for plot location. Once the area
was chosen, the plots were further compacted using a pickup truck with a gross weight of
3084 kg (6800 lbs) (www.motortrend.com) and a gross pressure of approximately 1689 kPa (245 psi). Flags were placed eight inches apart, which was approximately the tire width of
the pickup, and the truck was driven back and forth, repeatedly, until the entire area of each
plot had at least 10 passes. Remaining vegetation that was not killed during the compaction
treatment was killed using a glyphosate herbicide application in order to have a bare soil
surface similar to a construction site. Just prior to plot installation, the dead vegetation was
removed by running a string trimmer back and forth across the area.
Site 1
Once the area was selected based on the bulk density sampling, individual plots were
flagged 2 m in length up and down the slope and 1 m wide. Fifteen plots were installed
adjacent to each other with 0.15 m between them to allow for access without impacting the
plots (Figure 1). To isolate each plot from outside runoff, plastic garden edging (10 cm high)
was installed on all sides by driving the siding 3-5 cm into the soil. At the lower border, a
gap was left into which a 10 cm pipe was installed. Gaps between the pipe and the edging, as
well as between edging pieces, were filled using expandable foam (Great Stuff, DOW
through the pipe and into a 68 L plastic tub in an excavated ditch downhill of the plots
(Figure 2). Assuming 100% runoff, the tub size allowed us to capture all runoff from a
0.5-year 24-hour storm in Raleigh N.C., which is 36.6 mm (NOAA Atlas 14).
A piece of plastic was draped over the pipe and the tub to insure that only runoff
from each plot was entering the tubs and not precipitation (Figure 3). Water which
accumulated in the ditch from adjacent areas was removed using a sump pump with a float
switch.
Precipitation data was collected at the NC Climate Office rain gauge located off Lake
Wheeler Rd (Figure 4). We obtained rainfall amount and intensity from the Climate Office
database. The 15 plots were divided into 5 blocks of 3 plots and the treatments were
assigned randomly within each block.
Sites 2 and 3
Plots were constructed to be 0.6 x 1.2 m, with colored flagging along the borders of
each with each flag depicting a different treatment. Plastic borders were not used on these
sites because only infiltration rate and vegetative measurements were taken.
Treatments (Sites 1 and 2)
Three treatments were used: deep tillage (DT), core aeration (A), and a control (C),
which received no treatment. There were 5 replications for each of the three treatments.
Each plot was also wetted with a hose for 1 min and allowed to dry 1 minute prior to DT or
A. This procedure was repeated twice in order to moisten the surface soil, which was very
The DT plots were implemented using a rear tine tiller (Troy-Bilt, Cleveland, OH)
and plots were tilled to depths ranging from 25-30 cm (10-12 in; Figure 5). Due to the
hardness of the surface crust a backhoe was used to loosen the soil in order to allow the tiller
to penetrate the soil at Site 1. Once the plots were tilled, the depths of the tilled zones were
measured by inserting a piece of rebar until the untilled soil was reached.
The A plots were plugged using a hollow tine aerator (Ryan, Johnson Creek, WI).
Each of the A plots received ten passes until the plots were thoroughly treated (Figure 6).
The average depth of 5 plugs in each plot was measured and averaged to estimate penetration
depth, which was approximately 1.5 – 2 cm. The C plots received no treatments after
compaction, but were watered prior to installation to insure that all plots were installed under
similar moisture conditions (Figure 7).
Site 3
Two treatments were used: deep tillage (DT) and deep tillage with a compost
amendment (CT). There were 3 replications of each treatment randomly assigned to plots.
Tillage was performed using the same equipment as the previous sites and again, a depth of
approximately 25 cm (10 in) was reached. No backhoe was used to break up the soil on this
site because the soil moisture condition allowed the surface to be broken up using the
rototiller. The compost that was used was a mushroom blend (Old Castle Lawn & Garden
Inc, Atlanta, GA), and it was applied at a recommended 0.02 m3 1000m-2 (2 yd3 1000 ft-2)
(Carolina Lawns, 11; Figure 8). The compost was applied prior to tillage and tilled in to the
Vegetation (All Sites)
Each plot received recommended fertilizer, lime, and seed mixes (NCDOT).
Fertilizer (10-20-20) was applied at a rate of 560 kg ha-1 (500 lbs ac1-) and pulverized
dolomitic limestone at a rate of 3364 kg ha-1 (3000 lbs ac1-). Fertilizer and lime were both
applied after the DT and A treatments. They were raked into the DT plots on Sites 1 and 2
but were surface applied to the C and A plots to avoid disturbance. The fertilizer and lime
were tilled in Site 3. Grass seed mix included tall fescue, centipede, and Bermuda grass
(hulled) and was applied at 56, 11, and 28 kg ha-1 (50, 10, and 25 lbs ac1-),respectively for
Site 1, which was planted on April 27, 2009. Sites 2 and 3 had the same grass seed mix with
the only difference being Bermuda grass was added at 35 lbs ac1- due to fall and winter
planting. Site 2 was planted on October 22, 2009 and Site 3 on January 26, 2010. Tall
fescue seed viability was checked prior to planting Site 2 (Tetrazolium Testing Handbook,
1970) because it was purchased prior to planting Site 1 and all other seed was purchased
new. All seed was applied directly after fertilizer and lime application. Once seeded, straw
was applied at 3705 kg ha-1 (1.5 tons ac-1) and fastened down using netting to avoid seed
loss due to raindrop impact as well as to keep the straw in place. After all inputs were added
each plot was wetted for 45 seconds using a hose to insure that each treatment had similar
moisture conditions at the beginning of the experiment.
Bulk Density Measurements (All Sites)
Bulk density was measured using an AMS 6.4 cm (2 ½ in) diameter soil core sampler
(AMS, American Falls, ID). Samples were taken from the top 2.5-12.5 cm of the profile
order to isolate an area for both sites. Measurements were then taken directly before each
treatment application. For Site 1, bulk density measurements were taken again at 7 weeks,
Site 2 densities were taken at 11 weeks, and Site 3 were taken at 3 weeks after treatment
application. This was done in order to see the treatment effects on the pretreatment bulk
densities. A single core was taken from each plot and brought back to the lab and dried at
103-105°C and analyzed for bulk density. Particle size analysis was also done on each of
bulk density samples using the hydrometer method (Gee and Bauder, 1986).
Stormwater Runoff Measurements (Site 1 Only)
After each rain event, polyacrylamide (PAM) was added to the samples in order to
settle the suspended sediment. The PAM was applied as a concentrated solution of 1 g/liter
to bring the concentration in the runoff to 2-3 mg L-1. Depending on the size of the sample,
this was done either in the lab or in the field. The supernatant was decanted from the
container and the volume was measured. The sediment remaining was oven dried at
103-105°C for 24 hours and weighed. Some samples did not fully settle after flocculation, and
these were subsampled and analyzed for Total Suspended Solids (TSS) by filtration (Clesceri
et al., 1998). The TSS values were converted to sediment loss and added to the amount of
sediment settled using PAM to find the total sediment loss from each plot.
Total stormwater runoff was determined by collecting and measuring all runoff in the
tubs after each storm event. Rainfall values were obtained from the NC Climate Office for
the Lake Wheeler Road Field Laboratory weather station
Maximum Steady State Infiltration Measurements (All Sites)
Infiltration rates (IR) were determined using both simulated rainfall and the Cornell
Sprinkler Infiltrometer (Cornell University, Ithaca, NY) at Site 1. The Cornell method was
the only one used on Sites 2 and 3. The simulated rainfall method was performed by
suspending a single Fulljet 1/2HH-SS50WSQ nozzle 3 meters above 2 adjacent plots
simultaneously, and spraying at a pressure of 42 kPa to provide approximately 100 mm h-1
rainfall as shown by Volf et al. (2007). We were able to measure two plots at a time due to
the circumference of the spray pattern (Figure 10). Before simulated rainfall began on each
plot, the nozzle was calibrated by placing 5 tin cups, which were approximately 300 cm3, in
each plot and raining on each of them for 5 minutes. The water in each tin was then
measured and averaged to get the rainfall rate. Once calibration was complete, the simulator
was run for at least 45 minutes until steady state runoff was achieved. Runoff was collected
every 3 min for 20 sec intervals, which was based on the amount of runoff generated, using a
graduated cylinder at the point of discharge from the PVC pipes.
The Cornell Sprinkler Infiltrometer (CSI) was also used as an alternative method to
measure IR’s on Site 1 and was the only method used on Sites 2 and 3 (Figures 11-12). The
device was calibrated to provide a 250 – 300 mm hr-1 rainfall (van Es et al. 2003). This
device is similar to the one shown by Ogden et al. (1997). The infiltrometer was filled with
water and allowed to run at a constant rainfall rate until the runoff rate attained steady state.
The infiltration rate was calculated from the difference between the water volume used
it = r – rot It = Infiltration rate (cm min-1)
r = rainfall rate = [H1-H2] / Tf (cm min-1) where H1 is the height of water in the infiltrometer at t=0, H2 is the height of water at the end of the
measurement period, and Tf is the time at which the water level at H2 is read.
rot = runoff rate = Vt / (457.30*t) where 457.30 is the area of the ring (cm min-1), Vt is the runoff volume measured in the cylinder, and t is the time interval for which water was collected.
Above Ground Biomass Determination (Sites 1 and 2)
Above ground biomass was measured by randomly selecting three 20 x 20 cm
squares in each plot and removing all vegetation in each of the squares using scissors. The
squares were found in a grid that was placed over each plot (Figure 13). The vegetation from
each square was combined, oven dried at 103-105°C for 24 hrs, and weighed.
Vegetative Coverage – All Sites
Visual estimations of percent coverage were made independently by four people to
determine the vegetative coverage of each plot. The estimates from each person were
averaged for each plot.
Root Density and Depth (Site 1 Only)
For measuring root density and depth, a modified profile wall method (Bohm, pg. 48)
was used. Pits were dug in each plot down to a depth of approximately 1 m using a backhoe
(Figure 14). A pressure washer was used to wash the face of the pit to remove loose soil and
expose the roots. A 50x50 cm grid, which consisted of 100 5x5 cm squares, was placed level
with the soil surface and fastened to the profile wall using ground staples and the top of the
grid (Figure 15). The number of roots in each of the 50 squares was counted and averaged at
categories using a rating system (Table 1). The rating system was chosen due to the fibrous
rooting system of the vegetation planted and this method allowed us to be more consistent in
counting the roots. Once the average rooting density for each replication was calculated,
they were combined for the rooting density at each depth for the three treatments.
Data Analysis
SAS Software was used to perform all statistical analyses (SAS version 9.1, SAS
Institute, Cary, NC). Analysis of Variance (ANOVA) was performed on all infiltration and
vegetation data to analyze main effects and Tukey’s Least Significant Difference (LSD) was
used to separate treatments. For stormwater runoff/sediment data, a linear mixed model was
fitted for each response, with storm, treatment and their interaction considered as fixed
effects, and rep, rep*treatment considered as random effects. The Kenward-Roger
approximation was used in the calculation of denominator degrees of freedom for the fixed
effects and estimation of the standard error of the least squares means. Tukey’s Least
Significant Difference (LSD) was used for means separation. Error rates were controlled at
α=0.05.
Results and Discussion Bulk Density
Site 1
Prior to treatments, the average bulk density in the compacted area was 1.6 g cm-3 and
there were no significant differences in bulk density along the entire designated area
bulk density taken at 7 weeks after treatment was unchanged in the C and A plots but
significantly reduced in the DT treatment (Table 2).
Site 2
There were no differences in bulk densities in the C and DT plots prior to treatment,
but the A plots started out with an average bulk density of 1.7 g cm-3, which was significantly
higher than the other two treatments (Table 3). After 11 weeks, the DT plots had a
significantly lower average bulk density than it did pre-treatment, with the averages
decreasing from 1.6 to 1.4 g cm-3 (p=0.001). The C and A treatments showed no differences
in bulk density from their pre-treatment values.
Site 3
The average pre-treatment bulk densities of Site 3 were similar for the
composted+tilled (CT) plots and the tilled only (DT) plots (Table 4). Five weeks after
treatment installation, the bulk densities of both treatments were lower than their
pretreatment values and were measured at 1.3 g cm-3. However these differences were not
statistical due to variability. The CT plots were also not significantly different from the DT
plots after 5 weeks. The decreased bulk densities of the DT plots in all three sites is
consistent with a study by Materechera (2009). He showed that a vegetable field which
received deep tillage twice a year had significantly lower densities than neighboring sites that
received either no tillage or tillage followed by a disc harrow at the soil surface. These
measurements were taken approximately 11 years after field establishment. He stated that
these results could have been from the loosening of soil particles through tillage, which is
were lower on a clayey soil in three conventional tillage systems when compared to no-till
and reduced till systems in the 0-15 cm layer. At a depth of 15-30 cm, no-till and reduced
tillage systems had similar bulk densities but they remained higher than the conventional
tillage treatments.
Maximum Steady State Infiltration Site 1
Under simulated rainfall (SR), the average infiltration rates (IR) for the C, A, and DT
treatments were 2.70, 2.22, and 5.67 cm hr-1, respectively (Table 5). There were no
differences in average IR between the C and A treatments but the DT treatment was
significantly higher (p=0.02). The rainfall simulator produced similar amounts of
precipitation in each treatment and differences were not significant (p=0.69).
The Cornell Sprinkler Infiltrometer (CSI) produced simulated rainfall rates more than
2X the SR (Table 6), which will be discussed later in this section. Similar to the SR, there
were no differences in IR between the C and A plots, averaging 0.16 and 0.21 cm hr-1,
respectively. Infiltration was two orders of magnitude higher in the DT plots (14.4 cm hr-1;
p=0.002). This is similar to the results of Freese et al. (1993) who found that the loosening
effect of tillage in a non-trafficked area improved infiltration relative to a more compact
no-till treatment immediately after no-tillage with a chisel plow. The no-tillage increased the IR by 0.5
cm hr-1, improving it from 4.5 to 5 cm hr-1. However, they found no differences in
measurements in the non-trafficked area after 30 min so this suggested that surface sealing
The average IR for the CSI was much lower for C and A treatments and higher for the
DT treatment compared to the SR method. Raindrop impact is more intense under the SR
method, where the precipitation is falling from 3 m, compared to the CSI method, with a 5 cm
drop. The higher impact can dislodge soil particles and cause them to re-deposit to form
surface crusts. These surface seals can substantially lower IR because of their low hydraulic
conductivities (Zhang et al. 1998). Since the vegetation was not fully established during the
SR testing, which was measured after 8 weeks, the surface seals could explain the lower IR in
the DT plots. The CSI method was conducted 2 weeks later so vegetative cover may have
slightly improved.
The C and A plots had lower IR by the CSI method compared to the SR method.
This could be due to an uneven distribution of rainfall throughout the sampling period when
using the SR method. As previously mentioned, the nozzle was calibrated prior to
measurement but it was not measured throughout the time it took to reach steady state runoff.
If the rainfall rate varied throughout the collection period this could have caused an
underestimation of rainfall which would have led to lower infiltration rates. A decrease in
rainfall rate could have been caused by wind or even varying pressure coming from the hose.
The runoff samples were collected in 1 L graduated cylinders measuring the samples in 10 mL
increments. For values that fell in between the 10 mL markings, the readings were estimated
to the nearest 5 mL, which also introduces uncertainty into the measurement.
Another possibility for the lower IR for the C and A treatments could be that lateral
movement of water increased the IR using the SR method. The CSI method includes a barrier
flow down to approximately 2.5 cm, which is the depth of the plot edging. This creates a
larger volume for soil water to percolate throughout the profile. The DT plots had lower IR
by the SR method. Again, this could be attributed to the rainfall impact dislodging the freshly
tilled soil particles and causing them to seal the soil surface.
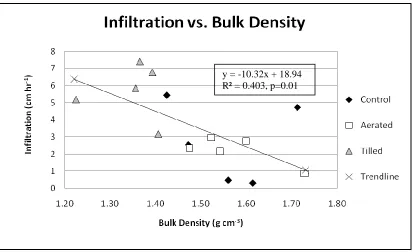
The correlation between bulk density and IR using the SR method was significant
(Figure 16). There was also a trend found using the CSI method even though IR in the control
and aerated plots were extremely low (Figures 17-18). In general, IR decreased as BD
increased. One reason for this is that soils with lower bulk densities have greater pore space,
which permits rapid infiltration (Brady and Weil, pg. 112).
The DT treatment resulted in the lowest bulk densities and the highest IR’s using both
infiltration methods. The A treatment did not result in any measureable change in bulk
density or IR relative to the control. For this particular site, soils with bulk densities above
approximately 1.4 g cm-3 had greatly reduced IR.
There were no significant correlations between clay content and IR using either of
the two methods (Appendices 1-b-1-c). Particle sizes varied substantially from the first to
the last plot, ranging from clay loam to sandy loam, although no correlations could be made
between any of the measured variables with sand or clay content.
Site 2
At Site 2, IR was measured only by CSI. There were no significant differences in IR
for any of the treatments at Site 2 (p=0.56, Table 7). Infiltration was too low to be read by
the infiltrometer on 10 of the 15 plots. Compared to Site 1, IR was lower for the C and A
than 3X the C and A plots but the variability was too high to detect any significant
differences (CV=257%).
The lower IR at Site 2 relative to Site 1 may have been the result of poor vegetative
establishment and poor root growth, which might have allowed the soil to settle more than at
Site 1. The sparse vegetation also left the soil more exposed than at Site 1, leaving it more
susceptible to raindrop impact and surface crusting. Site 2 received precipitation 6 out of 10
days after treatment, with the largest being a 12.7 mm storm with a peak intensity of 5 mm
hr-1, on the 10th day. These rain events could have moved seed around and caused
impermeable surface layers that may have inhibited germination and root penetration. Site 2
IR measurements were taken 7 weeks (early December) after installation to allow the
vegetation to become established, but unusually cold temperatures during the period
prevented significant plant growth. During this period, there were a total of 23 storms with
210 mm of precipitation, and with the plots essentially bare considerable raindrop impact and
crusting could have occurred.
The average clay content of all plots was 26% for Site 1 and 38% for Site 2,
suggesting that if surface crusting occurred, the latter would have more fine clay particles to
clog the soil pores and impede IR (Appendices 1-d, 1-e, and 1-f).
Particle sizes ranged from clay loam to clay across the plots at Site 2. As expected,
there were no significant relationships between IR and either bulk density (Appendix 1-g) or
clay content (Appendix 1-h) due to the majority of the plots having no measureable
Site 3
At Site 3, IR was measured only by CSI. There were no significant differences in
IR’s for either of the two treatments for Site 3 (p=0.52, Table 8). Numerically, the
composted + tilled (CT) treatment resulted in an IR 1.5X that of the DT treatment, but no
differences were found due to high variation (CV=71%).
This numerical difference in IR could be attributed to higher surface roughness
generated by the incorporation of compost, which delays runoff (Govers et al. 2000).
Measurements were only taken directly after compost was applied so the long term effects
are unknown for this study at this time. The rainfall rate on Site 3 was set to 2X the rate of
Site 2 due to the longer time it was taking for runoff to occur, yet IR’s were substantially
higher on Site 3. The main difference between the two sites was that IR’s were taken directly
after treatment application on Site 3 to prevent surface crusting caused by raindrop impact,
while measurement on Site 2 were taken 7 weeks after treatment to allow vegetation
establishment. IR was correlated with bulk density and clay content and there were trends
present with both comparisons (Figures 19-20).
As bulk density decreased, IR rate increased under CT and DT treatments (Figure
19), which was similar to the relationship at Site 1. Bulk density seems to be the key
characteristic at Sites 1 and 3 that controlled IR (Figure 21-22). Clay content also seemed to
increase with IR for both treatments at Site 3 so this rules out the possibility of soil texture
being the limiting factor for its lower IR, when compared to Site 1 (Figure 20). The clay
There were no differences in cumulative infiltration rates using the CSI method prior
to runoff for any of the treatments at any Site (Tables 9 and 10). Numerically, the DT plots
infiltrated approximately 3X that of the C and A treatments at Site 1 but the differences were
not statistical. At Site 2, runoff began within the first minute on every treatment, which
meant that the cumulative infiltration prior to runoff was much less than could be accurately
measured using the infiltrometer. At Site 3, there were also no differences but both CT and
DT treatments had high cumulative infiltration amounts, which were 6.6 and 4.7 cm,
respectively (Table 10). This indicates that these treatments could infiltrate large amounts of
water before runoff even though the steady state IR may be low at times.
Vegetative Establishment
Dry Weight and Percent Coverage – Site 1
The vegetative cover of the C, A, and DT treatments were 65, 62, and 85%,
respectively (Figure 23). There were no significant differences (p=0.06) although DT was
much higher numerically than the other treatments. A similar trend was found for biomass
but the differences were significant (Figure 24; p=0.002).
These data suggest that tillage improves vegetative biomass and percent coverage.
Chen et al. (2005) showed that subsoiling at 264 mm, which is the depth of tillage in this
study, improved crop emergence and had a much higher plant population and crop yield
when compared to a conventionally tilled (88 mm) and a no-tilled system. They also stated
that this could be due to the subsoiled plots having a better ability to retain water in the dry
There does seem to be some correlation between the two measurement techniques, as
expected (Figure 25). The positive relationship between cover estimates and above ground
biomass suggests that the ocular estimates closely followed the actual amount of vegetation
present on the plots. Both cover estimates (data not shown) and above ground biomass were
also correlated with bulk density (Figures 26 and 27). There was no correlation between
cover estimates and clay content for this site (Appendix 1-j).
As bulk density increased, vegetative biomass had a decreasing trend using both
ocular and above ground biomass measurement techniques. Similarly, Balbuena et al. (2002)
found a 58% yield reduction of grassland production on high intensity trafficked soils, where
10 passes with a tractor increased bulk density by greater than 50% compared to a
non-trafficked area. Compaction level was strongly related to traffic intensity in Balbuena et al.’s
study.
The correlation between SR-IR and both vegetative cover and biomass was not
particularly strong but it was significant, with a trend of both measurements increasing
together (Figures 28-29). This relationship is also evident when using the CSI method
(Figures 30,31, and 32) even though there were an abundance of zeros. These data suggest
that IR and vegetative establishment are improved when you have higher porosity and lower
bulk density, which are both achieved through deep tillage. Environmental conditions were
better for grass establishment when we established Site 1 due to warm weather, which may
have been at least partly responsible for maintaining the reduced BD and higher IR, caused
allowed for better moisture availability, aeration, and drainage, enhancing grass growth and
establishment.
Site 2
Seed Viability
A TZ test was performed on the tall fescue because it was purchased at the time of
planting for Site 1, whereas the bermuda and centipede grass were purchased prior to
planting Site 2. It was found that 42 of 50 seeds (84%) were living at the time Site 2 was
planted, which indicated good seed viability.
Vegetative cover was the only vegetative measurement taken on Site 2. There were
no differences in cover estimates between the treatments but the mean values were much
lower than at Site 1 (Figure 33). This could be due to a number of factors including cooler
weather, soil texture, bulk density, IR, and surface crusting.
The correlation between vegetative cover and clay content were not evident for either
site (Appendices 1-j-1-k). This indicates that texture was not the driving variable controlling
vegetative growth. Also, neither BD nor IR were correlated with vegetative cover at Site 2
(Appendices 1-l-1-m).
These data have shown that particle size, bulk density, and IR’s do not seem to be
controlling vegetative establishment on Site 2. Surface crusting by rainfall impact could
have played a key role during this study. The plots did receive rainfall 6 of 10 days after
treatment application. As mentioned in the section above, straw was added to each of the
Rooting Density Site 1Only
There were no differences in rooting density among the three treatments in the upper
15 cm of the soil profile (Table 11). The rooting systems of the C and A treatments were
very dense and had numerous short roots; whereas, the DT treatments had longer roots that
extended deeper through the profile. This could be due to the tillage loosening up the upper
part of the soil matrix which made it easier for roots to extend throughout the profile. Below
15 cm the DT plots had higher average root densities than the C and A; the latter two which
again showed no differences (Figure 34). These differences were down to a depth of 50 cm,
with each 5 cm increment at p<0.02. These results are consistent with a study done by
Erbach et al. (1992). They showed that different tillage tools, which consisted of chisel,
moldboard, and paraplow systems, all reduced soil bulk density and penetration resistance to
the depth of tillage when compared to a no-till system. Due to the high levels of compaction,
we were only able to aerate to approximately a 1 inch depth, which could explain the poor
results for root penetration in this study.
Sediment Loss
For Storm 1, sediment loss was 6.0, 35.2, and 8.5 kg ha-1 for the C, A, and DT
treatments, respectively (Figure 41). The A treatment resulted in numerically higher amounts
of sediment than the C and DT treatments, but these differences were no significant due to
variation. This is consistent with the higher stormwater runoff on the A plots (Figure 34).
There was a larger volume of water leaving the aerated plots carrying sediment. The C and
runoff volume was low for the DT treatment, the loosening of the soil surface apparently
resulted in high sediment concentrations in the runoff. These results are consistent with
Zhou et al. (2009) who showed that erosion and sediment yields could be reduced by 90% in
no-till and strip till systems when compared to a chisel plow system.
For Storm 2, sediment loss was 14.0, 130.6, and 0 kg ha-1 for the C, A, and DT plots
respectively (Figure 41). The A plots lost the highest amount of sediment of the three
treatments (p<0.0001) but there were no differences in the C and DT plots due to high
variability. The spike in sediment loss for the A treatment is due to the high peak intensity of
storm 2. Numerically, there was higher sediment loss in the C plots than in the DT plots
because the DT plots produced no runoff during this event.
Sediment loss was 8.7, 15.4, and 0.9 kg ha-1 for the C, A, and DT plots, respectively,
for storm 3 (Figure 41). There were no differences between any of the treatments for this
storm event, but A treatment sediment losses were much lower when compared to the first
two events. For Storm 4, sediment loss was 15.2, 13.5, and 3.4 kg ha-1 for the C, A, and DT
plots, respectively (Figure 41), and there were no significant differences between any of the
treatments.
The higher sediment losses on the A treatments could be attributed to the surface
disturbance caused by the aeration. The higher runoff amount suggests that the aerator
disturbed the surface but also compacted it while pulling out small cores of soil. This
combination resulted in more erosion and would actually worsen the surface condition
Conclusions
Tillage significantly reduced bulk density on all sites.
Aeration had no affect on bulk density on any site.
Tillage increased IR on Site 1, using both measurement techniques (SR and CSI), but
had no affect on Sites 2 and 3 when compared to the control, using only the CSI
method. Average IR were approximately 50% higher at Site 3 for the CT, however,
variation among plots resulted in no statistical differences.
Infiltration rate decreased as bulk density increased at Sites 1 and 3. This relationship
was not present at Site 2, but 10 of 15 plots had IR so low the infiltrometer could not
measure it.
Poor vegetative growth and surface sealing could have played a large role at Site 2,
which would help explain the low IR.
Aeration had no effect on IR on any site.
Tillage significantly increased vegetative cover at Site 1 but not at Site 2. This
measurement was not taken on Site 3.
Above ground biomass was also significantly increased by tillage at Site 1, which is
There were no differences in rooting density in the upper 15 cm of the soil profile
between any treatments at Site 1, the only location where this was measured.
Tillage significantly increased rooting density below 15 cm at Site 1.
Shallow (2-3 cm) aeration did not improve rooting density at any depth.
It could be that good vegetation establishment was responsible for the high IR at Site
1, which was increased by implementing tillage.
There were no differences in vegetative measurements at Site 2 for any treatment.
Aeration increased stormwater runoff during 2 of 4 storm events. Although there
were no changes in bulk density, it is possible that aerating the plots caused further
compaction which would help explain the higher runoff.
Tillage had no affect on stormwater runoff during any storm event when compared to
the control due to high variability. The DT treatment did produce numerically lower
runoff for every storm event, ranging from 2-20% lower than the control, but the
differences were not significant due to variability.
Aeration increased sediment loss during 1 of 4 storm events, while tillage showed no
differences in sediment loss for any event, when compared to the control.
Tillage decreases bulk density, which would be expected to improve water
percolation, infiltration, and root/shoot growth. Bulk density was correlated with IR on Sites
1 and 3. As bulk density increased, IR decreased, indicating that it is an important factor that
The plots with the highest vegetative cover, which were the DT plots, generally had
the highest IR at Site 1. This was expected due to the fibrous rooting systems ability to
maintain the loosening of the soil caused by tillage. The relationship between bulk density
and vegetative cover at Site 1 suggests that quick vegetative establishment could also have
been one of the main variables that controlled IR, along with the decreased bulk density from
tillage operations. At Site 2, the infiltration rates and vegetation establishment were very low
7 weeks after plot establishment, even though bulk density was significantly decreased by
tillage. A combination of poor germination and high rainfall after treatment may have
resulted in surface sealing, which in turn greatly reduced IR. To avoid this, IR was measured
directly after treatment installation at Site 3 and the rates were much higher than at Site 2 for
both DT and CT treatments. However, there was a slight difference in average bulk density
following tillage between the two sites, which could have also caused the higher IR on Site 3.
The incorporation of compost did not improve IR at Site 3 and continued measurement of IR
should be conducted to determine the long-term impact of compost on maintaining IR.
The differences in temperature, rainfall, and wind during the time of early
germination between the three sites could explain some of the variation in grass growth and
IR. Site 1 was planted under ideal weather conditions in the early summer, while Sites 2 and
3 were planted in the winter. This is likely a major factor in the development of a healthy
stand of grass on Site 1 and a poor stand of grass on Sites 2 and 3.
Tillage showed no effect on stormwater runoff and sediment loss when compared to
the control due to high variability, although it did provide better results than the aerated
allowed more water to enter the soil rather than runoff. The tillage treatment had the lowest
runoff and sediment losses for all storm events, although differences were not statistical.
Aeration had no effect on bulk density, IR, and vegetative growth at Site 1, but it did
have a negative effect on runoff and sediment loss. It is possible that the aerator caused
compaction while removing relatively shallow cores, resulting in higher stormwater runoff
and sediment loss when compared to the control. Since the bulk density was unchanged, the
loose soil removed by the hollow tines was available when runoff occurred, leading to higher
sediment concentrations in the runoff. Cores were only able to penetrate up to approximately
2 cm due to the dry conditions and high compaction levels. A moist soil surface is imperative
when aerating compacted soils in order for the aerator tines to extend down to their
achievable depths. On a construction site, much larger and heavier equipment would be used
to aerate the soils which could increase the penetration depths of the aerator tines and
potentially provide better results.
Soil compaction has shown negative impacts on stormwater runoff, infiltration, and
vegetative establishment. Deep tillage is a practice that can be used in order to loosen the
soil for quicker vegetation establishment in the summer months, which in turn, can help
maintain higher IR. This is important from a management aspect because by increasing IR
and grass coverage, more water is forced to enter the soil surface rather than flowing offsite
or into other stormwater infrastructures. By decreasing the amount of water that flows
through ditches and into sediment basins, it is possible that stormwater infrastructure sizes
decreased and this allows for less maintenance on existing diversion ditches and sediment
basins.
Tillage prior to extended periods of rainfall on construction sites may produce less
satisfactory results due to the possibility of surface crusts forming and inhibiting IR, which
increases runoff and erosion from construction sites. Future research should be conducted
using tillage and aeration equipment comparable to that on a construction site in order to see
how the size of the equipment used affects penetration depths, as well as all other parameters
that were measured in this study. Time to runoff and cumulative infiltration are two other
important aspects of this research that should be evaluated. If time to runoff and cumulative
infiltration prior to runoff is high, then low steady state IR may not have such a negative
impact on stormwater runoff.
References
Abu-Hamdeh, N. H. (2003). Compaction and Subsoiling Effects on Corn Growth and Soil Bulk Density. Soil Science Society of America Journal, 67, 1213-1219.
Balbuena, R., Mac Donagh, P., Marquina, J., & Jorajuria, D., Terminiello, A., Claverie, J. (2002). Wheel Traffic Influence on Poplar Generation and Grass Yield. Biosystems Engineering, 81(4), 379-384.
Baldwin, C. M., Liu, H., & Brown, P. J. (2006). Effects of Core Cultivation Tine Entry on Golf Putting Greens. Horttechnology, 16(2), 265-269.
Bohm, W. (1979). Methods of Studying Root Systems. Berlin, Germany: Springer-Verlag. Botta, G. F., Rivero, D., Tourn, M., & Melcon, F., Pozzolo, O., Nardon, G., Balbuena, R.,
Becerra, A., Rosatto, H., Stadler, S. (2008). Soil compaction produced by tractor with radial and cross-ply tyres in two tillage regimes. Soil & Tillage Research, 101, 44-51.
Brady, N. C., & Weil, R. R. (2004). Elements of the Nature and Properties of Soils - Second Edition. Upper Saddle River, NJ: Pearson Prentice Hall.
Brauen, S. E., Johnston, W. J., & Goss, R. L. (1998, September/October) Long-Term Aerification. USGA Green Section Record, 13-15.
Busscher, W. J., Frederick, J. R., & Bauer, P. J. (2000). Timing Effects of Deep Tillage on Penetration Resistance and Wheat and Soybean Yield. Soil Science Society of America Journal, 64, 999-1003.
Carolina Lawns (AG-69),