Final Project
Measuring Workload at a ProRail Control
Post
Jaldertvan der Werf [email protected]
Faculty of Electrical Engineering, Mathematics and Computer Science University of Twente
8 Results 29
8.1 Integration in operational environment . . . 29
8.2 Stretch measurements . . . 30
8.3 Stretch validation by HRV . . . 31
8.4 Work distribution . . . 31
8.4.1 Distribution IWS scores . . . 32
8.4.2 Distribution XTL components . . . 33
9 Discussion 34 9.1 External cognitive task load . . . 34
9.2 Integrated Work Scale . . . 34
9.3 Heart rate variability . . . 35
9.4 Overall results . . . 35
10 Conclusion 36 10.1 Existing methods to measure workload . . . 36
10.2 Applying methods for measuring workload to a ProRail control post . . . 36
10.3 Detecting changes in workload . . . 36
10.4 Measuring workload of social-technical system in real-time . . . 37
11 Future work 38 11.1 Changes IWS interface . . . 38
11.2 Determine XTL constants . . . 38
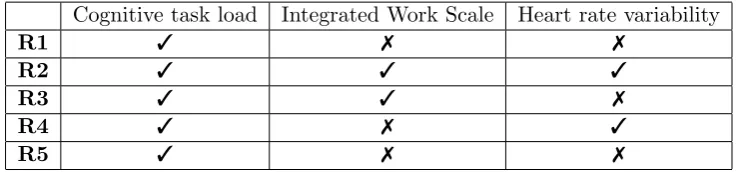
This results in the following requirements to integrate the workload measurements in a real-time setting:
• [R1] No interference with normal routine of rail signalers.
• [R2] Minimize required input from rail signalers (no more than one action per five minutes).
• [R3] Limit the set up time as much as possible (within five minutes).
• [R4] Keep systems running, no input from the researches should be required once the system has been set up.
• [R5] Keep systems running for longer periods, ideally 24/7.
1.4 Overview
The workload measurements take place at ProRail, the setting at ProRail in which rail signalers execute their job is described first. By defining the setting at the control post it is possible to determine what methods for measuring workload changes are applicable. There is looked into existing methods for measuring workload at control room settings which are applicable to the setting at ProRail as well. This consists mainly of studies for workload measurements in control room settings. Numerous studies in this field exist, the methods used in these studies are of interest for this research as well when they are applied in a similar setting. Existing methods are discussed in the related work section, the requirements are used to determine if a method can be used at ProRail. A method needs to be adapted or adjusted if the requirements are not met. In the end it results in applicable methods for measuring workload changes in a real-time setting at ProRail. Most important is to adjust a method in such a way that it is usable in this operational environment.
2
Setting
The research was conducted at ProRail control post Zwolle. ProRail is responsible for rail logistics in the Netherlands and has thirteen control posts over the country. Each control post handles train traffic in a specific region, post Zwolle handles train traffic in the north-eastern part of the Netherlands. A ProRail control post is a control room setting and an example of a socio-technical system due a high level of interaction between humans and the system. This setting was therefore suitable for measuring workload changes with regarding to weak resilience signals.
2.1 ProRail post Zwolle
Control post Zwolle is operational for 24 hours a day, 7 days a week. There are between 10 and 20 professionals active at each moment depending on the time and circumstances of the day. Rail signalers (train traffic controllers) were the group of interest for this research. Each rail signaler has a work station from which he manages train traffic for a number of railway stations and intermediate tracks. Rail signalers are responsible for all train traffic on the rail infrastructure, their tasks of managing train traffic consist mainly of logistics and safety tasks.
Post Zwolle was planning a reorganization to improve their performance and efficiency, tasks of rail signalers were divided differently because of this reorganization. In the original situation rail signalers were responsible for both the logistics and safety tasks. A rail signaler RSimanaged
train traffic on a work station WSi, this included logistics tasks (Li) and safety tasks (Si) for
this work station(WSi).
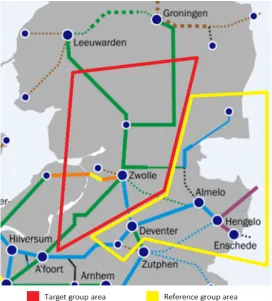
Rail signalers were divided in two groups, a target (GT) and a reference (GR) group. The
target group worked with split tasks after the reorganization and the reference group worked according to the original method (both safety and logistic tasks) during the complete research period. Tasks for rail signalers were split after the reorganization, meaning that a rail signaler handled safety or logistic tasks only.
Figure 1: Corridors for GT and GR
2.2 Splitting tasks
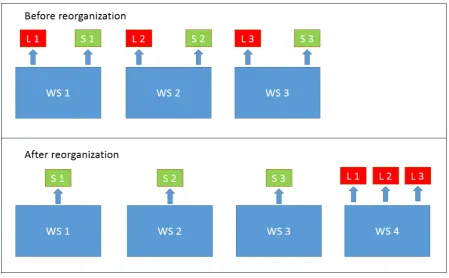
Splitting the logistics and safety tasks was the most structural change and had a potential influence on the workload. The target group GT consisted of four rail signalers RS1..4, three of
them used to operate work stations (WS1..3) with concerning logistic and safety tasks L1..3 and
S1..3. One rail signaler was extra and available for assistance during calamities or rush hours.
These four rail signalers handled the same work stations after the reorganization, the tasks were now split however. Safety tasks form the majority of work, so RS1..3 handled safety tasks S1..3
on WS1..3. RS4 handled logistic tasks L1..3 on an extra work station (WS4). Changes in the
Figure 2: Task deviation for GT. Changes in deviation of L1..n( logistics) and S1..n (safety) tasks
between work stations WS1..n before and after the reorganization.
The research was therefore situated around the reorganization. The research consisted of two sessions of a week (Monday till Friday) the first being before the reorganization and the second after the reorganization. Both GT and GRworked with the combined safety and logistics
tasks before the reorganization, after the reorganization GT worked with split tasks whereas GR
continued to work with combined tasks.
Figure 3: Cognitive task load model by Neerincx[2]
3.1.1 Creating a three dimensional load factor
The combination of task duration, level of information processing (difficulty) and switches form the cognitive task load. Neerincx used these three characteristics to create a three dimensional load space, see figure 3, in which human activities can be projected and have an indication of the cognitive load. The model defines states of task load that can occur. Overload occurs when the values for all three characteristics are high, it can occur at any give time. Underload on the contrary occurs when the values for the characteristics are low, temporary low values are not problematic and will not result in underload directly, underload occurs when the values are low for a significant amount of time. Another state of the model is vigilance in which problems increase in time. Vigilance causes a decrease in performance and stress due to specific task demands, such as the need to continuously paying attention on the task. Boredom can also be a sign of vigilance especially with high repetitive and homogeneous tasks. The final state of the task load model is cognitive lock-up which means that humans are incapable of adequately managing their tasks. Especially prioritizing between tasks is problematic since humans tend to stick to their current task even if a new task has a higher priority.
3.2 Stress-Strain model
Another approach is used in the stress-strain model by Woods[4]. This model is based on an analogy to the world of material sciences to measure the resilience of a socio-technical organi-zation. Siegel and Schraagen[1] propose a resilience state model for a railway organization that is based on Woods’ stress-strain model. They model resilience on the safety, performance and workload boundaries. The stress-strain model is used to measure the resilience of an organi-zation by mapping applicable components of the model to measure workload for the railway sector.
corresponds to the load analogous to the stretch of a material. Material sciences defines two regions of behavior, first their is elastic behavior. In the elastic region the demand (stress) and load (strain) increase uniformly, when the demand goes up the load rises in a similar fashion. Secondly there is a plastic region in which a material stretches non-uniformly until a failure point is reached.
The elastic region, referred to as the uniform response region, describes an organization with developed plans, procedures, training, personnel and related operational resources. The demand and load are balanced in this region, meaning that everything goes according to plan. The second region is characterized by non-uniform behavior. In material sciences this results in a non-uniform stretch or deformation of the material. In an organization it results in gaps in the ability to maintain a safe and effective production. These gaps are caused by a increasing demand and a load that cannot keep up with this rising demand. Plans and procedures need to be adapted to cope with this situation and to make sure it will not end up in failure. By adjusting strategies and acquiring additional resources it is possible to create a so called extra region. The extra region extends the capacity of an organization to cope with a increasing demand. This process can be repeated several times to avoid ending up in new failure point when these extra resources are exhausted. Figure 4 shows the stress-strain plot described in this section.
Figure 4: Demand (Stress) - Strain (Load) plot by Woods[4]
3.3 Integrated Workload Scale
The IWS scale is used by operators to rate their own workload. Self reporting by operators provides an accurate reflection of their workload, since operators are well aware of the situation they are coping with, the possibilities and limits of their equipment and they can estimate the workload for a situation based on previous experiences. One of the most widely used scales to measure workload is the NASA-TLX scale[7], but this scale is not usable in real-time in the field and not representative for rail signalers. Pickups IWS scale is specifically developed for rail signalers.
An multidimensional or unidimensional scale can be used to self report mental workload. For a multidimensional scale each aspect of workload needs to be rated separately whereas for an unidimensional scale the aspects are combined on one scale. The IWS scale is developed as an unidimensional scale since detecting peaks and troughs in the workload is the most important aspect for the rail sector. This is because the overall subjective state of the rail signaler is of interest and not subjective ratings of aspects of their work. Fluctuations in the global workload can be detected using this unidimensional scale plus it is also the most convenient way for rail signalers since they need to rate their workload on one scale only.
The IWS scale is based on the Instantaneous Self-Assessment (ISA) scale[8] since this scale was practical and very simple to use. Descriptors of the ISA skill were changed to terms that reflected the workload level of rail signalers more accurately. Changing the descriptors to termi-nology used by rail signalers should enhance the validity of the IWS tool. The new descriptors were gathered from interviews with rail signalers regarding workload. This approach let to typi-cal phrases to describe workload such as ”struggling to keep up”. Two human factor researchers gathered a set of 47 phrases and terms used to describe workload. Rail signalers were asked to score these phrases and this let to a nine-point scale. This IWS scale is depicted in figure 5.
Mental workload of rail signalers is gathered by letting rail signalers rate their workload on the IWS scale. It is possible to see fluctuations in workload when rail signalers rate their workload at a fixed interval, see figure 6 for an example output with an interval of 2 minutes. The IWS scale was tested in a simulator environment where rail signalers had to provide an IWS score at an interval of 2 minutes and it was also tested in a real world situation where rail signalers provided a score at 5 minute intervals. IWS ratings provided an interpretation of the workload as experienced by rail signalers.
Figure 6: Typical IWS output over a 35 minute period by Pickup[6]
3.3.1 IWS in practice
The IWS scale has been used in practice by Wilms and Zeilstra[9] in a real life setting. They conducted a study in the Netherlands for ProRail and used the IWS scale to measure subjective workload at 26 workstations. The experiment was performed in one-hour sessions in which a researcher asked for IWS scores of rail signalers at 5 minute intervals. Furthermore researchers watched for seven predefined activities such as monitoring, communication activities, computer interaction and reading/writing activities. Besides these predefined activities they also registered environmental (disruptions, type of workstation, time period) and personal (age, experience, gender) variables. The activities, environmental and personal variables were used to calculate an objective workload which was compared to the subjective workload derived from the IWS scores. No correlation was found between objective and subjective workload. Wilms and Zeilstra do not have a good explanation for this, they point out that further research is required and that one should be cautious when comparing and interpreting results from different tools to measure workload. A changed approach such as longer measuring sessions of IWS and a different way to extract the objective workload provide opportunities. Wilms and Zeilstra had researchers in the field who where asking rail signalers to rate their workload. Interrupting rail signalers in their normal routine can be of influence on their subjective workload. One of the requirements for this research was therefore that rail signalers should not be distracted from their work.
3.4 Physiological methods
4
Types of workload
The studies in the related work section provided possible approaches to measure workload. Pick-ups conceptual framework of mental workload for railway signalers[5] has been used to provide an accurate and complete representation of the workload of rail signalers. The framework is depicted in figure7. Three types of load are defined, the imposed load depends on task charac-teristics and is the same for all operators. The internal and perceived load depend on individual characteristics of the operator. For the perceived load there is a feedback loop from the work result. Results will influence the mental state of an operator and will effect his perceived load. Goals and strategies influence the physical and cognitive demand of operators and therefore the effort of operators. This will effect the performance and wellbeing and indirectly the perceived, subjective workload.
Figure 7: Mental workload framework by Pickup[16]
post Zwolle:
1. Cognitive workload
2. Subjective workload
3. Physiological workload
Combining these three types of workload has not been done and has not been applied to the railway sector before.
4.1 Cognitive workload
Neerincx[2] described his model for cognitive task load consisting of task complexity, task switches and task duration. These three components have been used as a basis to define a cognitive workload in the context of rail signalers. Task complexity has been determined by listing the tasks of rail signalers and categorizing these tasks according to their complexity. For task switches there needed to be determined how many tasks are handled by rail signalers and how many (external) events are of influence on their performance and therefore workload. Task duration has been determined by looking at the number of tasks for each interval of 5 minutes. A 5 minute interval has been used for the other types of workload (subjective and physiological) as well. Using the same interval made it possible to lists the scores for the different types of workload for the same interval.
4.2 Subjective load
Pickup’s IWS scale[6] has been used to measure the subjective workload. It had already been used in practice by Wilms and Zeilstra[9], but they were unable to find a correlation between objective (cognitive) workload and subjective workload. A key aspect was that they measured IWS for periods of one hour, in this approach the duration has been extended by measuring IWS scores for longer periods. Scores were also collected manually in Wilms and Zeilstra’s study, a researcher needed to be present for the complete duration of the experiment. Researcher have been omitted by automating the process of gathering IWS scores, a potential benefit for this approach was the ability to up-scale the experiment (measuring subjective workload at multiple workstations simultaneously) and making it easier to measure subjective workload for longer periods of time.
4.3 Physiological arousal created by workload
long periods, let alone for 24 hours a day.
The method in itself was usable and relatively easy to implement. To meet the requirements it was necessary to limit the role of the researcher as much as possible. Having a researcher standing by cannot be done for long periods and has a large impact on the routine of rail signalers which was unacceptable during a measurement session in an operational environment.
5.1.3 Heart rate variability
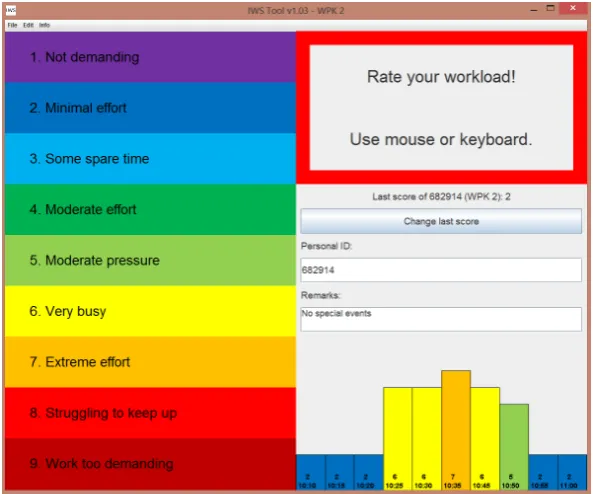
activ-Figure 8: IWS interface for rail signalers
that rail signalers were continuously bothered during their work (R1). Gathering IWS scores for longer periods was not possible using this approach (R4andR5). The process of gathering IWS scores was automated to overcome these issues.
6.2.1 IWS user interface
A user interface for rail signalers was developed that could be used to gather IWS scores through-out the day. The interface with the IWS scale was available at the work station of each rail signaler. Scores needed to be entered at a five minute interval, a warning ’bleep’ and a red blinking rectangle in the interface reminded a rail signaler to enter a score. The score repre-sented their subjective workload on a scale from 1 to 9. The interface was kept as simple as possible, since the rail signalers should not be distracted. The left half of the screen contained the IWS scores. Rail signalers could click on the score or press the corresponding number on the keyboard to register their score. The right half of the screen was split in three blocks, the upper block contained a timer that indicated when to enter the next score. Rail signalers could change their last entry, provide their personal ID (only necessary at the beginning of a session) and could leave comments in the middle block. A graphical representation of the last ten scores including time stamps was shown in the lowest block.
See figure 8 for the IWS interface (terms were in Dutch in the version presented to the rail signalers). Scores had to be entered at 5 minute intervals, when a rail signaler forgot to enter a score it was filled backwards, meaning that the new score was entered for the previous missed intervals. There was also the possibility to correct the last entered score and to leave comments. Scores were stored in log files and were imported into the same database used for XTL data.
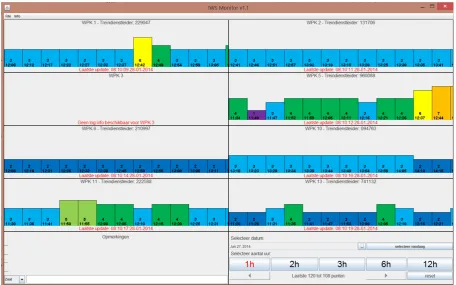
6.2.2 Monitoring interface
Figure 9: Monitoring interface
station were shown, this corresponded with the last hour since a 5 minute interval was used. The view could be adjusted to show more data and it was possible to browse through the history of IWS scores for each work station. Main advantage of this overview was that it was easy to spot busy work stations, before it was required to check each work station individually.
6.3 Heart rate sensor
Physiological workload was measured using a heart rate sensor. The Zephyr HxM BT heart rate sensor was used, this sensor can be strapped to a belt and worn on your chest. Heart rate data was gathered via blue-tooth and was logged on a nearby laptop. The sensor transmits the 15 latests R-R intervals, a time stamp and some meta data every second. An advantage of this particular sensor was that it sends the latest 15 R-R intervals each time it transmits. Gaps in the data could easily be restored as long as the signal was picked up at least every 15 seconds by the laptop.
Log files containing the average heart rate and SDNN of R-R values for each time slot were stored for each work station in the same database as before in order to match the HRV data to XTL and IWS data later on.
6.4 Stretches
Figure 10: Objective- and subjective stretch of XTL and IWS in time
A new metric called ’stretch’ was introduced to compare XTL and IWS values during these events. The IWS base-line was used to define the steady state of the system. The start of a stretch is when the IWS score deviates from its base-line and the end of the stretch is when the IWS score is at its base-line again. IWS scores were a reaction of rail signalers on system activities, the real start and end of a stretch were therefore not always in line with the IWS scores. The start of the stretch was therefore adjusted to the first minimum of the XTL score before the rising of the IWS score and the end was adjusted to the first minimum of the XTL score after the IWS score reaches its base-line again. See figure 10 for a visual representation of a stretch.
7
Measurement sessions at ProRail post Zwolle
Two measurement sessions were held at ProRail post Zwolle. The sessions surrounded the reorganization at post Zwolle in December 2013. The first session, in which both the target (GT) and reference (GR) group had the same tasks for rail signalers, was directly before the
reorganization. The measurements were held from Monday November 25 till Friday November 29, 2013. The measurements took place on a daily basis from 7:00 AM till 9:00 PM. The second session was two months after the reorganization, this was chosen to eliminate effects from getting used to the new situation. It was held from Monday January 27 till Friday January 31, 2014. The measurements were extended to 24 hours per day during this second session, so night shifts were included as well.
7.1 Differences
The main difference was that GTworked according to the reorganization. Tasks for rail signalers
were split in safety and logistic tasks. First there were three active rail signalers in GT and one
extra rail signaler who could assist in rush hours or in case of calamities. After the reorganization there were three rail signalers for safety tasks and one rail signaler for logistic (planning) tasks for the complete group. GR worked similar to the situation before the reorganization.
There were a few changes between the two measurement sessions. The night shift was included during the second week and the IWS interface that rail signalers used to rate their sub-jective workload was on a laptop at their work station during the first week, but was integrated in their operational system during the second week, see figure 11.
7.2 Research population
The population for the research consisted of 44 participating rail signalers, 79.5 % of the group were males. Ages varied from 23 to 64 years, with a mean of 43.6 years. Experience as rail signaler varied between 0 and 37 years, with 17.6 years on average. XTL data is gathered from ProRail logging and 100 % of the rail signalers took part in the IWS measurements. There is therefore a complete data set of all work stations for XTL and IWS data. Only 39 % of the rail signalers took part in the HRV measurements. The main reason for not participating with the HRV measurements were objections against wearing a belt with the heart rate sensor.
8.3 Stretch validation by HRV
Subjective stretches were validated by HRV values, when a stretch occurred the subjective workload (IWS) score went up. This effect should be noticeable in the HRV values. The HRV should decrease in such a situation according to Togo and Tahakashi[15]. This effect has been analyzed for the first week. The highest value of HRV on the boundaries of a stretch was marked, multiplied by the stretch duration and subtracted by the integral under HRV for the complete stretch. A negative value confirms the subjective stretch according to the literature, this was the case in 83 % of stretches where HRV data was available.
8.4 Work distribution
The distribution of workload is an interesting aspect, especially for the target group. The target group was handled from three work stations before the reorganization, an extra planner work station was added after the reorganization. The effects of this extra work station are clearly visible in the distribution of activities for the target group, see figure 13. The distribution for the activities of rail signalers (monitoring, planning, manual action and communication) and task activations (events) is shown in this figure. For each activity there is shown for each work station in the target group how much activities occurred. The height of the bar is determined by the sum of all normalized actions for that specific activity during the week. A higher bar means a higher number of actions. The yellow line is the distribution between work stations for that activity. The distribution is the standard deviation over the work stations. For monitoring the distribution is quite high, since there is variability between the work stations. For communication the distribution is quite low, since communication activities occur to the same extent for the different work stations.
Figure 13: Work distribution target group
the corresponding ’standard’ work stations. This seemed to be a correct approach based on observations.
There was also a large difference in monitoring actions, this is due to the infrastructure that is allocated to the work stations. Work station 2 handled far more monitoring actions both before and after the reorganization. Monitoring actions require relatively less effort from rail signalers since it are automated actions. Apart from planning actions the distribution was similar before and after the reorganization. The distribution of work for the reference group was also similar before and after the reorganization, see figure 14.
Figure 14: Work distribution reference group
8.4.1 Distribution IWS scores
The distribution of IWS scores for the second measurement week is shown in figure 15. From this distribution can be derived that the IWS scores were quite low, 62 % was a score of 2 (minimal effort) and only 0.6 % was a score of 6 or higher, which was considered for abnormal situations such as calamities. Rail signalers were experiencing underload for the majority of time. This can be explained by the fact that rail signalers only have to monitor when all train activities were handled according to plan. Rail signalers come into play when something goes wrong.
8.4.2 Distribution XTL components
Figure 16 shows the distribution of XTL components over the second measurement session. It shows the difference between the distribution of the normalized XTL components (monitoring-, planning-, manual activities and communication) over the complete session and for times when the subjective workload was high (IWS scores of 6 or higher). The orange bars show the average of all normalized values of the corresponding XTL components for each time slot and all work stations during the second measurement session. The blue bars were calculated similarly, but scores for XTL components were only used if the XTL score for that time slot had a score of 6 or higher. The values for each component can lie between 0 and 1 since the normalized values are shown.
The graph shows the difference in the distribution of the different XTL components, the or-ange bars represent the distribution of the components over the complete measurement session and the blue bars represent the distribution of the XTL components at the time of calamities. An increase is shown for all XTL components during calamities, but communication rises excep-tionally. This shows that communication becomes a key factor during calamities and takes up a major part of the time of rail signalers. The average score of communication was 0.45 during calamities, this means that 45 % of the time was spend on phone calls in this situation.
A disadvantage of subjective scoring is that rail signalers could be influenced by other things apart from their job when rating their workload. Personal problems could therefore influence the submitted IWS scores for instance. It is very hard to prove this effect, especially in what way scores are influenced by factors other than their job.
9.3 Heart rate variability
HRV was used to measure the physiological workload. The participation of rail signalers for the HRV measurements was quite low (39 %). Most rail signalers that refused to participate had objections against the heart rate sensors. Rail signalers did not like the idea of wearing a heart rate sensor or found it uncomfortable to wear the sensor around their chest. There are alternatives to measure the heart rate, for instance using a sensor around the wrist. Chances are however that the same objections still apply.
Another solution can be to use another measure to determine the physiological workload. Blink rate, pupil size or skin conduction can also be used as measurements. Changing the measurement leads to a completely different approach that might have other disadvantages such as the need for new measuring devices.
9.4 Overall results
The results over the two measurements sessions are constant. The average stretch-ratios for the target and reference group are in the same order of magnitude for both weeks. The reorganization had influence on the workload distribution for planning activities, which was expected. There was no detectable change in the overall workload however.
real-time, it took a few days before this data was available. This was no problem in this stage since is was not necessary to process the XTL data real-time.
A new metric called ’stretch’ was introduced to compare XTL and IWS scores during a (cluster) of events. Stretches are basically changes in workload since they are marked by a rising of IWS and XTL scores. The stretch-ratio has been introduced as well, defined by the subjective- divided by the objective stretch and can be used to compare stretches to each other. A stretch with a higher stretch-ratio compared to one with a lower stretch-ratio indicates a higher subjective workload for the same objective workload and therefore a change in the relative workload.
10.4 Measuring workload of social-technical system in real-time
11
Future work
This research is a first step for real-time measuring workload in an operational environment. The method developed can be extended and improved on a number of levels. This section provides some suggestions for this.
11.1 Changes IWS interface
The IWS interface has been used by all rail signalers during the two measurement sessions. The required input from rail signalers is limited, but they need to provide a score every 5 minutes. It is corrected when rail signalers forget to enter a score, in this situation the newly entered score is also filled in for the missing time slots. During the research we noticed that rail signalers were more willing to enter a score when their scores changed. So if a rail signaler has a base level of 2 and he does not enter a score for half an hour and he would enter a score of 3 the score of 3 would be entered for the missing interval as well. Since rail signalers are more willing to enter a score upon change it might be better to fill the missing scores with the last entered scores, so in this example fill in a score of 2 for the missing intervals. This requires that the rail signaler must fall back on the base-line by himself, otherwise the system will be filling the gaps with a higher score.
11.2 Determine XTL constants
The XTL constants for monitoring, planning, manual and communication actions are still set to 1. It makes sense to adjust these constants since the required effort for these actions is most likely different. From the XTL component distribution we can already see that communication plays a major part when the workload increases, so it therefore likely to increase the share of communication actions in the XTL formula by raising its constant. The relation between actions and effort need to be further investigated.
11.3 Real-time logging data
[15] F. Togo and M. Takahashi, “Heart rate variability in occupational health –a systematic review.,” Industrial health, vol. 47, pp. 589–602, Dec. 2009.
[16] L. Pickup, J. Wilson, and E. Lowe, “The Operational Demand Evaluation Checklist (ODEC) of workload for railway signalling.,” Applied ergonomics, vol. 41, pp. 393–402, May 2010.
![Figure 3: Cognitive task load model by Neerincx[2]](https://thumb-us.123doks.com/thumbv2/123dok_us/1053761.1131719/11.595.168.423.83.341/figure-cognitive-task-load-model-by-neerincx.webp)
![Figure 4: Demand (Stress) - Strain (Load) plot by Woods[4]](https://thumb-us.123doks.com/thumbv2/123dok_us/1053761.1131719/12.595.129.458.343.604/figure-demand-stress-strain-load-plot-woods.webp)
![Figure 5: IWS scale for rail signalers by Pickup[6]](https://thumb-us.123doks.com/thumbv2/123dok_us/1053761.1131719/13.595.79.491.417.714/figure-iws-scale-rail-signalers-pickup.webp)
![Figure 6: Typical IWS output over a 35 minute period by Pickup[6]](https://thumb-us.123doks.com/thumbv2/123dok_us/1053761.1131719/14.595.147.449.203.343/figure-typical-iws-output-minute-period-pickup.webp)
![Figure 7: Mental workload framework by Pickup[16]](https://thumb-us.123doks.com/thumbv2/123dok_us/1053761.1131719/17.595.82.521.264.561/figure-mental-workload-framework-by-pickup.webp)